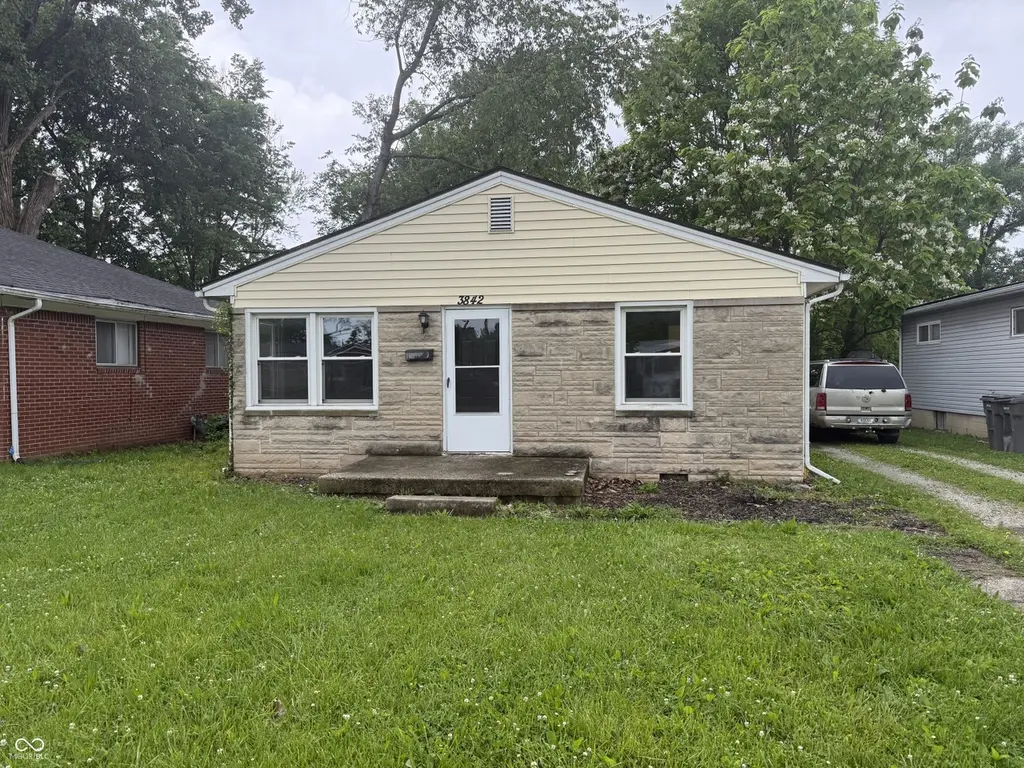
3842 N Butler Ave · Indianapolis city (balance), IN
Flood risk 1/10 · Minimal
- FEMA flood zone
- X (unshaded)
- Chance of flooding over 30 yrs
- 0.0%
- Est. flood insurance / yr
- $507 – $1,088
Fire risk 1/10 · Minimal
- Est. fire insurance / yr
- $717 – $1,331
Heat risk 3/10 · Minor
- Hot days now (above 101°F)
- 7 days/yr
- Hot days in 30 yrs
- 18 days/yr
Wind risk 2/10 · Minimal
- Chance of severe wind over 30 yrs
- 0.0%
Air-quality risk 4/10 · Minor
- Unhealthy air days now
- 5 days/yr
- Unhealthy air days in 30 yrs
- 7 days/yr
Risk factors via First Street. Map © Google.
Why this score? — see what drove the D- grade
The composite is a weighted blend of 9 inputs, each scored 0–100. Each bar is that input's sub-score; the figure is the points it added to the 100-point composite (weight × sub-score).
- Cash flow +15.8/30.0
- DSCR +4.9/10.0
- 1% rule +4.7/10.0
- Rent growth +4.2/5.0
- Livability +2.5/5.0
- Condition / age +2.5/5.0
- Schools +1.4/10.0
- ARV discount +0.4/15.0
- Appreciation +0.0/10.0
$134,900
🖨 Deal sheet (PDF) 📄 Offer letter ✓ Due diligence
Listing remarks MLS
This 3 bedroom 1 bathroom home with a 1 car detached garage is a must see. It is located near shopping and dining, it's on a bus line near the interstate and minutes from downtown.
Key facts
- 9,583 sq ft lot
- Garage
- Built 1959
Property features AI
Exterior
- Parking: Detached garage (1 car)
- Security: Smoke detector(s)
- Utilities: Public water; Municipal sewer connection; Electric with circuit breakers; No solid waste service indicated
- Home design: Single family residence; One level
- Construction: Vinyl with stone and stone exterior; Crawl space foundation
- Exterior features: Lot smaller than 1/4 acre (approx. 0.22 acre); Driveway parking
Interior
- Kitchen: Eat-in kitchen; Refrigerator
- Bedrooms: Three bedrooms on the main level (sizes include 11x11, 10x11, 10x10)
- Flooring: Hardwood floors
- Bathrooms: One full bathroom on the main level
- Heating & cooling: Forced air heating (natural gas); No central air
- Interior features: Hardwood floors; Eat-in kitchen; Updated/remodeled condition; Smoke alarm; Crawl space foundation; Smoke detector(s)
- Laundry & utility: Gas water heater; Water heater
Neighborhood map
What this means for you Summary
Snapshot
- This is a 3-bed/1.0-bath single-family listed at $135k.
Deal economics
- At list price, monthly cash flow is $62 ($741/yr) — positive.
- The deal already cash-flows at list — no discount required.
- To meet the 1% rule (rent ≥ 1% of price), the offer needs to be $130k (3.3% below list).
- Recommended offer: $130k (3.3% below list) — sets the bar for 1% rule.
- Cap rate 6.8% vs local median 4.4% in Indianapolis city (balance) — top-decile yield for the area; either an underpriced asset or a hidden risk that comps aren't pricing in. Stress-test before assuming the spread holds.
Location & tenants
- Location reads: area grade D — affects rentability + tenant quality, not the cash-flow math above.
- Indianapolis Public Schools (urban): math 14% / reading 20% proficiency, ranked #286 of 301 in IN (top 95%) — low school quality limits family demand, transient renter base, plan for 1-2y turnover; 77% free/reduced lunch — lower-income household profile, screen leases tightly.
- Zoned schools: Center For Inquiry School 84 (math 64% / reading 69%, grade B+, #65 of 994 statewide, top 7%, 469 students, 8% FRL); H L Harshman Middle School (math 3% / reading 16%, grade F, #316 of 330 statewide, top 96%, 549 students, 84% FRL) — zoned schools average 46% FRL vs 77% district-wide (31 pts lower); this property's tenant base skews higher-income than the district average.
- Zoned-school proficiency averages 38% at this address vs 17% district-wide (+21 pts) — the actual schools serving this property are materially stronger than the Indianapolis Public Schools average implies; a family-tenant draw the district grade alone would hide.
- Market conditions: Rents rising fast (+6.8%/yr); 153 active listings in the ZIP; 37 comparable units currently listed for rent nearby; rentals at typical pace (median 24d on market — plan ~3-4 weeks tenant-placement turnaround); 1,906 units permitted in Marion County in 2024 (621 in 5+ unit buildings).
- This rent runs 31% of the median local income ($50k/yr) — at the standard rent-burdened threshold; future hikes will face affordability resistance.
Forward outlook
- Local home prices are declining (-3.0%/yr); year-one equity from $933 of loan paydown is wiped out by about $4k of value loss. Plan a longer hold.
- Marion County population projected at +18% by 2050 — long-run rental-demand tailwind backs the buy-and-hold thesis.
Negotiation context
- It's been on market 16 days — a 2% lower offer ($133k) is reasonable based on typical stale-listing flexibility.
- 5 sale attempts since 22y ago with the ask held roughly flat each time — persistent listings suggest the price (not the market) is what's stuck; bring a comps-based counter.
- Current owner paid $47k; list at $135k implies a 187% gain — meaningful room to come down on a strong offer.
Risks & watch-outs
- Watch-outs: built in 1959 — expect roof / HVAC / electrical / plumbing capex.
Questions for the listing agent
- Built in 1959 — when were the roof, HVAC, electrical panel, plumbing, and water heater last replaced?
- Is there a deadline driving the sale (1031 exchange, divorce, estate, relocation)? That informs how much negotiation room exists.
- The area grade is low — what's the realistic commute time and amenity access for the typical tenant pool here? Any planned neighborhood developments (good or bad) we should know about?
- What's the average days-on-market for RENTAL listings here right now (not sales)? A rising rental-DOM trend means longer vacancies and softer asking-rent achievability than the comps imply.
- What's the recent tenant-quality profile in this submarket — average credit score on applications, eviction rate, late-payment / NSF rate, and stable-employment percentage? A property-management company in the area should have these aggregated.
- How much new for-sale + rental construction is in the pipeline within 1–3 miles? Heavy new supply typically softens prices + rents 12–24 months out; constrained supply supports both.
Investment metrics
- 1% rule
- 0.97% ✗
- Cap rate
- 6.84%
- Cash-on-cash
- 1.96%
- DSCR
- 1.09
- GRM
- 8.6
CMA / ARV
- ARV (on-the-fly)
- $116,584
- Comps found
- 12
Show comp detail 12 sales within ~0.75 mi
| Address | Dist | Beds/Ba | Sqft | Sold | Price | $/sf | Match |
|---|---|---|---|---|---|---|---|
| 3938 N Grand Ave | 0.13mi | 3/1.0 | 993 (+0%) | 9mo | $135,000 | $136 | 86 |
| 3505 N Emerson Ave | 0.47mi | 3/1.0 | 972 (-2%) | 10mo | $115,000 | $118 | 67 |
| 3901 Wallace Ave | 0.43mi | 2/1.0 (-1) | 1,047 (+6%) | 0mo | $55,000 | $53 | 65 |
| 3536 N Hawthorne Ln | 0.40mi | 3/2.0 | 925 (-6%) | 6mo | $149,900 | $162 | 62 |
| 3614 N Whittier Pl | 0.43mi | 3/2.0 | 912 (-8%) | 3mo | $171,999 | $189 | 60 |
| 3904 N Graham Ave | 0.57mi | 3/1.0 | 1,080 (+9%) | 1mo | $107,000 | $99 | 57 |
| 3715 N Irvington Ave | 0.30mi | 4/1.0 (+1) | 1,104 (+12%) | 5mo | $120,000 | $109 | 57 |
| 5415 E 34th St | 0.65mi | 2/1.0 (-1) | 908 (-8%) | 2mo | $107,000 | $118 | 50 |
| 3302 N Butler Ave | 0.71mi | 3/1.0 | 925 (-6%) | 10mo | $130,000 | $141 | 48 |
| 3536 N Priscilla Ct | 0.72mi | 3/1.0 | 1,102 (+12%) | 5mo | $133,500 | $121 | 43 |
| 3607 N Graham Ave | 0.69mi | 3/1.0 | 1,102 (+12%) | 8mo | $116,000 | $105 | 42 |
| 4850 E 34th St | 0.71mi | 2/1.0 (-1) | 1,125 (+14%) | 5mo | $95,000 | $84 | 34 |
Match score weights: distance 35% · size 25% · config 20% · recency 20%. Top-matched comps best support the ARV.
Projected returns pro-forma
-3.0% appreciation · 6.76% rent growth · sell at horizon
- IRR
- -8.9%
- Equity multiple
- 0.66×
- Total profit
- $-12,766
- Equity at exit
- $20,114
- IRR
- 5.1%
- Equity multiple
- 1.45×
- Total profit
- $16,821
- Equity at exit
- $11,664
Cash invested: $37,772 (down + closing). Projections, not guarantees.
Landlord ↔ Tenant lean methodology
- Overall (STATE)
- 90 Strongly Landlord-Friendly
- State Indiana
- 90 Strongly Landlord-Friendly · R+11
- County
- — inherits STATE
- City
- — inherits STATE
ZIP-level market 46226
- Rents YoY
- 6.8%
- Active inventory
- 153
- Price-to-rent
- 8.6×
Monthly cashflow live
- Estimated rent
- $1,304 high interval (Pro) →
- Mortgage (P&I)
- −$707
- Tax from tax record
- −$205 /mo · $2,459/yr
- Insurance
- −$56
- HOA
- −$0
- Vacancy / Maint / Mgmt
- −$274
- Net cashflow
- $62
Break-even live
Sensitivity live
| Price | -10% $138 | -5% $100 | +0% $62 | +5% $24 | +10% $-15 |
|---|---|---|---|---|---|
| Rent | -10% $-41 | -5% $10 | +0% $62 | +5% $113 | +10% $165 |
| Rate | -1.0pp $130 | -0.5pp $96 | base $62 | +0.5pp $27 | +1.0pp $-9 |
UW: 25.0% down · 7.5% · 30yr · 1.5% tax · 5.0% vac · 8.0% maint · 8.0% mgmt
Financing live
Cash to close
- Down payment
- $33,725
- Closing costs
- $4,047
- Reserves months
- —
- Total cash needed
- —
Loan-product check · same deal, 3 products live
Conventional
25% down · 7.5% · 30yr
- Down + closing
- —
- Monthly P&I
- —
- Monthly cashflow
- —
- DSCR
- —
- Eligible?
- —
Personal DTI + credit; lowest rate.
DSCR
20% down · 8.5% · 30yr
- Down + closing
- —
- Monthly P&I
- —
- Monthly cashflow
- —
- DSCR
- —
- Eligible?
- —
No personal income docs; deal must DSCR.
Hard money
10% down · 12.0% · 12mo
- Down + closing
- —
- Monthly P&I
- —
- Monthly cashflow
- —
- DSCR
- —
- Eligible?
- —
Short-term bridge; refi at stabilization.
Rent comps 37 comps
| Address | Beds | Baths | Sqft | Rent | $/sqft | DOM | Units | Dist |
|---|---|---|---|---|---|---|---|---|
| 3815 N Grand Ave Unit 3815 Indianapolis, IN | 2.0 | 1.0 | 965 | $1,250 | $1.30 | 6d | 1 | 0.04mi |
| 3639 N Emerson Ave Indianapolis, IN | 4.0 | 1.0 | 1000 | $1,450 | $1.45 | 23d | 1 | 0.28mi |
| 3636 N Whittier Pl Indianapolis, IN | 3.0 | 1.0 | 912 | $995 | $1.09 | 9d | 1 | 0.42mi |
| 3516 N Hawthorne Ln Indianapolis, IN | 3.0 | 1.0 | 925 | $1,225 | $1.32 | 6d | 1 | 0.45mi |
| 5602 Glencoe St Indianapolis, IN | 3.0 | 1.0 | 1000 | $1,749 | $1.75 | 19d | 1 | 0.54mi |
| 3718 N Audubon Rd Indianapolis, IN | 3.0 | 1.0 | 875 | $1,300 | $1.49 | 25d | 1 | 0.56mi |
| 3836 Priscilla Ave Indianapolis, IN | 3.0 | 1.5 | 1040 | $1,275 | $1.23 | 3d | 1 | 0.65mi |
| 3316 N Emerson Ave Indianapolis, IN | 3.0 | 1.0 | 912 | $1,100 | $1.21 | 25d | 1 | 0.70mi |
| 3301 Mardenna Ave Indianapolis, IN | 3.0 | 1.0 | 925 | $1,200 | $1.30 | 45d | 1 | 0.71mi |
| 3319 N Hawthorne Ln Indianapolis, IN | 3.0 | 1.0 | 1084 | $1,100 | $1.01 | 25d | 1 | 0.73mi |
| 3332 Wallace Ave Indianapolis, IN | 3.0 | 1.0 | 936 | $1,600 | $1.71 | 25d | 1 | 0.83mi |
| 3315 N Euclid Ave Indianapolis, IN | 2.0 | 1.0 | 780 | $1,300 | $1.67 | 16d | 1 | 0.97mi |
| 3725 N Sherman Dr #7 Indianapolis, IN | 2.0 | 1.0 | 729 | $845 | $1.16 | 5d | 1 | 1.15mi |
| 3725 N Sherman Dr #7 Indianapolis, IN | 2.0 | 1.0 | 729 | $845 | $1.16 | 0d | 1 | 1.15mi |
| 3142 N Euclid Ave Indianapolis, IN | 3.0 | 1.0 | 1050 | $1,050 | $1.00 | 45d | 1 | 1.16mi |
| 4404 Park Forest Ct Indianapolis, IN | 2.0 | 1.0 | 928 | $1,180 | $1.27 | 23d | 2 | 1.22mi |
| 3149 N Gladstone Ave Indianapolis, IN | 3.0 | 1.5 | 1036 | $1,350 | $1.30 | 9d | 1 | 1.23mi |
| 4430 Park Forest Ct Indianapolis, IN | 2.0 | 1.0 | 928 | $1,180 | $1.27 | 45d | 1 | 1.23mi |
| 4411 Park Forest Ct Indianapolis, IN | 2.0 | 1.0 | 928 | $1,180 | $1.27 | 45d | 1 | 1.23mi |
| 2950 N Dequincy St Indianapolis, IN | 3.0 | 1.0 | 888 | $1,375 | $1.55 | 15d | 1 | 1.25mi |
| 4438 Park Forest Ct Indianapolis, IN | 2.0 | 1.0 | 928 | $1,180 | $1.27 | 45d | 1 | 1.25mi |
| 4429 Park Forest Ct Indianapolis, IN | 2.0 | 1.0 | 928 | $1,180 | $1.27 | 0d | 1 | 1.25mi |
| 4555 N Arlington Ave Indianapolis, IN | 1.0–3.0 | 1.0–1.5 | 880 | $1,379 | $1.57 | 5d | 30 | 1.26mi |
| 4615 E 30th St Indianapolis, IN | 2.0 | 1.0 | 660 | $1,100 | $1.67 | 25d | 1 | 1.26mi |
| 4437 Park Forest Ct Indianapolis, IN | 2.0 | 1.0 | 928 | $1,180 | $1.27 | 45d | 1 | 1.26mi |
| 4445 Park Forest Ct Indianapolis, IN | 2.0 | 1.0 | 928 | $1,180 | $1.27 | 4d | 1 | 1.27mi |
| 4504 Park Forest Ct Indianapolis, IN | 2.0 | 1.0 | 928 | $1,180 | $1.27 | 4d | 1 | 1.28mi |
| 3615 Sherman Forest Dr Indianapolis, IN | 4.0 | 1.0–2.5 | 1057 | $1,544 | $1.46 | 6d | 1 | 1.29mi |
| 4521 Park Forest Ct Indianapolis, IN | 2.0 | 1.0 | 700 | $1,180 | $1.69 | 5d | 1 | 1.30mi |
| 2932 Arthington Blvd Indianapolis, IN | 3.0 | 1.0 | 900 | $1,350 | $1.50 | 25d | 1 | 1.32mi |
| 4537 Park Forest Ct Indianapolis, IN | 2.0 | 1.0 | 928 | $1,180 | $1.27 | 45d | 1 | 1.35mi |
| 4545 Park Forest Ct Indianapolis, IN | 2.0 | 1.0 | 928 | $1,180 | $1.27 | 45d | 1 | 1.35mi |
| 4405 Park Forest Ct Indianapolis, IN | 2.0 | 1.0 | 928 | $1,180 | $1.27 | 25d | 1 | 1.37mi |
| 3383 Station St Indianapolis, IN | 3.0 | 1.0 | 744 | $1,250 | $1.68 | 25d | 1 | 1.39mi |
| 3522 N Olney St Indianapolis, IN | 3.0 | 1.0 | 768 | $1,300 | $1.69 | 45d | 1 | 1.47mi |
| 4115 Meadows Dr Indianapolis, IN | 1.0–3.0 | 1.0–2.0 | 1013 | $1,592 | $1.57 | 45d | 9 | 1.48mi |
| 3421 N Olney St Indianapolis, IN | 2.0 | 1.0 | 720 | $1,195 | $1.66 | 18d | 1 | 1.48mi |
Listing history 11 events
-
2026-06-21days on market $134,900 Active 16 DOM
-
2026-06-18days on market $134,900 Active 13 DOM
-
2026-06-17days on market $134,900 Active 12 DOM
-
2026-06-16days on market $134,900 Active 11 DOM
-
2026-06-15days on market $134,900 Active 10 DOM
-
2026-06-13days on market $134,900 Active 8 DOM
-
2026-06-13days on market $134,900 Active 7 DOM
-
2026-06-09days on market $134,900 Active 4 DOM
-
2026-06-08days on market $134,900 Active 3 DOM
-
2026-06-07remarks 620-char remark
-
2026-06-07$134,900 Active 2 DOM
ⓘ Source: listings_history table (triggers on properties + properties_extension) + one-shot
backfill from property_details.listing_events for pre-trigger history.
Tax reassessment forecast IN · Partial reset (capped growth)
- Current annual tax
- $2,459 · $205/mo
- Projected year-2 tax
- $2,459 · $205/mo
- Expected delta
- $0/yr ($0/mo · 0.0%)
ⓘ Screening estimate from a state-policy table — verify with the county assessor before closing.
Climate risk First Street
- Flood 1/10 Low FEMA zone X (unshaded) · 0% chance over 30 yrs
- Wildfire 1/10 Low
- Heat 3/10 Moderate 7 d/yr ≥101°F today · 18 d/yr by 30 yrs out
- Wind 2/10 Low 0% chance of damaging wind over 30 yrs
- Air quality 4/10 Moderate 5 unhealthy d/yr today · 7 by 30 yrs out
Nearby sold comps map
Loading sold comps map…
Walkable amenities ~0.75 mi
Loading nearby amenities…
Taxation est. · year 1
- Rental income
- $15,651
- − Mortgage interest
- −$7,556
- − Property taxes
- −$2,459
- − Insurance
- −$674
- − Repairs & maintenance
- −$1,252
- − Management
- −$1,252
- − Depreciation
- −$3,924
- Taxable loss
- −$1,468
- Est. tax savings @ 24.0%
- +$352
- After-tax cash flow
- $1,093/yr
For passive investors: Depreciation is non-cash, so a rental often shows a tax loss while cash-flowing — sheltering income. Rental losses are passive: they offset passive income freely, and up to $25,000/yr can offset ordinary (W-2) income if you actively participate and your MAGI is under $100k (phasing out to $0 by $150k); unused losses carry forward. On sale, claimed depreciation is recaptured at up to 25%, and gains may owe capital-gains tax (a 1031 exchange can defer both). Figures are a year-1 estimate at your 24.0% rate — not tax advice; consult a CPA.
Schools (NCES district)
- District
- Indianapolis Public Schools
- NCES district ID
- 1804770
- Math proficiency
- 14% ▼ -7.00%
- Reading proficiency
- 20% ▼ -3.00%
- Median HH income
- $32,034
- Composite
- 13.69/100
- National rank
- #9499
- State rank
- #286 of 301 in IN
Livability — Indianapolis city (balance)
No livability data for this city. (Only ~50 U.S. cities are tracked.)
Census & demographics
- Census place
- Indianapolis city (balance), IN
- County
- Marion County · 998,460 people
- City population
- 881,119
- Metro
- Indianapolis-Carmel-Anderson, IN
- Population (ZIP)
- 47,099
- Household income
- $50,325
- Rent vs Own
- Severe rent burden
- 2742.0
Population outlook (Marion County) Hauer SSP2
- Today (2025)
- 1,025,572 people
- By 2030
- 1,065,727 · +3.9%
- By 2040
- 1,141,577 · +11.3%
- By 2050
- 1,208,920 · +17.9%
- By 2075
- 1,367,288 · +33.3%
- By 2100
- 1,438,201 · +40.2%
Race, ethnicity, and origin ACS 2023
- Neighborhood character
- Diverse neighborhood (Simpson 0.62)
- Race & ethnicity
- Black 53% White 25% Hispanic / Latino 17% Two or more races 9% Asian 2%
- Hispanic origin (detail)
- Mexican 11%
- Common ancestry
- Lithuanian 1% Italian 1% Romanian 1%
- Foreign-born
- 11% · Canada
- Languages at home
- 86% English-only · Spanish 10% French/Haitian/Cajun 1% Other Asian/Pacific 1%
Political lean MEDSL · Marion
- 2024 margin
- Strong D (+27.7) · D 63.0% · R 35.3% · Other 1.7%
- 2008→2024 swing
- -0.7pp no change · 2008: 28.4pp · 2024: 27.7pp
- All cycles
- 2024: D+27.7 2020: D+29.1 2016: D+22.8 2012: D+22.2 2008: D+28.4
Not yet ingested
- Civics
- —
Market trends
- HPI YoY
- ▼ -218.85%
- Current HPI
- 239.43
- Rent YoY
- ▲ 6.76%
- Metro
- Indianapolis-Carmel-Anderson, IN
- State GDP YoY
- ▲ 2.90%
- F500 in state
- 18
Industry mix (Fortune 500 HQ in IN)
| Industry | F500 HQs | Revenue |
|---|---|---|
| Industrial Machinery | 2 | $37B |
|
||
| Healthcare | 1 | $177B |
|
||
| Pharmaceuticals | 1 | $45B |
|
||
| Metals / Steel | 1 | $18B |
|
||
| Agriculture | 1 | $17B |
|
||
| Packaging | 1 | $12B |
|
||
Price history
+125.2% since first listed11 events — show timeline
- 2026-06-05 Listed $134,900 MIBOR as Distributed by MLS Grid
- 2019-03-01 Sold (MLS) $47,000 MIBOR as Distributed by MLS Grid
- 2019-02-22 Pending — MIBOR as Distributed by MLS Grid
- 2019-01-17 Listed $59,900 MIBOR as Distributed by MLS Grid
- 2012-10-10 Listing Removed — MIBOR as Distributed by MLS Grid
- 2012-10-09 Sold (MLS) $19,750 MIBOR as Distributed by MLS Grid
- 2012-07-26 Listed $24,900 MIBOR as Distributed by MLS Grid
- 2007-05-16 Sold (MLS) $72,300 MIBOR as Distributed by MLS Grid
- 2007-01-11 Listed $72,300 MIBOR as Distributed by MLS Grid
- 2005-12-31 Listing Removed — MIBOR as Distributed by MLS Grid
- 2004-04-14 Listed $59,900 MIBOR as Distributed by MLS Grid
Property tax history
+8.6%/yrLatest (2025): $2,459 · -10.9% YoY. Source: county tax records.
Cash-flow waterfall
monthlySold comps — $/sqft
last 12 mo · ≤1 miLoading sold comps…