106 Oak Park · Fairfield Bay, AR
Flood risk 1/10 · Minimal
- FEMA flood zone
- X
- Chance of flooding over 30 yrs
- 0.0%
- Est. flood insurance / yr
- $507 – $1,088
Fire risk 3/10 · Minor
- Est. fire insurance / yr
- $1,499 – $2,785
Heat risk 4/10 · Minor
- Hot days now (above 107°F)
- 5 days/yr
- Hot days in 30 yrs
- 13 days/yr
Wind risk 3/10 · Minor
- Chance of severe wind over 30 yrs
- 5.0%
Air-quality risk 2/10 · Minimal
- Unhealthy air days now
- 0 days/yr
- Unhealthy air days in 30 yrs
- 1 days/yr
Risk factors via First Street. Map © Google.
Why this score? — see what drove the C- grade
The composite is a weighted blend of 9 inputs, each scored 0–100. Each bar is that input's sub-score; the figure is the points it added to the 100-point composite (weight × sub-score).
- Cash flow +21.6/30.0
- DSCR +6.9/10.0
- 1% rule +6.5/10.0
- Appreciation +4.8/10.0
- Schools +3.8/10.0
- Livability +3.1/5.0
- Rent growth +2.5/5.0
- Condition / age +2.5/5.0
- ARV discount +0.9/15.0
$173,900
🖨 Deal sheet (PDF) 📄 Offer letter ✓ Due diligence
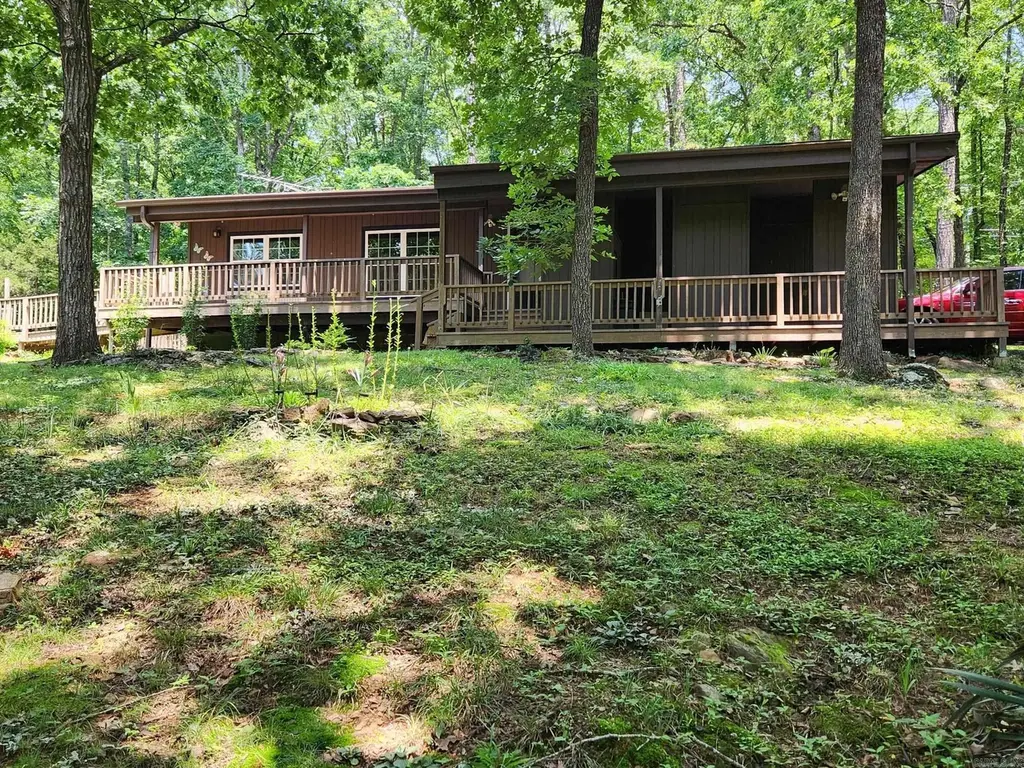
Listing remarks
In the heart of Fairfield Bay nestled among the trees for complete privacy & at a dead end street that also adds to the secluded feel, lays this great home where you will enjoy the sights and sounds of wildlife but also realizing the safety of having neighbors you can't see. Lounging on the covered front porch will be your new hobby & a enjoyable one at that. Nearly new appliances remain which includes washer/dryer/refrigerator along with the range, microwave & dishwasher, new cabinets with pull-outs, composite countertops & tile black-splash, newly remodeled bath that will delight you, WB fireplace with circulating vents, generator wired, 14x24 heated/cooled worksho
Key facts
- Covered front porch
- New cabinets
- New appliances
Tags
Property features AI
Finance
- Other: Approximate lot size: 0.87 acre; Approximate living area recorded as 1,255; Located in Chelsea Glade subdivision, Fairfield Bay, Van Buren County
- Financial info: Financing options include VA loan, FHA loan, or cash
- HOA & community: Monthly association fee of $113; Mandatory community fee applies
Exterior
- Parking: Carport; Parking pads; Space for 1 car
- Utilities: Septic system; Public water; Electric service from co-op; Satellite TV available
- Home design: Frame exterior; Single-story (entry level not specified); Architectural shingle roof
- Construction: Frame construction; Crawl space foundation; Architectural shingle roof
- Exterior features: Deck; Outside storage area; Shop; Gazebo; Greenhouse; Paved road access; Level, corner, wooded lot in a subdivision; Near river/lake area and common to golf course; Access to community amenities including swimming pools, tennis courts, playground, picnic area, marina, and fitness/bike trail; Has lake frontage/access (Greers Ferry)
Interior
- Kitchen: Electric range; Dishwasher; Refrigerator stays; Ice maker connection
- Flooring: Tile flooring; Laminate flooring
- Bathrooms: 1 full bathroom
- Heating & cooling: Central electric heating; Central electric cooling
- Interior features: Washer connection and washer stays; Dryer connection (electric) and dryer stays; Electric water heater; Built-in shelving/cabinets; Walk-in shower; Sheetrock walls and ceilings with vaulted ceiling; Wood-burning fireplace with glass doors
- Laundry & utility: Laundry room; Washer and dryer provided (connections electric)
Neighborhood map
What this means for you Summary
Snapshot
- This is a 2-bed/1.0-bath single-family listed at $174k.
Deal economics
- At list price, monthly cash flow is $265 ($3k/yr) — positive.
- The deal already cash-flows at list — no discount required.
- Meets the 1% rule at list price ($2k rent vs $174k).
- Recommended offer: $169k (3.0% below list) — sets the bar for market timing.
- Cap rate 8.1% vs local median 5.3% in Fairfield Bay — top-decile yield for the area; either an underpriced asset or a hidden risk that comps aren't pricing in. Stress-test before assuming the spread holds.
Location & tenants
- Location reads 62/100 on livability (#220 in AR) — a middle-class / working-renter tenant base. Strengths: cost of living A+, housing A+, crime B; Watch: employment D+, schools F, amenities F.
- Shirley School District (rural): math 44% / reading 42% proficiency, ranked #132 of 245 in AR (top 54%) — families likely to look elsewhere, expect single-tenant / working-renter base with shorter leases; 73% free/reduced lunch — lower-income household profile, screen leases tightly.
- Market conditions: 259 active listings in the ZIP; 1 comparable units currently listed for rent nearby; 16 units permitted in Van Buren County in 2024 (0 in 5+ unit buildings).
Forward outlook
- In year one you build about $374 of equity ($1k loan paydown + $-828 appreciation (-0.5% local appreciation)).
- Van Buren County population projected at -27% by 2050 — secular population decline; favor cash flow + early exit over multi-decade hold.
- At projected returns (-0.5% appreciation + 3.0% rent growth), your $49k cash investment doubles in ~9 years — after that, you're playing with house money.
Negotiation context
- It's been on market 35 days — a 3% lower offer ($169k) is reasonable based on typical stale-listing flexibility.
- 6 sale attempts since 12y ago with the ask held roughly flat each time — persistent listings suggest the price (not the market) is what's stuck; bring a comps-based counter.
- Current owner paid $150k; 16% above their basis — modest negotiation headroom, anchor on the comps not their cost.
Questions for the listing agent
- It's been on market 35 days. Have you received any prior offers? Is the seller open to a 3% concession, seller financing, or rate buy-down credit?
- Built in 1978 — when were the roof, HVAC, electrical panel, plumbing, and water heater last replaced?
- What does the HOA fee cover, when was the last increase, and are there any pending special assessments or reserve-fund shortfalls?
- Is there a deadline driving the sale (1031 exchange, divorce, estate, relocation)? That informs how much negotiation room exists.
- Schools are F-rated, which usually means shorter tenancies and higher turnover. Who's the typical renter profile here, and what's been the actual vacancy rate?
- What's the average days-on-market for RENTAL listings here right now (not sales)? A rising rental-DOM trend means longer vacancies and softer asking-rent achievability than the comps imply.
- What's the recent tenant-quality profile in this submarket — average credit score on applications, eviction rate, late-payment / NSF rate, and stable-employment percentage? A property-management company in the area should have these aggregated.
- How much new for-sale + rental construction is in the pipeline within 1–3 miles? Heavy new supply typically softens prices + rents 12–24 months out; constrained supply supports both.
Investment metrics
- 1% rule
- 1.15% ✓
- Cap rate
- 8.12%
- Cash-on-cash
- 6.54%
- DSCR
- 1.29
- GRM
- 7.2
CMA / ARV
- ARV (median comp)
- $151,615
- List price
- $173,900
- Delta
- 14.70%
- Verdict
- OVERPRICED
- Comps
- 20 within 1.0 mi
Show comp detail 12 sales within ~0.75 mi
| Address | Dist | Beds/Ba | Sqft | Sold | Price | $/sf | Match |
|---|---|---|---|---|---|---|---|
| 332 Snead | 0.29mi | 2/2.0 | 1,286 (+2%) | 11mo | $139,500 | $108 | 69 |
| 426 Woodlawn Dr | 0.13mi | 2/2.0 | 1,101 (-12%) | 9mo | $135,000 | $123 | 62 |
| 104 Shadow Ridge Ct | 0.64mi | 2/2.5 | 1,248 (-1%) | 5mo | $119,025 | $95 | 59 |
| 106 Whistling Pnes | 0.62mi | 2/2.0 | 1,206 (-4%) | 7mo | $179,000 | $148 | 55 |
| 123 Shadow Ridge Ln | 0.66mi | 2/2.5 | 1,300 (+4%) | 7mo | $93,000 | $72 | 51 |
| 109 Shadow Ridge Loop #26 | 0.62mi | 2/3.0 | 1,248 (-1%) | 14mo | $44,500 | $36 | 50 |
| 105 Shadow Ridge Dr | 0.63mi | 2/3.0 | 1,248 (-1%) | 16mo | $109,000 | $87 | 48 |
| 212 Snead Dr | 0.68mi | 3/2.0 (+1) | 1,272 (+1%) | 13mo | $183,900 | $145 | 46 |
| 106 Shadow Ridge Ln | 0.67mi | 2/3.0 | 1,300 (+4%) | 11mo | $135,000 | $104 | 46 |
| 160 Dave Creek Pkwy | 0.75mi | 3/2.0 (+1) | 1,300 (+4%) | 21mo | $125,000 | $96 | 33 |
| 111 Whistling Pines Ln | 0.67mi | 2/2.0 | 1,088 (-13%) | 13mo | $147,500 | $136 | 31 |
| 217 Snead Dr | 0.70mi | 3/2.0 (+1) | 1,380 (+10%) | 20mo | $155,000 | $112 | 25 |
Match score weights: distance 35% · size 25% · config 20% · recency 20%. Top-matched comps best support the ARV.
Projected returns pro-forma
-0.48% appreciation · 3.0% rent growth · sell at horizon
- IRR
- 3.6%
- Equity multiple
- 1.17×
- Total profit
- $8,047
- Equity at exit
- $46,392
- IRR
- 9.5%
- Equity multiple
- 1.98×
- Total profit
- $47,713
- Equity at exit
- $52,588
Cash invested: $48,692 (down + closing). Projections, not guarantees.
Landlord ↔ Tenant lean methodology
- Overall (STATE)
- 92 Strongly Landlord-Friendly
- State Arkansas
- 92 Strongly Landlord-Friendly · R+14
- County
- — inherits STATE
- City
- — inherits STATE
ZIP-level market 72088
- Home prices YoY
- -0.2%
- Active inventory
- 259
- Price-to-rent
- 7.2×
Monthly cashflow live
- Estimated rent
- $2,000 medium interval (Pro) →
- Mortgage (P&I)
- −$912
- Tax est. 1.5%
- −$217 /mo · $2,608/yr
- Insurance
- −$72
- HOA
- −$113
- Vacancy / Maint / Mgmt
- −$420
- Net cashflow
- $265
Break-even live
Sensitivity live
| Price | -10% $385 | -5% $325 | +0% $265 | +5% $205 | +10% $145 |
|---|---|---|---|---|---|
| Rent | -10% $107 | -5% $186 | +0% $265 | +5% $344 | +10% $423 |
| Rate | -1.0pp $353 | -0.5pp $309 | base $265 | +0.5pp $220 | +1.0pp $174 |
UW: 25.0% down · 7.5% · 30yr · 1.5% tax · 5.0% vac · 8.0% maint · 8.0% mgmt
Financing live
Cash to close
- Down payment
- $43,475
- Closing costs
- $5,217
- Reserves months
- —
- Total cash needed
- —
Loan-product check · same deal, 3 products live
Conventional
25% down · 7.5% · 30yr
- Down + closing
- —
- Monthly P&I
- —
- Monthly cashflow
- —
- DSCR
- —
- Eligible?
- —
Personal DTI + credit; lowest rate.
DSCR
20% down · 8.5% · 30yr
- Down + closing
- —
- Monthly P&I
- —
- Monthly cashflow
- —
- DSCR
- —
- Eligible?
- —
No personal income docs; deal must DSCR.
Hard money
10% down · 12.0% · 12mo
- Down + closing
- —
- Monthly P&I
- —
- Monthly cashflow
- —
- DSCR
- —
- Eligible?
- —
Short-term bridge; refi at stabilization.
Rent comps 1 comps
| Address | Beds | Baths | Sqft | Rent | $/sqft | DOM | Units | Dist |
|---|---|---|---|---|---|---|---|---|
| 106 Set Ct Fairfield Bay, AR | 3.0 | 2.0 | 1300 | $2,000 | $1.54 | 45d | 1 | 1.50mi |
HOA detail
- Monthly dues
- $113 · $1,356/yr
Listing history 33 events
-
2026-06-19days on market $173,900 Active 35 DOM
-
2026-06-18days on market $173,900 Active 34 DOM
-
2026-06-17days on market $173,900 Active 33 DOM
-
2026-06-16days on market $173,900 Active 32 DOM
-
2026-06-15days on market $173,900 Active 31 DOM
-
2026-06-14days on market $173,900 Active 29 DOM
-
2026-06-12days on market $173,900 Active 28 DOM
-
2026-06-09days on market $173,900 Active 25 DOM
-
2026-06-08days on market $173,900 Active 24 DOM
-
2026-06-07days on market $173,900 Active 23 DOM
-
2026-06-07days on market $173,900 Active 22 DOM
-
2026-06-04days on market $173,900 Active 19 DOM
-
2026-06-02days on market $173,900 Active 18 DOM
-
2026-06-01days on market $173,900 Active 17 DOM
-
2026-05-31days on market $173,900 Active 16 DOM
-
2026-05-31days on market $173,900 Active 15 DOM
-
2026-05-15$173,900 New Listing 1117-char remark
-
2025-12-14historical
-
2025-10-16historical $950
-
2025-10-07$950
-
2025-09-19price $179,000
-
2025-08-12price $189,000
-
2025-06-26$199,000 New Listing
-
2025-04-16historical
-
2024-11-22$199,000 New Listing
-
2022-09-08soldstatus $149,500
-
2021-07-09soldstatus $127,000
-
2015-05-13soldstatus $43,500
-
2015-05-07soldstatus $43,500
-
2015-03-15historical
-
2014-09-08historical
-
2014-09-01$45,000
-
2014-06-17$60,000
ⓘ Source: listings_history table (triggers on properties + properties_extension) + one-shot
backfill from property_details.listing_events for pre-trigger history.
Climate risk First Street
- Flood 1/10 Low FEMA zone X · 0% chance over 30 yrs
- Wildfire 3/10 Moderate
- Heat 4/10 Moderate 5 d/yr ≥107°F today · 13 d/yr by 30 yrs out
- Wind 3/10 Moderate 5% chance of damaging wind over 30 yrs
- Air quality 2/10 Low 0 unhealthy d/yr today · 1 by 30 yrs out
Nearby sold comps map
Loading sold comps map…
Walkable amenities ~0.75 mi
Loading nearby amenities…
Taxation est. · year 1
- Rental income
- $24,000
- − Mortgage interest
- −$9,741
- − Property taxes
- −$2,608
- − Insurance
- −$870
- − Repairs & maintenance
- −$1,920
- − Management
- −$1,920
- − HOA
- −$1,356
- − Depreciation
- −$5,059
- Taxable income
- $526
- Est. tax owed @ 24.0%
- −$126
- After-tax cash flow
- $3,056/yr
For passive investors: Depreciation is non-cash, so a rental often shows a tax loss while cash-flowing — sheltering income. Rental losses are passive: they offset passive income freely, and up to $25,000/yr can offset ordinary (W-2) income if you actively participate and your MAGI is under $100k (phasing out to $0 by $150k); unused losses carry forward. On sale, claimed depreciation is recaptured at up to 25%, and gains may owe capital-gains tax (a 1031 exchange can defer both). Figures are a year-1 estimate at your 24.0% rate — not tax advice; consult a CPA.
Schools (NCES district)
- District
- Shirley School District
- NCES district ID
- 0512420
- Math proficiency
- 44% ▲ 4.00%
- Reading proficiency
- 42% ▲ 1.00%
- Median HH income
- $36,296
- Composite
- 37.98/100
- National rank
- #8669
- State rank
- #132 of 245 in AR
Livability — Fairfield Bay
- Score
- 62/100
- State rank
- #220
- US rank
- #16778
Category grades
Schools grade is shown separately in the Schools card above.
Census & demographics
- Census place
- Fairfield Bay, AR
- City population
- 2,264
- Population (ZIP)
- 2,264
Population outlook (Van Buren County) Hauer SSP2
- Today (2025)
- 15,459 people
- By 2030
- 14,645 · -5.3%
- By 2040
- 12,918 · -16.4%
- By 2050
- 11,263 · -27.1%
- By 2075
- 7,870 · -49.1%
- By 2100
- 4,918 · -68.2%
Race, ethnicity, and origin ACS 2023
- Neighborhood character
- Predominantly White (88%)
- Race & ethnicity
- White 88% Hispanic / Latino 6% Two or more races 3% Asian 2%
- Hispanic origin (detail)
- Mexican 6%
- Common ancestry
- Lithuanian 9% Iranian 2% Romanian 2%
- Foreign-born
- 3% · Canada, Dominican Republic
- Languages at home
- 94% English-only · Other Asian/Pacific 4% Tagalog/Filipino 1% Spanish 1%
Political lean MEDSL · Van Buren
- 2024 margin
- Solid R (+60.2) · D 18.9% · R 79.0% · Other 2.1%
- 2008→2024 swing
- -28.5pp toward R · 2008: -31.7pp · 2024: -60.2pp
- All cycles
- 2024: R+60.2 2020: R+56.9 2016: R+53.9 2012: R+39.5 2008: R+31.7
Not yet ingested
- Civics
- —
Market trends
- HPI YoY
- ▼ -0.48%
- Current HPI
- 238.2694
- Rent YoY
- —
- Metro
- —
- State GDP YoY
- ▲ 3.80%
- F500 in state
- 10
Industry mix (Fortune 500 HQ in AR)
| Industry | F500 HQs | Revenue |
|---|---|---|
| Retail | 1 | $681B |
|
||
| Food / Agriculture | 1 | $53B |
|
||
| Retail / Energy | 1 | $22B |
|
||
| Transportation / Logistics | 1 | $12B |
|
||
| Energy | 1 | $4B |
|
||
Price history
+189.8% since first listed17 events — show timeline
- 2026-05-15 Listed $173,900 CARMLS
- 2025-12-14 Listing Removed — CARMLS
- 2025-10-16 Rental Removed $950 REDFIN
- 2025-10-07 Listed for Rent $950 REDFIN
- 2025-09-19 Price Changed $179,000 CARMLS
- 2025-08-12 Price Changed $189,000 CARMLS
- 2025-06-26 Listed $199,000 CARMLS
- 2025-04-16 Listing Removed — CARMLS
- 2024-11-22 Listed $199,000 CARMLS
- 2022-09-08 Sold (Public Records) $149,500 Public Records
- 2021-07-09 Sold (Public Records) $127,000 Public Records
- 2015-05-13 Sold (Public Records) $43,500 Public Records
- 2015-05-07 Sold (MLS) $43,500 CARMLS
- 2015-03-15 Listing Removed — CARMLS
- 2014-09-08 Listing Removed — CARMLS
- 2014-09-01 Listed $45,000 CARMLS
- 2014-06-17 Listed $60,000 CARMLS
Property tax history
-17.8%/yrLatest (2025): $54 · -64.7% YoY. Source: county tax records.
Cash-flow waterfall
monthlySold comps — $/sqft
last 12 mo · ≤1 miLoading sold comps…