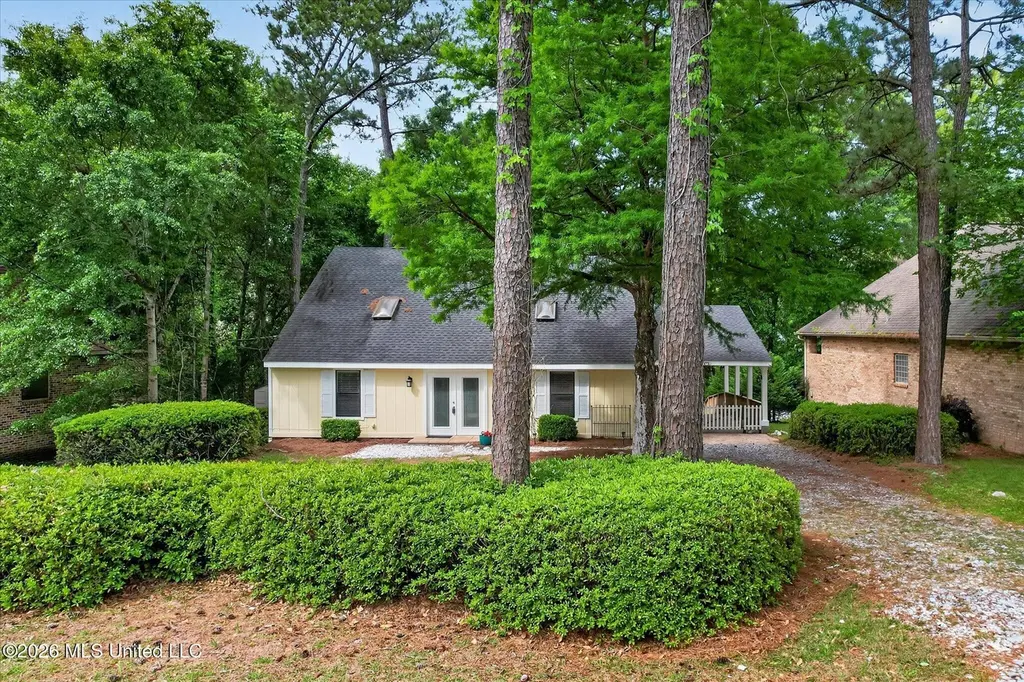
6531 Alakoko Dr · Diamondhead, MS
Flood risk 1/10 · Minimal
- FEMA flood zone
- X (unshaded)
- Chance of flooding over 30 yrs
- 0.0%
- Est. flood insurance / yr
- $507 – $1,088
Fire risk 2/10 · Minimal
- Est. fire insurance / yr
- $1,241 – $2,305
Heat risk 10/10 · Severe
- Hot days now (above 107°F)
- 7 days/yr
- Hot days in 30 yrs
- 21 days/yr
Wind risk 9/10 · Severe
- Chance of severe wind over 30 yrs
- 99.0%
Air-quality risk 1/10 · Minimal
- Unhealthy air days now
- 0 days/yr
- Unhealthy air days in 30 yrs
- 0 days/yr
Risk factors via First Street. Map © Google.
Why this score? — see what drove the D+ grade
The composite is a weighted blend of 9 inputs, each scored 0–100. Each bar is that input's sub-score; the figure is the points it added to the 100-point composite (weight × sub-score).
- ARV discount +15.0/15.0
- Cash flow +11.7/30.0
- Schools +3.9/10.0
- DSCR +3.4/10.0
- Livability +3.4/5.0
- 1% rule +2.7/10.0
- Rent growth +2.5/5.0
- Condition / age +2.5/5.0
- Appreciation +0.0/10.0
$239,900
🖨 Deal sheet 📄 Offer letter ✓ Due diligence
Listing remarks MLS
Adorable 3 bedroom 2 bath home in a lovely neighborhood in Diamondhead. Updated kitchen with stainless appliances, easy close drawers, large laundry room, spacious master suite downstairs, with 2 nice sized bedrooms upstairs featuring a shared bath. This week any fogged windows have been replaced. Beautiful lot with a rear deck overlooking the trees and abundant with wild life. Close to the Diamondhead Country Club and Pro Shop ...
Key facts
- Stainless appliances
- Large laundry room
- Updated kitchen
Tags
Neighborhood map
What this means for you Summary
Snapshot
- This is a 3-bed/2.0-bath single-family listed at $240k.
Deal economics
- At list price, monthly cash flow is $-71 ($-853/yr) — negative.
- To cash-flow at today's rent, offer at most $227k (5.2% below list).
- To meet the 1% rule (rent ≥ 1% of price), the offer needs to be $184k (23.1% below list).
- Recommended offer: $184k (23.1% below list) — sets the bar for 1% rule.
- Cap rate 5.9% vs local median 4.8% in Diamondhead — meaningfully above typical; check what's discounted (condition, days-on-market, listing class) to confirm the premium yield is real.
Location & tenants
- Location reads 68/100 on livability (#59 in MS) — a middle-class / working-renter tenant base. Strengths: crime A+, cost of living A+, housing A+; Watch: schools C-, amenities F, commute F.
- Hancock County School District (rural): math 47% / reading 44% proficiency, ranked #23 of 130 in MS (top 18%) — families likely to look elsewhere, expect single-tenant / working-renter base with shorter leases.
- Market conditions: 246 active listings in the ZIP; 5 comparable units currently listed for rent nearby; rentals at typical pace (median 21d on market — plan ~3-4 weeks tenant-placement turnaround); solid renter incomes; 248 units permitted in Hancock County in 2024 (0 in 5+ unit buildings).
Forward outlook
- Local home prices are declining (-3.0%/yr); year-one equity from $2k of loan paydown is wiped out by about $7k of value loss. Plan a longer hold.
- Hancock County population projected at +20% by 2050 — long-run rental-demand tailwind backs the buy-and-hold thesis.
Negotiation context
- It's been on market 50 days — a 3% lower offer ($233k) is reasonable based on typical stale-listing flexibility.
- 6 sale attempts since 19y ago with the ask held roughly flat each time — persistent listings suggest the price (not the market) is what's stuck; bring a comps-based counter.
Risks & watch-outs
- Climate carrying-cost: severe wind risk, 99% chance of damaging wind over 30y; extreme-heat days projected 7→21/yr by 2055 (HVAC capex compounding) — expect insurance premiums to compound above CPI over the hold.
Questions for the listing agent
- What do current leases actually rent for vs. the listed asking? Can we see a recent rent roll and the last 12 months of T-12 income?
- It's been on market 50 days. Have you received any prior offers? Is the seller open to a 23% concession, seller financing, or rate buy-down credit?
- Is there a deadline driving the sale (1031 exchange, divorce, estate, relocation)? That informs how much negotiation room exists.
- The area grade is low — what's the realistic commute time and amenity access for the typical tenant pool here? Any planned neighborhood developments (good or bad) we should know about?
- What's the average days-on-market for RENTAL listings here right now (not sales)? A rising rental-DOM trend means longer vacancies and softer asking-rent achievability than the comps imply.
- What's the recent tenant-quality profile in this submarket — average credit score on applications, eviction rate, late-payment / NSF rate, and stable-employment percentage? A property-management company in the area should have these aggregated.
- How much new for-sale + rental construction is in the pipeline within 1–3 miles? Heavy new supply typically softens prices + rents 12–24 months out; constrained supply supports both.
Investment metrics
- 1% rule
- 0.77% ✗
- Cap rate
- 5.94%
- Cash-on-cash
- -1.27%
- DSCR
- 0.94
- GRM
- 10.8
CMA / ARV
- ARV (median comp)
- $310,486
- List price
- $239,900
- Delta
- -22.73%
- Verdict
- UNDERPRICED
- Comps
- 20 within 1.0 mi
Projected returns pro-forma
-3.0% appreciation · 3.0% rent growth · sell at horizon
- IRR
- -18.4%
- Equity multiple
- 0.35×
- Total profit
- $-43,452
- Equity at exit
- $35,770
- IRR
- -10.8%
- Equity multiple
- 0.35×
- Total profit
- $-43,875
- Equity at exit
- $20,742
Cash invested: $67,172 (down + closing). Projections, not guarantees.
Landlord ↔ Tenant lean methodology
- Overall (STATE)
- 90 Strongly Landlord-Friendly
- State Mississippi
- 90 Strongly Landlord-Friendly · R+11
- County
- — inherits STATE
- City
- — inherits STATE
ZIP-level market 39525
- Home prices YoY
- -19.1%
- Active inventory
- 246
- Price-to-rent
- 10.8×
Monthly cashflow live
- Estimated rent
- $1,845 high interval (Pro) →
- Mortgage (P&I)
- −$1,258
- Tax from tax record
- −$171 /mo · $2,046/yr
- Insurance
- −$100
- HOA
- −$0
- Vacancy / Maint / Mgmt
- −$387
- Net cashflow
- $-71
Break-even live
UW: 25.0% down · 7.5% · 30yr · 1.5% tax · 5.0% vac · 8.0% maint · 8.0% mgmt
Financing live
Cash to close
- Down payment
- $59,975
- Closing costs
- $7,197
- Reserves months
- —
- Total cash needed
- —
Loan-product check · same deal, 3 products live
Conventional
25% down · 7.5% · 30yr
- Down + closing
- —
- Monthly P&I
- —
- Monthly cashflow
- —
- DSCR
- —
- Eligible?
- —
Personal DTI + credit; lowest rate.
DSCR
20% down · 8.5% · 30yr
- Down + closing
- —
- Monthly P&I
- —
- Monthly cashflow
- —
- DSCR
- —
- Eligible?
- —
No personal income docs; deal must DSCR.
Hard money
10% down · 12.0% · 12mo
- Down + closing
- —
- Monthly P&I
- —
- Monthly cashflow
- —
- DSCR
- —
- Eligible?
- —
Short-term bridge; refi at stabilization.
Rent comps 5 comps
| Address | Beds | Baths | Sqft | Rent | $/sqft | DOM | Units | Dist |
|---|---|---|---|---|---|---|---|---|
| 208 Molokai Vlg Diamondhead, MS | 2.0 | 2.0 | 951 | $1,250 | $1.31 | 21d | 1 | 0.22mi |
| 5402 Gex Dr Diamondhead, MS | 2.0 | 1.0 | 1240 | $1,500 | $1.21 | 13d | 1 | 0.75mi |
| 250 Highpoint Dr Diamondhead, MS | 2.0 | 2.5 | 1367 | $2,500 | $1.83 | 43d | 1 | 0.88mi |
| 250 Highpoint Dr Unit 250 Diamondhead, MS | 2.0 | 2.5 | 1367 | $2,500 | $1.83 | 21d | 1 | 0.88mi |
| 289 Highpoint Dr Diamondhead, MS | 2.0 | 2.5 | 1340 | $1,700 | $1.27 | 13d | 1 | 0.93mi |
Listing history 24 events
-
2026-06-13statusdays on market $239,900 Pending 50 DOM
-
2026-06-10days on market $239,900 Active 49 DOM
-
2026-06-09days on market $239,900 Active 48 DOM
-
2026-06-08days on market $239,900 Active 47 DOM
-
2026-06-07days on market $239,900 Active 46 DOM
-
2026-06-05days on market $239,900 Active 43 DOM
-
2026-06-03days on market $239,900 Active 42 DOM
-
2026-06-02days on market $239,900 Active 41 DOM
-
2026-06-01days on market $239,900 Active 40 DOM
-
2026-05-31days on market $239,900 Active 39 DOM
-
2026-05-30days on market $239,900 Active 38 DOM
-
2026-04-21$243,750 Active 439-char remark
Show marketing remark (439 chars)
Adorable 3 bedroom 2 bath home in a lovely neighborhood in Diamondhead. Updated kitchen with stainless appliances, easy close drawers, large laundry room, spacious master suite downstairs, with 2 nice sized bedrooms upstairs featuring a shared bath. This week any fogged windows have been replaced. Beautiful lot with a rear deck overlooking the trees and abundant with wild life. Close to the Diamondhead Country Club and Pro Shop ...
-
2021-10-01historical
-
2021-10-01historical
-
2020-11-20soldstatus
-
2020-10-03$159,900
-
2017-07-25historical
-
2017-01-06$134,900
-
2015-12-21$135,000
-
2014-09-07$125,500
-
2008-10-15soldstatus
-
2008-10-10soldstatus
-
2007-05-02$110,000
-
1998-03-27soldstatus
ⓘ Source: listings_history table (triggers on properties + properties_extension) + one-shot
backfill from property_details.listing_events for pre-trigger history.
Tax reassessment forecast MS · Resets to sale price
- Current annual tax
- $2,046 · $171/mo
- Projected year-2 tax
- $2,046 · $171/mo
- Expected delta
- $0/yr ($0/mo · -0.0%)
ⓘ Screening estimate from a state-policy table — verify with the county assessor before closing.
Climate risk First Street
- Flood 1/10 Low FEMA zone X (unshaded) · 0% chance over 30 yrs
- Wildfire 2/10 Low
- Heat 10/10 Extreme 7 d/yr ≥107°F today · 21 d/yr by 30 yrs out
- Wind 9/10 Extreme 99% chance of damaging wind over 30 yrs
- Air quality 1/10 Low 0 unhealthy d/yr today · 0 by 30 yrs out
Nearby sold comps map
Loading sold comps map…
Walkable amenities ~0.75 mi
Loading nearby amenities…
Taxation est. · year 1
- Rental income
- $22,139
- − Mortgage interest
- −$13,438
- − Property taxes
- −$2,046
- − Insurance
- −$1,200
- − Repairs & maintenance
- −$1,771
- − Management
- −$1,771
- − Depreciation
- −$6,979
- Taxable loss
- −$5,066
- Est. tax savings @ 24.0%
- +$1,216
- After-tax cash flow
- $363/yr
For passive investors: Depreciation is non-cash, so a rental often shows a tax loss while cash-flowing — sheltering income. Rental losses are passive: they offset passive income freely, and up to $25,000/yr can offset ordinary (W-2) income if you actively participate and your MAGI is under $100k (phasing out to $0 by $150k); unused losses carry forward. On sale, claimed depreciation is recaptured at up to 25%, and gains may owe capital-gains tax (a 1031 exchange can defer both). Figures are a year-1 estimate at your 24.0% rate — not tax advice; consult a CPA.
Schools (NCES district)
- District
- Hancock County School District
- NCES district ID
- 2801740
- Math proficiency
- 47% ▼ -11.00%
- Reading proficiency
- 44% ▼ -9.00%
- Median HH income
- $47,971
- Composite
- 38.88/100
- National rank
- #4099
- State rank
- #23 of 130 in MS
Livability — Diamondhead
- Score
- 68/100
- State rank
- #59
- US rank
- #9320
Category grades
Schools grade is shown separately in the Schools card above.
Census & demographics
- Census place
- Diamondhead, MS
- County
- Hancock County · 9,338 people
- City population
- 9,338
- Metro
- Gulfport-Biloxi, MS
- Population (ZIP)
- 9,338
- Household income
- $87,407
- Rent vs Own
Population outlook (Hancock County) Hauer SSP2
- Today (2025)
- 52,161 people
- By 2030
- 54,753 · +5.0%
- By 2040
- 59,242 · +13.6%
- By 2050
- 62,417 · +19.7%
- By 2075
- 68,168 · +30.7%
- By 2100
- 69,212 · +32.7%
Race, ethnicity, and origin ACS 2023
- Neighborhood character
- Predominantly White (85%)
- Race & ethnicity
- White 85% Two or more races 9% Hispanic / Latino 8% Black 2%
- Hispanic origin (detail)
- Mexican 5%
- Common ancestry
- Lithuanian 10% Slovak 3% Romanian 2%
- Foreign-born
- 3% · Canada
- Languages at home
- 94% English-only · Spanish 4% French/Haitian/Cajun 1% Other Indo-European 1%
Political lean MEDSL · Hancock
- 2024 margin
- Solid R (+58.7) · D 20.1% · R 78.8% · Other 1.1%
- 2008→2024 swing
- -4.4pp toward R · 2008: -54.2pp · 2024: -58.7pp
- All cycles
- 2024: R+58.7 2020: R+55.5 2016: R+59.4 2012: R+52.8 2008: R+54.2
Not yet ingested
- Civics
- —
Market trends
- HPI YoY
- ▼ -45.77%
- Current HPI
- 193.4883
- Rent YoY
- —
- Metro
- Gulfport-Biloxi, MS
- State GDP YoY
- —
- F500 in state
- 0
Price history
+121.6% since first listed13 events — show timeline
- 2026-04-21 Listed $243,750 MLSU
- 2021-10-01 Listing Removed — MLSU
- 2021-10-01 Listing Removed — MLSU
- 2020-11-20 Sold (MLS) — MLSU
- 2020-10-03 Listed $159,900 MLSU
- 2017-07-25 Listing Removed — MLSU
- 2017-01-06 Listed $134,900 MLSU
- 2015-12-21 Listed $135,000 MLSU
- 2014-09-07 Listed $125,500 MLSU
- 2008-10-15 Sold (Public Records) — Public Records
- 2008-10-10 Sold (MLS) — MLSU
- 2007-05-02 Listed $110,000 MLSU
- 1998-03-27 Sold (Public Records) — Public Records
Property tax history
+7.5%/yrLatest (2025): $2,046 · +0.0% YoY. Source: county tax records.
Cash-flow waterfall
monthlySold comps — $/sqft
last 12 mo · ≤1 miLoading sold comps…