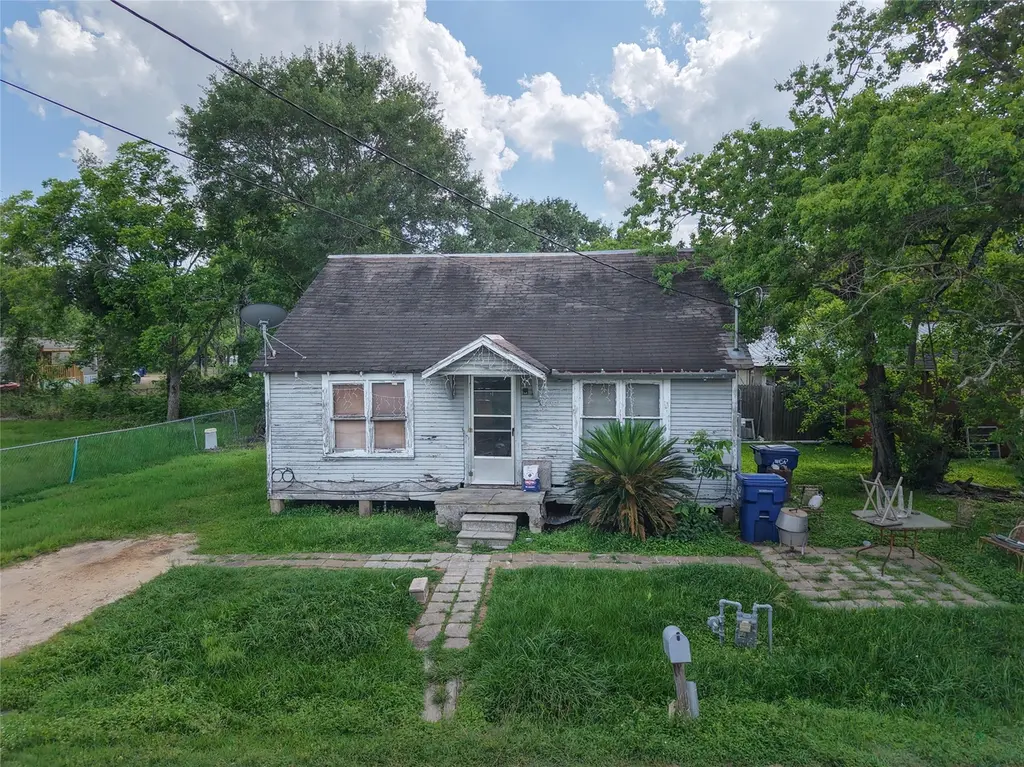
407 Clay St · Eagle Lake, TX
Flood risk 1/10 · Minimal
- FEMA flood zone
- X (unshaded)
- Chance of flooding over 30 yrs
- 0.0%
- Est. flood insurance / yr
- $507 – $1,088
Fire risk 3/10 · Minor
- Est. fire insurance / yr
- $1,222 – $2,270
Heat risk 8/10 · Major
- Hot days now (above 112°F)
- 7 days/yr
- Hot days in 30 yrs
- 22 days/yr
Wind risk 9/10 · Severe
- Chance of severe wind over 30 yrs
- 99.0%
Air-quality risk 1/10 · Minimal
- Unhealthy air days now
- 0 days/yr
- Unhealthy air days in 30 yrs
- 0 days/yr
Risk factors via First Street. Map © Google.
Why this score? — see what drove the D+ grade
The composite is a weighted blend of 9 inputs, each scored 0–100. Each bar is that input's sub-score; the figure is the points it added to the 100-point composite (weight × sub-score).
- Cash flow +15.0/30.0
- ARV discount +7.5/15.0
- Appreciation +5.7/10.0
- 1% rule +5.0/10.0
- DSCR +5.0/10.0
- Livability +3.1/5.0
- Schools +2.8/10.0
- Rent growth +2.5/5.0
- Condition / age +2.5/5.0
$19,000
🖨 Deal sheet 📄 Offer letter ✓ Due diligence
Listing remarks
Investor opportunity in the heart of Eagle Lake! Priced at lot value, this property is the perfect chance for savvy investors, rehabbers, or builders looking for their next project. Tear it down and start fresh, or bring your vision and turn this fixer-upper into something new. Motivated seller.
Key facts
- 3,920 sq ft lot
- Built 1940
- Listed 6 days
Property features AI
Exterior
- Utilities: Public water; Public sewer
- Home design: Residential property; 1-story (single level); Built in 1940
- Construction: Vinyl siding; Block foundation; Composition roof
- Exterior features: Cleared lot
Interior
- Bathrooms: 1 full bathroom
- Interior features: 5 total rooms; Seller disclosure available
Neighborhood map
What this means for you Summary
Snapshot
- This is a 2-bed/1.0-bath single-family listed at $19k.
Deal economics
- At list price, monthly cash flow is $585 ($7k/yr) — positive.
- The deal already cash-flows at list — no discount required.
- Meets the 1% rule at list price ($975 rent vs $19k).
- Cap rate 43.3% vs local median 3.7% in Eagle Lake — top-decile yield for the area; either an underpriced asset or a hidden risk that comps aren't pricing in. Stress-test before assuming the spread holds.
Location & tenants
- Location reads 62/100 on livability (#913 in TX) — a middle-class / working-renter tenant base. Strengths: cost of living A+, crime A-, housing B+; Watch: amenities F, commute F, employment D-.
- Rice CISD (rural): math 34% / reading 32% proficiency, ranked #574 of 826 in TX (top 70%) — families likely to look elsewhere, expect single-tenant / working-renter base with shorter leases; 68% free/reduced lunch — lower-income household profile, screen leases tightly.
- Zoned schools: Eagle Lake Int (math 37% / reading 27%, grade F, #2,268 of 4,322 statewide, top 55%, 180 students, 87% FRL) — zoned schools average 87% FRL vs 68% district-wide (19 pts higher); higher-poverty schools than district average — tighter screening recommended.
- Market conditions: 59 active listings in the ZIP; 1 comparable units currently listed for rent nearby; 29 units permitted in Colorado County in 2024 (0 in 5+ unit buildings).
Forward outlook
- In year one you build about $378 of equity ($131 loan paydown + $247 appreciation (1.3% local appreciation)).
- At projected returns (1.3% appreciation + 3.0% rent growth), your $5k cash investment doubles in ~1 year — after that, you're playing with house money.
Negotiation context
- Only 6 days on market — expect competitive offers; lowballing is unlikely to land.
Risks & watch-outs
- Watch-outs: property tax is 4.9% of price; built in 1940 — expect roof / HVAC / electrical / plumbing capex.
- Climate carrying-cost: severe wind risk, 99% chance of damaging wind over 30y; extreme-heat days projected 7→22/yr by 2055 (HVAC capex compounding) — expect insurance premiums to compound above CPI over the hold.
Questions for the listing agent
- Built in 1940 — when were the roof, HVAC, electrical panel, plumbing, and water heater last replaced?
- Property tax is high relative to price — has the assessment been appealed recently, and will the sale trigger a re-assessment?
- Is there a deadline driving the sale (1031 exchange, divorce, estate, relocation)? That informs how much negotiation room exists.
- Schools are F-rated, which usually means shorter tenancies and higher turnover. Who's the typical renter profile here, and what's been the actual vacancy rate?
- The area grade is low — what's the realistic commute time and amenity access for the typical tenant pool here? Any planned neighborhood developments (good or bad) we should know about?
- What's the average days-on-market for RENTAL listings here right now (not sales)? A rising rental-DOM trend means longer vacancies and softer asking-rent achievability than the comps imply.
- What's the recent tenant-quality profile in this submarket — average credit score on applications, eviction rate, late-payment / NSF rate, and stable-employment percentage? A property-management company in the area should have these aggregated.
- How much new for-sale + rental construction is in the pipeline within 1–3 miles? Heavy new supply typically softens prices + rents 12–24 months out; constrained supply supports both.
Investment metrics
- 1% rule
- 5.13% ✓
- Cap rate
- 43.27%
- Cash-on-cash
- 132.05%
- DSCR
- 6.88
- GRM
- 1.6
CMA / ARV
- ARV (on-the-fly)
- $137,256
- Comps found
- 5
Show comp detail 5 sales within ~0.75 mi
| Address | Dist | Beds/Ba | Sqft | Sold | Price | $/sf | Match |
|---|---|---|---|---|---|---|---|
| 407 Clay St | 0.00mi | 2/1.0 | 1,064 (0%) | 0mo | $19,000 | $18 | 100 |
| 504 N Lake Ave | 0.24mi | 3/2.0 (+1) | 1,160 (+9%) | 1mo | $190,000 | $164 | 64 |
| 615 Shirley St | 0.60mi | 3/2.0 (+1) | 1,050 (-1%) | 8mo | $65,000 | $62 | 54 |
| 901 E Prairie Ave | 0.39mi | 3/2.0 (+1) | 1,107 (+4%) | 19mo | $180,000 | $163 | 50 |
| 1106 E State St | 0.56mi | 3/2.0 (+1) | 1,075 (+1%) | 16mo | $139,000 | $129 | 50 |
Match score weights: distance 35% · size 25% · config 20% · recency 20%. Top-matched comps best support the ARV.
Projected returns pro-forma
1.3% appreciation · 3.0% rent growth · sell at horizon
- IRR
- —
- Equity multiple
- 8.14×
- Total profit
- $37,969
- Equity at exit
- $6,785
- IRR
- —
- Equity multiple
- 17.01×
- Total profit
- $85,185
- Equity at exit
- $9,253
Cash invested: $5,320 (down + closing). Projections, not guarantees.
Landlord ↔ Tenant lean methodology
- Overall (STATE)
- 87 Strongly Landlord-Friendly
- State Texas
- 87 Strongly Landlord-Friendly · R+5
- County
- — inherits STATE
- City
- — inherits STATE
ZIP-level market 77434
- Home prices YoY
- 0.7%
- Active inventory
- 59
- Price-to-rent
- 1.6×
Monthly cashflow live
- Estimated rent
- $975 medium interval (Pro) →
- Mortgage (P&I)
- −$100
- Tax from tax record
- −$77 /mo · $928/yr
- Insurance
- −$8
- HOA
- −$0
- Vacancy / Maint / Mgmt
- −$205
- Net cashflow
- $585
Break-even live
UW: 25.0% down · 7.5% · 30yr · 1.5% tax · 5.0% vac · 8.0% maint · 8.0% mgmt
Financing live
Cash to close
- Down payment
- $4,750
- Closing costs
- $570
- Reserves months
- —
- Total cash needed
- —
Loan-product check · same deal, 3 products live
Conventional
25% down · 7.5% · 30yr
- Down + closing
- —
- Monthly P&I
- —
- Monthly cashflow
- —
- DSCR
- —
- Eligible?
- —
Personal DTI + credit; lowest rate.
DSCR
20% down · 8.5% · 30yr
- Down + closing
- —
- Monthly P&I
- —
- Monthly cashflow
- —
- DSCR
- —
- Eligible?
- —
No personal income docs; deal must DSCR.
Hard money
10% down · 12.0% · 12mo
- Down + closing
- —
- Monthly P&I
- —
- Monthly cashflow
- —
- DSCR
- —
- Eligible?
- —
Short-term bridge; refi at stabilization.
Rent comps 1 comps
| Address | Beds | Baths | Sqft | Rent | $/sqft | DOM | Units | Dist |
|---|---|---|---|---|---|---|---|---|
| 217 Hunters Ln Unit 217 Eagle Lake, TX | 2.0 | 2.0 | 936 | $975 | $1.04 | 24d | 1 | 0.44mi |
Listing history 1 events
-
2026-05-20$19,000 Active
ⓘ Source: listings_history table (triggers on properties + properties_extension) + one-shot
backfill from property_details.listing_events for pre-trigger history.
Tax reassessment forecast TX · Resets to sale price
- Current annual tax
- $928 · $77/mo
- Projected year-2 tax
- $928 · $77/mo
- Expected delta
- $0/yr ($0/mo · 0.0%)
ⓘ Screening estimate from a state-policy table — verify with the county assessor before closing.
Climate risk First Street
- Flood 1/10 Low FEMA zone X (unshaded) · 0% chance over 30 yrs
- Wildfire 3/10 Moderate
- Heat 8/10 Severe 7 d/yr ≥112°F today · 22 d/yr by 30 yrs out
- Wind 9/10 Extreme 99% chance of damaging wind over 30 yrs
- Air quality 1/10 Low 0 unhealthy d/yr today · 0 by 30 yrs out
Nearby sold comps map
Loading sold comps map…
Walkable amenities ~0.75 mi
Loading nearby amenities…
Taxation est. · year 1
- Rental income
- $11,700
- − Mortgage interest
- −$1,064
- − Property taxes
- −$928
- − Insurance
- −$95
- − Repairs & maintenance
- −$936
- − Management
- −$936
- − Depreciation
- −$553
- Taxable income
- $7,188
- Est. tax owed @ 24.0%
- −$1,725
- After-tax cash flow
- $5,300/yr
For passive investors: Depreciation is non-cash, so a rental often shows a tax loss while cash-flowing — sheltering income. Rental losses are passive: they offset passive income freely, and up to $25,000/yr can offset ordinary (W-2) income if you actively participate and your MAGI is under $100k (phasing out to $0 by $150k); unused losses carry forward. On sale, claimed depreciation is recaptured at up to 25%, and gains may owe capital-gains tax (a 1031 exchange can defer both). Figures are a year-1 estimate at your 24.0% rate — not tax advice; consult a CPA.
Schools (NCES district)
- District
- Rice CISD
- NCES district ID
- 4836970
- Math proficiency
- 34% ▼ -9.00%
- Reading proficiency
- 32% ▼ -2.00%
- Median HH income
- $39,704
- Composite
- 27.72/100
- National rank
- #6907
- State rank
- #574 of 826 in TX
Livability — Eagle Lake
- Score
- 62/100
- State rank
- #913
- US rank
- #16344
Category grades
Schools grade is shown separately in the Schools card above.
Census & demographics
- Census place
- Eagle Lake, TX
- Population (ZIP)
- 4,037
Population outlook (Colorado County) Hauer SSP2
- Today (2025)
- 20,932 people
- By 2030
- 20,803 · -0.6%
- By 2040
- 20,518 · -2.0%
- By 2050
- 20,325 · -2.9%
- By 2075
- 20,086 · -4.0%
- By 2100
- 18,228 · -12.9%
Race, ethnicity, and origin ACS 2023
- Neighborhood character
- Diverse neighborhood (Simpson 0.57)
- Race & ethnicity
- Hispanic / Latino 58% White 22% Black 19% Two or more races 16% Native American 2%
- Hispanic origin (detail)
- Mexican 54%
- Common ancestry
- Lithuanian 4% Italian 1%
- Foreign-born
- 9% · Canada
- Languages at home
- 68% English-only · Spanish 32%
Political lean MEDSL · Colorado
- 2024 margin
- Solid R (+57.2) · D 21.1% · R 78.3%
- 2008→2024 swing
- -17.9pp toward R · 2008: -39.4pp · 2024: -57.2pp
- All cycles
- 2024: R+57.2 2020: R+50.6 2016: R+51.2 2012: R+49.3 2008: R+39.4
Not yet ingested
- Civics
- —
Market trends
- HPI YoY
- ▲ 1.30%
- Current HPI
- 179.6872
- Rent YoY
- —
- Metro
- —
- State GDP YoY
- ▲ 3.95%
- F500 in state
- 110
Industry mix (Fortune 500 HQ in TX)
| Industry | F500 HQs | Revenue |
|---|---|---|
| Energy | 16 | $1,198B |
|
||
| Technology | 5 | $198B |
|
||
| Engineering / Construction | 4 | $72B |
|
||
| Energy Services | 3 | $60B |
|
||
| Utilities | 3 | $41B |
|
||
| Healthcare | 2 | $330B |
|
||
Price history
1 event — show timeline
- 2026-05-20 Listed $19,000 HARMLS
Property tax history
+7.4%/yrLatest (2025): $928 · -1.6% YoY. Source: county tax records.
Cash-flow waterfall
monthlySold comps — $/sqft
last 12 mo · ≤1 miLoading sold comps…