 Multi-family
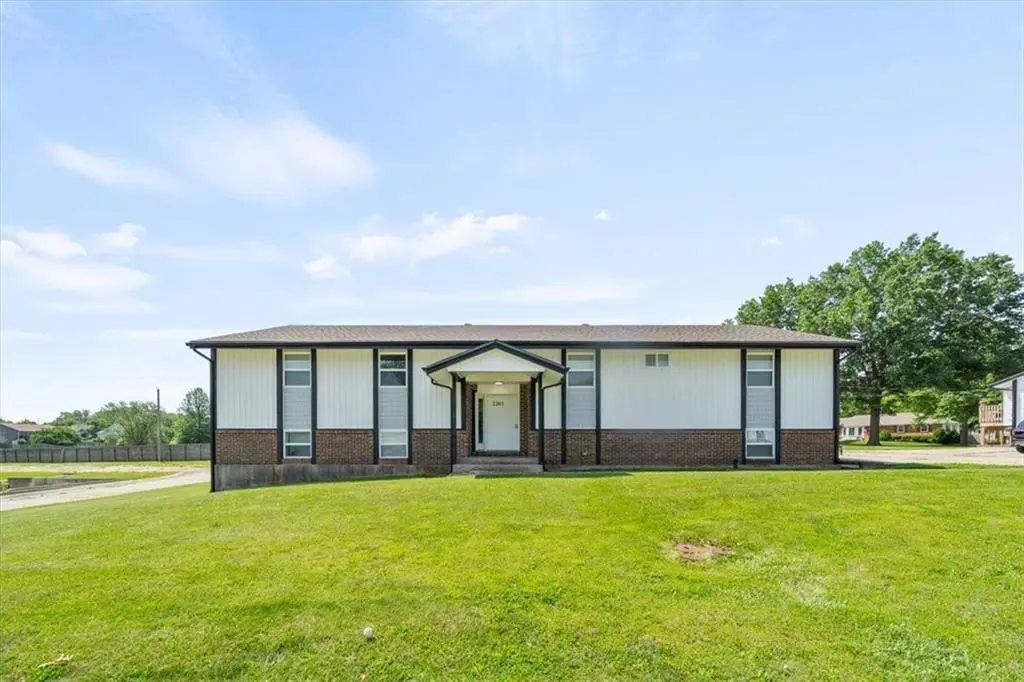
2203 Mission Rd · Harrisonville, MO
Flood risk 1/10 · Minimal
- FEMA flood zone
- X (unshaded)
- Chance of flooding over 30 yrs
- 0.0%
- Est. flood insurance / yr
- $507 – $1,088
Fire risk 3/10 · Minor
- Est. fire insurance / yr
- $1,054 – $1,958
Heat risk 4/10 · Minor
- Hot days now (above 108°F)
- 7 days/yr
- Hot days in 30 yrs
- 17 days/yr
Wind risk 2/10 · Minimal
- Chance of severe wind over 30 yrs
- —
Air-quality risk 2/10 · Minimal
- Unhealthy air days now
- 0 days/yr
- Unhealthy air days in 30 yrs
- 1 days/yr
Risk factors via First Street. Map © Google.
Why this score? — see what drove the B- grade
The composite is a weighted blend of 9 inputs, each scored 0–100. Each bar is that input's sub-score; the figure is the points it added to the 100-point composite (weight × sub-score).
- Cash flow +30.0/30.0
- 1% rule +10.0/10.0
- DSCR +10.0/10.0
- ARV discount +7.5/15.0
- Schools +3.4/10.0
- Livability +3.3/5.0
- Rent growth +2.5/5.0
- Condition / age +2.5/5.0
- Appreciation +0.0/10.0
$588,000
🖨 Deal sheet 📄 Offer letter ✓ Due diligence
Multi-family units
County records classify this as Multi-Family (5+ Unit). Listing-text estimate: 1 unit. estimate disagrees with records
5+ unit building — per-unit beds/baths from public records are typically unavailable; the breakdown below (if shown) is an estimate from the listing text.
Listing remarks MLS
This portfolio of 10 apartment buildings presents a rare chance to invest in a fully renovated community with flexible purchase options — buy one building or several at once. Each building underwent extensive interior and exterior updates in 2024, offering modern, comfortable living spaces that appeal to today’s renters. Every unit is separately metered, allowing for precise utility billing and improved expense management. Each building features its own community laundry room and dedicated storage units, generating additional monthly income while providing convenient amenities that enhance resident satisfaction. Whether you’re looking to expand your portfolio or acquire a turnkey property with diversified income streams, this complex delivers both flexibility and strong cash flow potential. A trash and parking easement will be in place for further seamless property operations. Located in the up-and-coming city of Harrisonville, MO, this investment benefits from a growing local economy, affordable cost of living, and increasing demand for quality rental housing. Harrisonville’s strategic location with easy access to Kansas City makes it an attractive choice for renters seeking suburban comfort with urban accessibility. For investors, this means strong potential for rental growth, stable occupancy rates, and long-term appreciation in one of Missouri’s most promising markets.
Key facts
- 0.31 acre lot
- Built 1972
- Listed 349 days
Tags
Neighborhood map
What this means for you Summary
Snapshot
- This is a 8-bed/4.5-bath multifamily listed at $588k.
Deal economics
- At list price, monthly cash flow is $6k ($78k/yr) — positive.
- The deal already cash-flows at list — no discount required.
- Meets the 1% rule at list price ($13k rent vs $588k).
- Recommended offer: $517k (12.0% below list) — sets the bar for market timing.
- Cap rate 19.5% vs local median 3.2% in Harrisonville — top-decile yield for the area; either an underpriced asset or a hidden risk that comps aren't pricing in. Stress-test before assuming the spread holds.
Location & tenants
- Location reads 66/100 on livability (#231 in MO) — a middle-class / working-renter tenant base. Strengths: cost of living A+, housing A+; Watch: health & safety C-, crime F, amenities F.
- Harrisonville R-IX (town): math 32% / reading 46% proficiency, ranked #150 of 324 in MO (top 46%) — families likely to look elsewhere, expect single-tenant / working-renter base with shorter leases.
- Market conditions: 119 active listings in the ZIP; 588 units permitted in Cass County in 2024 (0 in 5+ unit buildings).
Forward outlook
- Local home prices are declining (-3.0%/yr); year-one equity from $4k of loan paydown is wiped out by about $18k of value loss. Plan a longer hold.
- Cass County population projected to shrink 3% by 2050 — rents likely to lag national; underwrite the cash flow, not the appreciation.
- At projected returns (-3.0% appreciation + 3.0% rent growth), your $165k cash investment doubles in ~3 years — after that, you're playing with house money.
Negotiation context
- It's been on market 350 days — a 12% lower offer ($517k) is reasonable based on typical stale-listing flexibility.
- 2 sale attempts since 2y ago; this cycle's ask has dropped $87k (13%) from the opening price — seller is motivated, your offer sets the floor, not the list.
Questions for the listing agent
- It's been on market 350 days. Have you received any prior offers? Is the seller open to a 12% concession, seller financing, or rate buy-down credit?
- Built in 1972 — when were the roof, HVAC, electrical panel, plumbing, and water heater last replaced?
- Why hasn't it sold? Are there any deal-killer items the seller is aware of (foundation, flood, title, zoning, code violations)?
- Is there a deadline driving the sale (1031 exchange, divorce, estate, relocation)? That informs how much negotiation room exists.
- Schools are B-rated — typically a magnet for longer-tenancy family renters. What's the average tenant stay here, and is there a school-zone premium baked into asking?
- Crime grade is F in this area — have there been break-ins, vandalism, or insurance claims at this property in the last 3 years? What carrier currently insures it and at what premium?
- What's the average days-on-market for RENTAL listings here right now (not sales)? A rising rental-DOM trend means longer vacancies and softer asking-rent achievability than the comps imply.
- What's the recent tenant-quality profile in this submarket — average credit score on applications, eviction rate, late-payment / NSF rate, and stable-employment percentage? A property-management company in the area should have these aggregated.
- How much new apartment / multifamily construction is in the pipeline within 1–3 miles? Heavy new supply (>2% of stock underway) typically softens rents 12–24 months out; light construction supports rent growth.
Investment metrics
- 1% rule
- 2.16% ✓
- Cap rate
- 19.50%
- Cash-on-cash
- 47.18%
- DSCR
- 3.10
- GRM
- 3.9
CMA / ARV
- ARV (median comp)
- $254,372
- List price
- $588,000
- Delta
- 131.16%
- Verdict
- OVERPRICED
- Comps
- 2 within 1.0 mi
Projected returns pro-forma
-3.0% appreciation · 3.0% rent growth · sell at horizon
- IRR
- 44.5%
- Equity multiple
- 2.92×
- Total profit
- $316,894
- Equity at exit
- $87,673
- IRR
- 50.5%
- Equity multiple
- 5.90×
- Total profit
- $806,340
- Equity at exit
- $50,839
Cash invested: $164,640 (down + closing). Projections, not guarantees.
Landlord ↔ Tenant lean methodology
- Overall (STATE)
- 81 Strongly Landlord-Friendly
- State Missouri
- 81 Strongly Landlord-Friendly · R+10
- County
- — inherits STATE
- City
- — inherits STATE
ZIP-level market 64701
- Active inventory
- 119
- Price-to-rent
- 38.6×
Monthly cashflow live
- Estimated rent
- $12,686 high interval (Pro) →
- Mortgage (P&I)
- −$3,084
- Tax from tax record
- −$220 /mo · $2,639/yr
- Insurance
- −$245
- HOA
- −$0
- Vacancy / Maint / Mgmt
- −$2,664
- Net cashflow
- $6,473
Break-even live
10-unit breakdown (identical units grouped — click to expand)
| Units | Beds | Baths | Est. rent |
|---|---|---|---|
| 10× units | 2 | 1 | $12,690 |
| #1 | 2 | 1 | $1,269 |
| #2 | 2 | 1 | $1,269 |
| #3 | 2 | 1 | $1,269 |
| #4 | 2 | 1 | $1,269 |
| #5 | 2 | 1 | $1,269 |
| #6 | 2 | 1 | $1,269 |
| #7 | 2 | 1 | $1,269 |
| #8 | 2 | 1 | $1,269 |
| #9 | 2 | 1 | $1,269 |
| #10 | 2 | 1 | $1,269 |
| Total (10 units) | $12,686 | ||
UW: 25.0% down · 7.5% · 30yr · 1.5% tax · 5.0% vac · 8.0% maint · 8.0% mgmt
Financing live
Cash to close
- Down payment
- $147,000
- Closing costs
- $17,640
- Reserves months
- —
- Total cash needed
- —
Loan-product check · same deal, 3 products live
Conventional
25% down · 7.5% · 30yr
- Down + closing
- —
- Monthly P&I
- —
- Monthly cashflow
- —
- DSCR
- —
- Eligible?
- —
Personal DTI + credit; lowest rate.
DSCR
20% down · 8.5% · 30yr
- Down + closing
- —
- Monthly P&I
- —
- Monthly cashflow
- —
- DSCR
- —
- Eligible?
- —
No personal income docs; deal must DSCR.
Hard money
10% down · 12.0% · 12mo
- Down + closing
- —
- Monthly P&I
- —
- Monthly cashflow
- —
- DSCR
- —
- Eligible?
- —
Short-term bridge; refi at stabilization.
Listing history 7 events
-
2026-06-02days on market $588,000 Active 350 DOM
-
2026-06-01days on market $588,000 Active 349 DOM
-
2026-05-31days on market $588,000 Active 348 DOM
-
2026-04-13price $588,000 1426-char remark
Show marketing remark (1426 chars)
This portfolio of 10 apartment buildings presents a rare chance to invest in a fully renovated community with flexible purchase options — buy one building or several at once. Each building underwent extensive interior and exterior updates in 2024, offering modern, comfortable living spaces that appeal to today’s renters. Every unit is separately metered, allowing for precise utility billing and improved expense management. Each building features its own community laundry room and dedicated storage units, generating additional monthly income while providing convenient amenities that enhance resident satisfaction. Whether you’re looking to expand your portfolio or acquire a turnkey property with diversified income streams, this complex delivers both flexibility and strong cash flow potential. A trash and parking easement will be in place for further seamless property operations. Located in the up-and-coming city of Harrisonville, MO, this investment benefits from a growing local economy, affordable cost of living, and increasing demand for quality rental housing. Harrisonville’s strategic location with easy access to Kansas City makes it an attractive choice for renters seeking suburban comfort with urban accessibility. For investors, this means strong potential for rental growth, stable occupancy rates, and long-term appreciation in one of Missouri’s most promising markets.
-
2025-06-17$675,000 Active 1426-char remark
Show marketing remark (1426 chars)
This portfolio of 10 apartment buildings presents a rare chance to invest in a fully renovated community with flexible purchase options — buy one building or several at once. Each building underwent extensive interior and exterior updates in 2024, offering modern, comfortable living spaces that appeal to today’s renters. Every unit is separately metered, allowing for precise utility billing and improved expense management. Each building features its own community laundry room and dedicated storage units, generating additional monthly income while providing convenient amenities that enhance resident satisfaction. Whether you’re looking to expand your portfolio or acquire a turnkey property with diversified income streams, this complex delivers both flexibility and strong cash flow potential. A trash and parking easement will be in place for further seamless property operations. Located in the up-and-coming city of Harrisonville, MO, this investment benefits from a growing local economy, affordable cost of living, and increasing demand for quality rental housing. Harrisonville’s strategic location with easy access to Kansas City makes it an attractive choice for renters seeking suburban comfort with urban accessibility. For investors, this means strong potential for rental growth, stable occupancy rates, and long-term appreciation in one of Missouri’s most promising markets.
-
2024-07-19historical $1,300
-
2024-07-11$1,300
ⓘ Source: listings_history table (triggers on properties + properties_extension) + one-shot
backfill from property_details.listing_events for pre-trigger history.
Tax reassessment forecast MO · Resets to sale price
- Current annual tax
- $2,639 · $220/mo
- Projected year-2 tax
- $5,704 · $475/mo
- Expected delta
- +$3,065/yr (+$255/mo · 116.1%)
ⓘ Screening estimate from a state-policy table — verify with the county assessor before closing.
Climate risk First Street
- Flood 1/10 Low FEMA zone X (unshaded) · 0% chance over 30 yrs
- Wildfire 3/10 Moderate
- Heat 4/10 Moderate 7 d/yr ≥108°F today · 17 d/yr by 30 yrs out
- Wind 2/10 Low
- Air quality 2/10 Low 0 unhealthy d/yr today · 1 by 30 yrs out
Nearby sold comps map
Loading sold comps map…
Walkable amenities ~0.75 mi
Loading nearby amenities…
Taxation est. · year 1
- Rental income
- $152,232
- − Mortgage interest
- −$32,937
- − Property taxes
- −$2,639
- − Insurance
- −$2,940
- − Repairs & maintenance
- −$12,179
- − Management
- −$12,179
- − Depreciation
- −$17,105
- Taxable income
- $72,253
- Est. tax owed @ 24.0%
- −$17,341
- After-tax cash flow
- $60,341/yr
For passive investors: Depreciation is non-cash, so a rental often shows a tax loss while cash-flowing — sheltering income. Rental losses are passive: they offset passive income freely, and up to $25,000/yr can offset ordinary (W-2) income if you actively participate and your MAGI is under $100k (phasing out to $0 by $150k); unused losses carry forward. On sale, claimed depreciation is recaptured at up to 25%, and gains may owe capital-gains tax (a 1031 exchange can defer both). Figures are a year-1 estimate at your 24.0% rate — not tax advice; consult a CPA.
Schools (NCES district)
- District
- Harrisonville R-IX
- NCES district ID
- 2913760
- Math proficiency
- 32% ▼ -6.00%
- Reading proficiency
- 46% ▬ 0.00%
- Median HH income
- $49,997
- Composite
- 33.61/100
- National rank
- #5409
- State rank
- #150 of 324 in MO
Livability — Harrisonville
- Score
- 66/100
- State rank
- #231
- US rank
- #11262
Category grades
Schools grade is shown separately in the Schools card above.
Census & demographics
- Census place
- Harrisonville, MO
- Population (ZIP)
- 14,462
Population outlook (Cass County) Hauer SSP2
- Today (2025)
- 105,292 people
- By 2030
- 106,109 · +0.8%
- By 2040
- 105,786 · +0.5%
- By 2050
- 102,062 · -3.1%
- By 2075
- 88,569 · -15.9%
- By 2100
- 68,293 · -35.1%
Race, ethnicity, and origin ACS 2023
- Neighborhood character
- Predominantly White (92%)
- Race & ethnicity
- White 92% Two or more races 5% Hispanic / Latino 3%
- Common ancestry
- Serbian 3% Lithuanian 2% Iranian 2%
- Foreign-born
- 2% · Canada
- Languages at home
- 97% English-only · Spanish 3%
Political lean MEDSL · Cass
- 2024 margin
- Solid R (+32.1) · D 33.3% · R 65.4% · Other 1.3%
- 2008→2024 swing
- -12.5pp toward R · 2008: -19.6pp · 2024: -32.1pp
- All cycles
- 2024: R+32.1 2020: R+31.6 2016: R+35.9 2012: R+28.4 2008: R+19.6
Not yet ingested
- Civics
- —
Market trends
- HPI YoY
- ▼ -118.32%
- Current HPI
- 204.7926
- Rent YoY
- —
- Metro
- —
- State GDP YoY
- ▲ 1.84%
- F500 in state
- 20
Industry mix (Fortune 500 HQ in MO)
| Industry | F500 HQs | Revenue |
|---|---|---|
| Healthcare | 1 | $163B |
|
||
| Insurance | 1 | $21B |
|
||
| Industrial Technology | 1 | $17B |
|
||
| Retail | 1 | $16B |
|
||
| Industrial Distribution | 1 | $10B |
|
||
| Utilities | 1 | $9B |
|
||
Price history
+45130.8% since first listed4 events — show timeline
- 2026-04-13 Price Changed $588,000 Heartland MLS as Distributed by MLS Grid
- 2025-06-17 Listed $675,000 Heartland MLS as Distributed by MLS Grid
- 2024-07-19 Rental Removed $1,300 APPFOLIO
- 2024-07-11 Listed for Rent $1,300 APPFOLIO
Property tax history
+3.9%/yrLatest (2025): $2,639 · +13.7% YoY. Source: county tax records.
Cash-flow waterfall
monthlySold comps — $/sqft
last 12 mo · ≤1 miLoading sold comps…