 6-Plex
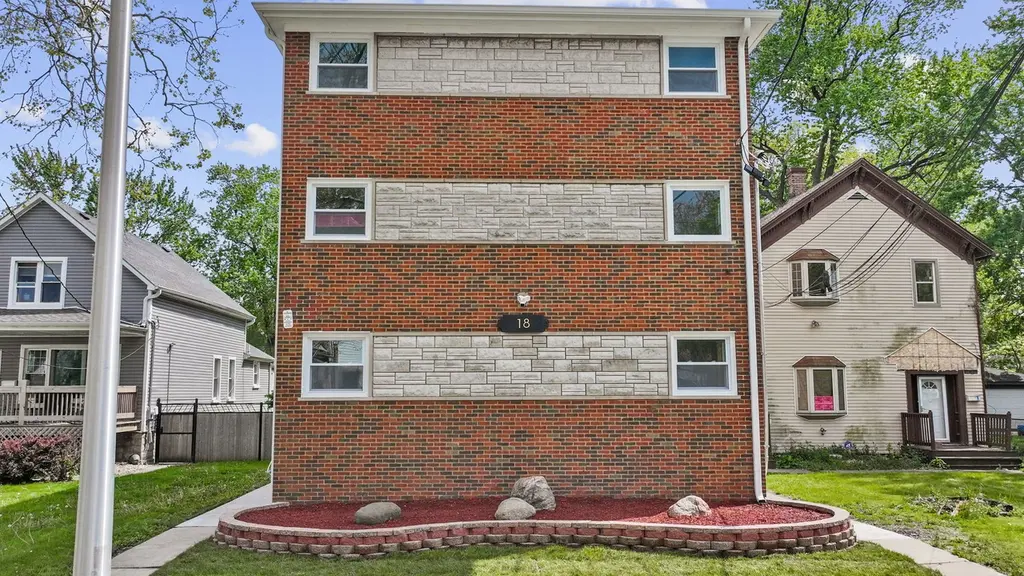
18 E 137th St · Riverdale, IL
Flood risk 3/10 · Minor
- FEMA flood zone
- X (unshaded)
- Chance of flooding over 30 yrs
- 0.2%
- Est. flood insurance / yr
- $473 – $860
Fire risk 1/10 · Minimal
- Est. fire insurance / yr
- $804 – $1,492
Heat risk 3/10 · Minor
- Hot days now (above 101°F)
- 7 days/yr
- Hot days in 30 yrs
- 15 days/yr
Wind risk 2/10 · Minimal
- Chance of severe wind over 30 yrs
- —
Air-quality risk 4/10 · Minor
- Unhealthy air days now
- 4 days/yr
- Unhealthy air days in 30 yrs
- 5 days/yr
Risk factors via First Street. Map © Google.
Why this score? — see what drove the B- grade
The composite is a weighted blend of 9 inputs, each scored 0–100. Each bar is that input's sub-score; the figure is the points it added to the 100-point composite (weight × sub-score).
- Cash flow +30.0/30.0
- 1% rule +10.0/10.0
- DSCR +10.0/10.0
- ARV discount +7.5/15.0
- Rent growth +4.5/5.0
- Livability +3.5/5.0
- Condition / age +2.5/5.0
- Schools +0.7/10.0
- Appreciation +0.0/10.0
$420,000
🖨 Deal sheet 📄 Offer letter ✓ Due diligence
Multi-family units
County records classify this as Multi-Family (5+ Unit). Listing-text estimate: 6 units. confirmed
5+ unit building — per-unit beds/baths from public records are typically unavailable; the breakdown below (if shown) is an estimate from the listing text.
Listing remarks
AWESOME OPPORTUNITY. SOLID 6 UNIT AND REBUILT LIKE NEW CONSTRUCTION. FLEXICORE CONSTRUCTION. NEARLY 6,000 SQ. FT. PLUS FULL BASEMENT AREAS. LITERALLY ALL NEW INTERIOR & EXTERIOR EXCEPT THE STRUCTURE. HERE IS THE CHANCE TO HAVE TOP INCOME WITH MOVING IN ALL NEW TENANTS WHO DEMAND TOP CONDITION. COMPLETELY RENOVATED 6-UNIT BLDG WITH EACH APARTMENT FEATURING 2 BEDROOMS & 1 BATH IN EACH UNIT! ONE OF THE NICEST BUILDINGS IN RIVERDALE. ALL NEW MECHANICALS THROUGH OUT. NEW ROOF, GUTTERS & TRIM. 7 NEW WATER TANKS. ALL NEW WINDOWS. NEW INSULATION. ALL NEW HEATING SYSTEMS IN EACH UNIT & BASEMENT AREAS. ALL NEW FLOORING THROUGHOUT. LV FLOORING IN LIVING ROOM, KITCHENS & B
Key facts
- 5,925 sq ft lot
- Built 1970
- Listed 29 days
Neighborhood map
What this means for you Summary
Snapshot
- This is a 6 × 2-bed/1.8-bath units multifamily listed at $420k.
Deal economics
- At list price, monthly cash flow is $2k ($30k/yr) — positive. Per door: $412/mo.
- The deal already cash-flows at list — no discount required.
- Meets the 1% rule at list price ($8k rent vs $420k).
- Recommended offer: $414k (1.5% below list) — sets the bar for market timing.
- Cap rate 13.4% vs local median 9.5% in Riverdale — top-decile yield for the area; either an underpriced asset or a hidden risk that comps aren't pricing in. Stress-test before assuming the spread holds.
Location & tenants
- Location reads 69/100 on livability (#434 in IL) — a middle-class / working-renter tenant base. Strengths: commute A+, cost of living A+, housing A-; Watch: health & safety C-, schools F, crime F.
- Thornton Twp Hsd 205 (suburban): math 7% / reading 8% proficiency, ranked #594 of 620 in IL (top 96%) — low school quality limits family demand, transient renter base, plan for 1-2y turnover.
- Market conditions: Rents rising fast (+7.8%/yr); 76 active listings in the ZIP; lower-income renter base — watch delinquency; 6,272 units permitted in Cook County in 2024 (4,658 in 5+ unit buildings).
- At $8,079/mo this rent would consume 260% of the median local household income ($37k/yr) (locally 1868% of renters already pay >50% of income on rent) — very limited rent-growth headroom before tenants either downsize or default.
Forward outlook
- Local home prices are declining (-3.0%/yr); year-one equity from $3k of loan paydown is wiped out by about $13k of value loss. Plan a longer hold.
- At projected returns (-3.0% appreciation + 7.8% rent growth), your $118k cash investment doubles in ~4 years — after that, you're playing with house money.
Negotiation context
- It's been on market 30 days — a 2% lower offer ($414k) is reasonable based on typical stale-listing flexibility.
- Current owner paid $215k; list at $420k implies a 95% gain — meaningful room to come down on a strong offer.
Risks & watch-outs
- Watch-outs: property tax is 4.4% of price.
Questions for the listing agent
- Can we see the unit-by-unit rent roll, current vacancy, and any below-market leases? What's the average tenancy length?
- What capital expenditures (roof, boiler, parking lot, exteriors) have been made in the last 5 years, and what's planned in the next 2?
- Built in 1970 — when were the roof, HVAC, electrical panel, plumbing, and water heater last replaced?
- Property tax is high relative to price — has the assessment been appealed recently, and will the sale trigger a re-assessment?
- Is there a deadline driving the sale (1031 exchange, divorce, estate, relocation)? That informs how much negotiation room exists.
- Schools are F-rated, which usually means shorter tenancies and higher turnover. Who's the typical renter profile here, and what's been the actual vacancy rate?
- Crime grade is F in this area — have there been break-ins, vandalism, or insurance claims at this property in the last 3 years? What carrier currently insures it and at what premium?
- What's the average days-on-market for RENTAL listings here right now (not sales)? A rising rental-DOM trend means longer vacancies and softer asking-rent achievability than the comps imply.
- What's the recent tenant-quality profile in this submarket — average credit score on applications, eviction rate, late-payment / NSF rate, and stable-employment percentage? A property-management company in the area should have these aggregated.
- How much new apartment / multifamily construction is in the pipeline within 1–3 miles? Heavy new supply (>2% of stock underway) typically softens rents 12–24 months out; light construction supports rent growth.
Investment metrics
- 1% rule
- 1.92% ✓
- Cap rate
- 13.36%
- Cash-on-cash
- 25.23%
- DSCR
- 2.12
- GRM
- 4.3
CMA / ARV
No comps found within radius.
Projected returns pro-forma
-3.0% appreciation · 7.82% rent growth · sell at horizon
- IRR
- 25.1%
- Equity multiple
- 2.12×
- Total profit
- $131,276
- Equity at exit
- $62,623
- IRR
- 36.2%
- Equity multiple
- 5.31×
- Total profit
- $506,426
- Equity at exit
- $36,314
Cash invested: $117,600 (down + closing). Projections, not guarantees.
Landlord ↔ Tenant lean methodology
- Overall (STATE)
- 43 Moderately Tenant-Leaning
- State Illinois
- 43 Moderately Tenant-Leaning · D+7
- County
- — inherits STATE
- City
- — inherits STATE
ZIP-level market 60827
- Home prices YoY
- -31.8%
- Rents YoY
- 7.8%
- Active inventory
- 76
- Price-to-rent
- 26.0×
Monthly cashflow live
- Estimated rent
- $8,079 high interval (Pro) →
- Mortgage (P&I)
- −$2,203
- Tax from tax record
- −$1,532 /mo · $18,382/yr
- Insurance
- −$175
- HOA
- −$0
- Vacancy / Maint / Mgmt
- −$1,697
- Net cashflow
- $2,473
Break-even live
6-unit breakdown (identical units grouped — click to expand)
| Units | Beds | Baths | Est. rent |
|---|---|---|---|
| 6× units | 2 | 1.8 | $8,076 |
| #1 | 2 | 1.8 | $1,346 |
| #2 | 2 | 1.8 | $1,346 |
| #3 | 2 | 1.8 | $1,346 |
| #4 | 2 | 1.8 | $1,346 |
| #5 | 2 | 1.8 | $1,346 |
| #6 | 2 | 1.8 | $1,346 |
| Total (6 units) | $8,079 | ||
UW: 25.0% down · 7.5% · 30yr · 1.5% tax · 5.0% vac · 8.0% maint · 8.0% mgmt
Financing live
Cash to close
- Down payment
- $105,000
- Closing costs
- $12,600
- Reserves months
- —
- Total cash needed
- —
Loan-product check · same deal, 3 products live
Conventional
25% down · 7.5% · 30yr
- Down + closing
- —
- Monthly P&I
- —
- Monthly cashflow
- —
- DSCR
- —
- Eligible?
- —
Personal DTI + credit; lowest rate.
DSCR
20% down · 8.5% · 30yr
- Down + closing
- —
- Monthly P&I
- —
- Monthly cashflow
- —
- DSCR
- —
- Eligible?
- —
No personal income docs; deal must DSCR.
Hard money
10% down · 12.0% · 12mo
- Down + closing
- —
- Monthly P&I
- —
- Monthly cashflow
- —
- DSCR
- —
- Eligible?
- —
Short-term bridge; refi at stabilization.
Listing history 20 events
-
2026-06-18days on market $420,000 Active 30 DOM
-
2026-06-17days on market $420,000 Active 29 DOM
-
2026-06-16days on market $420,000 Active 28 DOM
-
2026-06-15days on market $420,000 Active 27 DOM
-
2026-06-13days on market $420,000 Active 25 DOM
-
2026-06-13days on market $420,000 Active 24 DOM
-
2026-06-09days on market $420,000 Active 21 DOM
-
2026-06-08days on market $420,000 Active 20 DOM
-
2026-06-07days on market $420,000 Active 19 DOM
-
2026-06-04days on market $420,000 Active 16 DOM
-
2026-06-03days on market $420,000 Active 15 DOM
-
2026-06-02days on market $420,000 Active 14 DOM
-
2026-06-01days on market $420,000 Active 13 DOM
-
2026-05-31days on market $420,000 Active 12 DOM
-
2026-05-20price $420,000
-
2026-05-19$380,000 Active
-
2026-04-09historical
-
2000-07-17soldstatus $215,000
-
1989-11-06soldstatus $140,000
-
1977-04-21soldstatus $100,000
ⓘ Source: listings_history table (triggers on properties + properties_extension) + one-shot
backfill from property_details.listing_events for pre-trigger history.
Tax reassessment forecast IL · Partial reset (capped growth)
- Current annual tax
- $18,382 · $1,532/mo
- Projected year-2 tax
- $18,382 · $1,532/mo
- Expected delta
- $0/yr ($0/mo · 0.0%)
ⓘ Screening estimate from a state-policy table — verify with the county assessor before closing.
Climate risk First Street
- Flood 3/10 Moderate FEMA zone X (unshaded) · 20% chance over 30 yrs
- Wildfire 1/10 Low
- Heat 3/10 Moderate 7 d/yr ≥101°F today · 15 d/yr by 30 yrs out
- Wind 2/10 Low
- Air quality 4/10 Moderate 4 unhealthy d/yr today · 5 by 30 yrs out
Nearby sold comps map
Loading sold comps map…
Walkable amenities ~0.75 mi
Loading nearby amenities…
Taxation est. · year 1
- Rental income
- $96,948
- − Mortgage interest
- −$23,527
- − Property taxes
- −$18,382
- − Insurance
- −$2,100
- − Repairs & maintenance
- −$7,756
- − Management
- −$7,756
- − Depreciation
- −$12,218
- Taxable income
- $25,209
- Est. tax owed @ 24.0%
- −$6,050
- After-tax cash flow
- $23,626/yr
For passive investors: Depreciation is non-cash, so a rental often shows a tax loss while cash-flowing — sheltering income. Rental losses are passive: they offset passive income freely, and up to $25,000/yr can offset ordinary (W-2) income if you actively participate and your MAGI is under $100k (phasing out to $0 by $150k); unused losses carry forward. On sale, claimed depreciation is recaptured at up to 25%, and gains may owe capital-gains tax (a 1031 exchange can defer both). Figures are a year-1 estimate at your 24.0% rate — not tax advice; consult a CPA.
Schools (NCES district)
- District
- Thornton Twp Hsd 205
- NCES district ID
- 1738970
- Math proficiency
- 7% ▬ 0.00%
- Reading proficiency
- 8% ▼ -2.00%
- Median HH income
- $43,392
- Composite
- 6.92/100
- National rank
- #9976
- State rank
- #594 of 620 in IL
Livability — Riverdale
- Score
- 69/100
- State rank
- #434
- US rank
- #8867
Category grades
Schools grade is shown separately in the Schools card above.
Census & demographics
- Census place
- Riverdale, IL
- County
- Cook County · 4,486,803 people
- City population
- 24,713
- Metro
- Chicago-Naperville-Elgin, IL-IN-WI
- Population (ZIP)
- 24,713
- Household income
- $37,217
- Rent vs Own
- Severe rent burden
- 1868.0
Population outlook (Cook County) Hauer SSP2
- Today (2025)
- 5,347,519 people
- By 2030
- 5,357,703 · +0.2%
- By 2040
- 5,324,924 · -0.4%
- By 2050
- 5,230,762 · -2.2%
- By 2075
- 4,785,735 · -10.5%
- By 2100
- 4,188,836 · -21.7%
Race, ethnicity, and origin ACS 2023
- Neighborhood character
- Predominantly Black (88%)
- Race & ethnicity
- Black 88% Two or more races 5% Hispanic / Latino 5% White 2%
- Common ancestry
- Iranian 1%
- Foreign-born
- 2% · Canada
- Languages at home
- 96% English-only · Spanish 3%
Political lean MEDSL · Cook
- 2024 margin
- Solid D (+42.0) · D 70.4% · R 28.4% · Other 1.2%
- 2008→2024 swing
- -11.4pp toward R · 2008: 53.4pp · 2024: 42.0pp
- All cycles
- 2024: D+42.0 2020: D+50.3 2016: D+53.0 2012: D+49.4 2008: D+53.4
Not yet ingested
- Civics
- —
Market trends
- HPI YoY
- ▼ -76.39%
- Current HPI
- 163.7725
- Rent YoY
- ▲ 7.82%
- Metro
- Chicago-Naperville-Elgin, IL-IN-WI
- State GDP YoY
- ▲ 1.59%
- F500 in state
- 60
Industry mix (Fortune 500 HQ in IL)
| Industry | F500 HQs | Revenue |
|---|---|---|
| Insurance | 4 | $201B |
|
||
| Consumer Goods | 4 | $87B |
|
||
| Industrial Machinery | 3 | $64B |
|
||
| Healthcare | 2 | $55B |
|
||
| Retail / Pharmacy | 1 | $148B |
|
||
| Agriculture / Food | 1 | $86B |
|
||
Price history
+320.0% since first listed6 events — show timeline
- 2026-05-20 Price Changed $420,000 MRED as Distributed by MLS Grid
- 2026-05-19 Listed $380,000 MRED as Distributed by MLS Grid
- 2026-04-09 Listing Removed — MRED as Distributed by MLS Grid
- 2000-07-17 Sold (Public Records) $215,000 Public Records
- 1989-11-06 Sold (Public Records) $140,000 Public Records
- 1977-04-21 Sold (Public Records) $100,000 Public Records
Property tax history
+3.7%/yrLatest (2023): $18,382 · -6.8% YoY. Source: county tax records.
Cash-flow waterfall
monthlySold comps — $/sqft
last 12 mo · ≤1 miLoading sold comps…