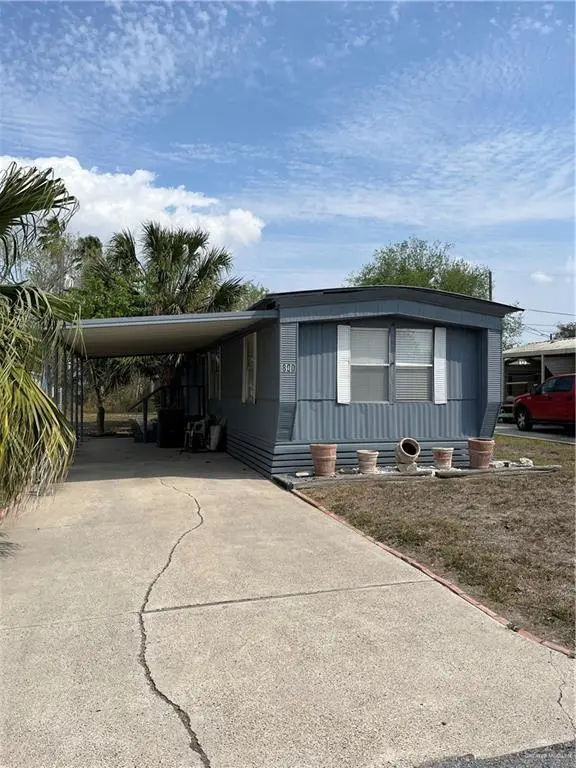
800 Anaqua St · La Feria, TX
Flood risk 6/10 · Moderate
- FEMA flood zone
- X (unshaded)
- Chance of flooding over 30 yrs
- 0.71%
- Est. flood insurance / yr
- $507 – $1,088
Fire risk 5/10 · Moderate
- Est. fire insurance / yr
- $1,222 – $2,270
Heat risk 9/10 · Severe
- Hot days now (above 111°F)
- 7 days/yr
- Hot days in 30 yrs
- 20 days/yr
Wind risk 8/10 · Major
- Chance of severe wind over 30 yrs
- 99.0%
Air-quality risk 1/10 · Minimal
- Unhealthy air days now
- 0 days/yr
- Unhealthy air days in 30 yrs
- 0 days/yr
Risk factors via First Street. Map © Google.
Why this score? — see what drove the B+ grade
The composite is a weighted blend of 9 inputs, each scored 0–100. Each bar is that input's sub-score; the figure is the points it added to the 100-point composite (weight × sub-score).
- Cash flow +30.0/30.0
- ARV discount +15.0/15.0
- 1% rule +10.0/10.0
- DSCR +10.0/10.0
- Livability +3.2/5.0
- Rent growth +2.5/5.0
- Schools +2.5/10.0
- Condition / age +2.5/5.0
- Appreciation +0.0/10.0
$65,000
🖨 Deal sheet 📄 Offer letter ✓ Due diligence
Listing remarks MLS
This property features a 2-bedroom, 2 bath mobile home on a nice sized owned lot in mid Valley. It has split bedrooms with a bath at each end to accommodate company. It comes partially furnished and has a fenced in area on the side of the mobile. There is a shed out back for storage. Everything you need to start having fun.
Key facts
- Fenced in area
- Shed for storage
- Owned lot
Tags
Neighborhood map
What this means for you Summary
Snapshot
- This is a 2-bed/2.0-bath single-family listed at $65k.
Deal economics
- At list price, monthly cash flow is $458 ($5k/yr) — positive.
- The deal already cash-flows at list — no discount required.
- Meets the 1% rule at list price ($1k rent vs $65k).
- Recommended offer: $59k (9.0% below list) — sets the bar for market timing.
- Cap rate 14.7% vs local median 4.4% in La Feria — top-decile yield for the area; either an underpriced asset or a hidden risk that comps aren't pricing in. Stress-test before assuming the spread holds.
Location & tenants
- Location reads 65/100 on livability (#667 in TX) — a middle-class / working-renter tenant base. Strengths: cost of living A+, housing A+; Watch: crime D+, amenities F, commute F.
- La Feria ISD (suburban): math 27% / reading 35% proficiency, ranked #630 of 826 in TX (top 76%) — families likely to look elsewhere, expect single-tenant / working-renter base with shorter leases.
- Market conditions: 260 active listings in the ZIP; 13 comparable units currently listed for rent nearby; rentals at typical pace (median 22d on market — plan ~3-4 weeks tenant-placement turnaround); 46% of comp listings sitting > 30 days — soft ceiling on asking rent; 2,326 units permitted in Cameron County in 2024 (503 in 5+ unit buildings).
Forward outlook
- Local home prices are declining (-3.0%/yr); year-one equity from $449 of loan paydown is wiped out by about $2k of value loss. Plan a longer hold.
- Cameron County population projected at +3% by 2050 — modest demand growth; plan on rents tracking national, not racing it.
- At projected returns (-3.0% appreciation + 3.0% rent growth), your $18k cash investment doubles in ~4 years — after that, you're playing with house money.
Negotiation context
- It's been on market 102 days — a 9% lower offer ($59k) is reasonable based on typical stale-listing flexibility.
Risks & watch-outs
- Climate carrying-cost: major flood risk; severe wind risk, 99% chance of damaging wind over 30y; moderate wildfire risk; extreme-heat days projected 7→20/yr by 2055 (HVAC capex compounding) — expect insurance premiums to compound above CPI over the hold.
Questions for the listing agent
- It's been on market 102 days. Have you received any prior offers? Is the seller open to a 9% concession, seller financing, or rate buy-down credit?
- What does the HOA fee cover, when was the last increase, and are there any pending special assessments or reserve-fund shortfalls?
- Why hasn't it sold? Are there any deal-killer items the seller is aware of (foundation, flood, title, zoning, code violations)?
- Is there a deadline driving the sale (1031 exchange, divorce, estate, relocation)? That informs how much negotiation room exists.
- Crime grade is D in this area — have there been break-ins, vandalism, or insurance claims at this property in the last 3 years? What carrier currently insures it and at what premium?
- What's the average days-on-market for RENTAL listings here right now (not sales)? A rising rental-DOM trend means longer vacancies and softer asking-rent achievability than the comps imply.
- What's the recent tenant-quality profile in this submarket — average credit score on applications, eviction rate, late-payment / NSF rate, and stable-employment percentage? A property-management company in the area should have these aggregated.
- How much new for-sale + rental construction is in the pipeline within 1–3 miles? Heavy new supply typically softens prices + rents 12–24 months out; constrained supply supports both.
Investment metrics
- 1% rule
- 1.67% ✓
- Cap rate
- 14.75%
- Cash-on-cash
- 30.20%
- DSCR
- 2.34
- GRM
- 5.0
CMA / ARV
- ARV (median comp)
- $99,538
- List price
- $65,000
- Delta
- -34.70%
- Verdict
- UNDERPRICED
- Comps
- 2 within 1.0 mi
Show comp detail 3 sales within ~0.75 mi
| Address | Dist | Beds/Ba | Sqft | Sold | Price | $/sf | Match |
|---|---|---|---|---|---|---|---|
| 716 Hibiscus Ave | 0.05mi | 2/1.5 | 960 (+14%) | 7mo | $95,000 | $99 | 66 |
| 320 7th St | 0.47mi | 2/1.0 | 850 (+1%) | 16mo | $145,000 | $171 | 59 |
| 606 Avenue B | 0.43mi | 3/1.0 (+1) | 960 (+14%) | 18mo | $129,500 | $135 | 33 |
Match score weights: distance 35% · size 25% · config 20% · recency 20%. Top-matched comps best support the ARV.
Projected returns pro-forma
-3.0% appreciation · 3.0% rent growth · sell at horizon
- IRR
- 24.8%
- Equity multiple
- 2.02×
- Total profit
- $18,624
- Equity at exit
- $9,692
- IRR
- 32.6%
- Equity multiple
- 3.95×
- Total profit
- $53,721
- Equity at exit
- $5,620
Cash invested: $18,200 (down + closing). Projections, not guarantees.
Landlord ↔ Tenant lean methodology
- Overall (STATE)
- 87 Strongly Landlord-Friendly
- State Texas
- 87 Strongly Landlord-Friendly · R+5
- County
- — inherits STATE
- City
- — inherits STATE
ZIP-level market 78559
- Home prices YoY
- -6.1%
- Active inventory
- 260
- Price-to-rent
- 5.0×
Monthly cashflow live
- Estimated rent
- $1,085 high interval (Pro) →
- Mortgage (P&I)
- −$341
- Tax from tax record
- −$23 /mo · $279/yr
- Insurance
- −$27
- HOA
- −$8
- Vacancy / Maint / Mgmt
- −$228
- Net cashflow
- $458
Break-even live
UW: 25.0% down · 7.5% · 30yr · 1.5% tax · 5.0% vac · 8.0% maint · 8.0% mgmt
Financing live
Cash to close
- Down payment
- $16,250
- Closing costs
- $1,950
- Reserves months
- —
- Total cash needed
- —
Loan-product check · same deal, 3 products live
Conventional
25% down · 7.5% · 30yr
- Down + closing
- —
- Monthly P&I
- —
- Monthly cashflow
- —
- DSCR
- —
- Eligible?
- —
Personal DTI + credit; lowest rate.
DSCR
20% down · 8.5% · 30yr
- Down + closing
- —
- Monthly P&I
- —
- Monthly cashflow
- —
- DSCR
- —
- Eligible?
- —
No personal income docs; deal must DSCR.
Hard money
10% down · 12.0% · 12mo
- Down + closing
- —
- Monthly P&I
- —
- Monthly cashflow
- —
- DSCR
- —
- Eligible?
- —
Short-term bridge; refi at stabilization.
Rent comps 13 comps
| Address | Beds | Baths | Sqft | Rent | $/sqft | DOM | Units | Dist |
|---|---|---|---|---|---|---|---|---|
| 508 6th St Unit A La Feria, TX | 2.0 | 2.0 | 926 | $1,000 | $1.08 | 21d | 1 | 0.38mi |
| 405 Lion's Villa Ave Unit 15 La Feria, TX | 2.0 | 1.5 | 992 | $999 | $1.01 | 14d | 1 | 0.47mi |
| 300 Cub Cir Unit 2 La Feria, TX | 2.0 | 1.5 | 966 | $1,050 | $1.09 | 44d | 1 | 0.64mi |
| 200 Cub Cir La Feria, TX | 2.0 | 1.5 | 966 | $1,024 | $1.06 | 13d | 1 | 0.67mi |
| 2328 S Valley Cir Unit A La Feria, TX | 2.0 | 2.0 | 954 | $1,100 | $1.15 | 44d | 1 | 0.97mi |
| 2114 E Valley Cir Unit B La Feria, TX | 2.0 | 2.0 | 954 | $1,100 | $1.15 | 14d | 1 | 0.99mi |
| 2332 S Valley Cir Unit A La Feria, TX | 2.0 | 2.0 | 954 | $1,000 | $1.05 | 14d | 1 | 1.02mi |
| 2225 S Valley Cir Unit B La Feria, TX | 3.0 | 2.0 | 980 | $1,225 | $1.25 | 44d | 1 | 1.04mi |
| 2429 Summit Rd Unit B La Feria, TX | 2.0 | 2.0 | 965 | $1,150 | $1.19 | 21d | 1 | 1.08mi |
| 2228 N Valley Cir Unit A La Feria, TX | 3.0 | 2.0 | 980 | $1,225 | $1.25 | 14d | 1 | 1.08mi |
| 2226 N Valley Cir Unit B La Feria, TX | 3.0 | 2.0 | 980 | $1,225 | $1.25 | 44d | 1 | 1.08mi |
| 2326 N Valley Cir Unit B La Feria, TX | 3.0 | 2.0 | 980 | $1,225 | $1.25 | 44d | 1 | 1.09mi |
| 2526 N Valley Cir Unit A La Feria, TX | 2.0 | 2.0 | 786 | $1,125 | $1.43 | 44d | 1 | 1.13mi |
HOA detail
- Monthly dues
- $8 · $96/yr
Listing history 16 events
-
2026-06-18days on market $65,000 Active 102 DOM
-
2026-06-17days on market $65,000 Active 101 DOM
-
2026-06-16days on market $65,000 Active 100 DOM
-
2026-06-15days on market $65,000 Active 99 DOM
-
2026-06-14days on market $65,000 Active 97 DOM
-
2026-06-13days on market $65,000 Active 96 DOM
-
2026-06-10days on market $65,000 Active 94 DOM
-
2026-06-09days on market $65,000 Active 93 DOM
-
2026-06-08days on market $65,000 Active 92 DOM
-
2026-06-07days on market $65,000 Active 91 DOM
-
2026-06-03days on market $65,000 Active 87 DOM
-
2026-06-02days on market $65,000 Active 86 DOM
-
2026-06-01days on market $65,000 Active 85 DOM
-
2026-05-31days on market $65,000 Active 84 DOM
-
2026-05-30days on market $65,000 Active 83 DOM
-
2026-03-06$65,000 Active 325-char remark
Show marketing remark (325 chars)
This property features a 2-bedroom, 2 bath mobile home on a nice sized owned lot in mid Valley. It has split bedrooms with a bath at each end to accommodate company. It comes partially furnished and has a fenced in area on the side of the mobile. There is a shed out back for storage. Everything you need to start having fun.
ⓘ Source: listings_history table (triggers on properties + properties_extension) + one-shot
backfill from property_details.listing_events for pre-trigger history.
Tax reassessment forecast TX · Resets to sale price
- Current annual tax
- $279 · $23/mo
- Projected year-2 tax
- $1,190 · $99/mo
- Expected delta
- +$911/yr (+$76/mo · 326.4%)
ⓘ Screening estimate from a state-policy table — verify with the county assessor before closing.
Climate risk First Street
- Flood 6/10 Major FEMA zone X (unshaded) · 71% chance over 30 yrs
- Wildfire 5/10 Major
- Heat 9/10 Extreme 7 d/yr ≥111°F today · 20 d/yr by 30 yrs out
- Wind 8/10 Severe 99% chance of damaging wind over 30 yrs
- Air quality 1/10 Low 0 unhealthy d/yr today · 0 by 30 yrs out
Nearby sold comps map
Loading sold comps map…
Walkable amenities ~0.75 mi
Loading nearby amenities…
Taxation est. · year 1
- Rental income
- $13,021
- − Mortgage interest
- −$3,641
- − Property taxes
- −$279
- − Insurance
- −$325
- − Repairs & maintenance
- −$1,042
- − Management
- −$1,042
- − HOA
- −$96
- − Depreciation
- −$1,891
- Taxable income
- $4,706
- Est. tax owed @ 24.0%
- −$1,129
- After-tax cash flow
- $4,367/yr
For passive investors: Depreciation is non-cash, so a rental often shows a tax loss while cash-flowing — sheltering income. Rental losses are passive: they offset passive income freely, and up to $25,000/yr can offset ordinary (W-2) income if you actively participate and your MAGI is under $100k (phasing out to $0 by $150k); unused losses carry forward. On sale, claimed depreciation is recaptured at up to 25%, and gains may owe capital-gains tax (a 1031 exchange can defer both). Figures are a year-1 estimate at your 24.0% rate — not tax advice; consult a CPA.
Schools (NCES district)
- District
- La Feria ISD
- NCES district ID
- 4826040
- Math proficiency
- 27% ▼ -25.00%
- Reading proficiency
- 35% ▼ -4.00%
- Median HH income
- $33,306
- Composite
- 25.41/100
- National rank
- #7460
- State rank
- #630 of 826 in TX
Livability — La Feria
- Score
- 65/100
- State rank
- #667
- US rank
- #12330
Category grades
Schools grade is shown separately in the Schools card above.
Census & demographics
- Census place
- La Feria, TX
- Population (ZIP)
- 12,752
Population outlook (Cameron County) Hauer SSP2
- Today (2025)
- 441,603 people
- By 2030
- 448,113 · +1.5%
- By 2040
- 456,385 · +3.3%
- By 2050
- 456,294 · +3.3%
- By 2075
- 423,851 · -4.0%
- By 2100
- 342,787 · -22.4%
Race, ethnicity, and origin ACS 2023
- Neighborhood character
- Predominantly Hispanic (91%)
- Race & ethnicity
- Hispanic / Latino 91% Two or more races 35% White 8%
- Hispanic origin (detail)
- Mexican 87%
- Common ancestry
- Slovak 1% Lithuanian 1%
- Foreign-born
- 17% · Canada
- Languages at home
- 40% English-only · Spanish 60%
Political lean MEDSL · Cameron
- 2024 margin
- Lean R (+5.8) · D 46.7% · R 52.5%
- 2008→2024 swing
- -34.6pp toward R · 2008: 28.8pp · 2024: -5.8pp
- All cycles
- 2024: R+5.8 2020: D+13.2 2016: D+32.5 2012: D+32.4 2008: D+28.8
Not yet ingested
- Civics
- —
Market trends
- HPI YoY
- ▼ -12.21%
- Current HPI
- 187.8512
- Rent YoY
- —
- Metro
- —
- State GDP YoY
- ▲ 3.95%
- F500 in state
- 110
Industry mix (Fortune 500 HQ in TX)
| Industry | F500 HQs | Revenue |
|---|---|---|
| Energy | 16 | $1,198B |
|
||
| Technology | 5 | $198B |
|
||
| Engineering / Construction | 4 | $72B |
|
||
| Energy Services | 3 | $60B |
|
||
| Utilities | 3 | $41B |
|
||
| Healthcare | 2 | $330B |
|
||
Price history
1 event — show timeline
- 2026-03-06 Listed $65,000 MCALLENMLS
Property tax history
-5.6%/yrLatest (2019): $279 · -1.0% YoY. Source: county tax records.
Cash-flow waterfall
monthlySold comps — $/sqft
last 12 mo · ≤1 miLoading sold comps…