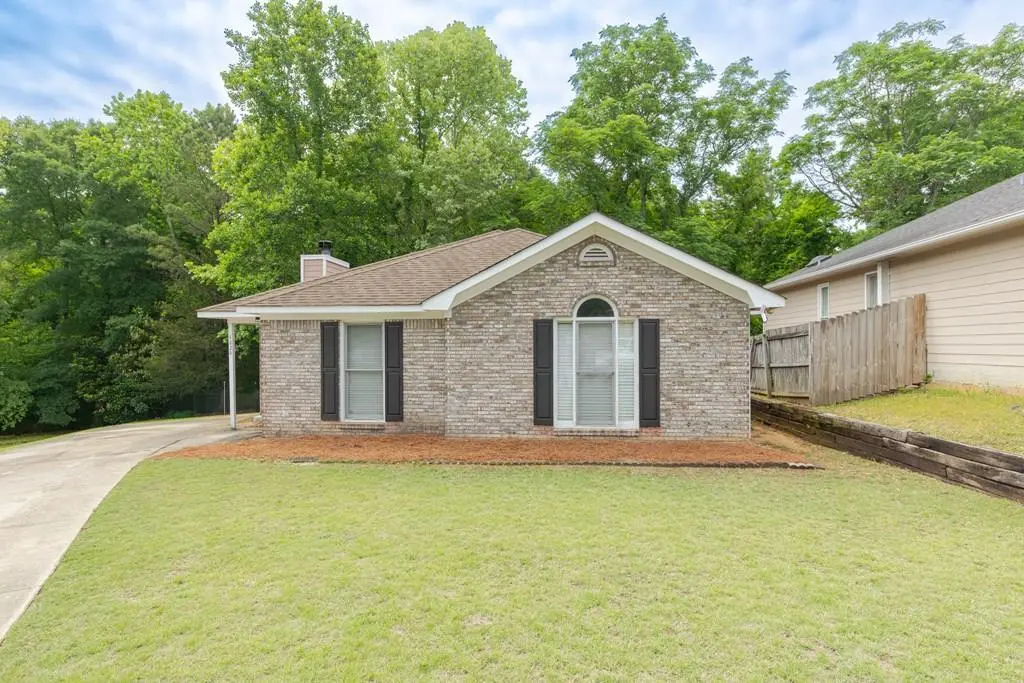
4824 Sterling Dr · Columbus, GA
Flood risk No data
- FEMA flood zone
- —
- Chance of flooding over 30 yrs
- —
- Est. flood insurance / yr
- —
Fire risk No data
- Est. fire insurance / yr
- —
Heat risk No data
- Hot days now (above threshold)
- —
- Hot days in 30 yrs
- —
Wind risk No data
- Chance of severe wind over 30 yrs
- —
Air-quality risk No data
- Unhealthy air days now
- —
- Unhealthy air days in 30 yrs
- —
Risk factors via First Street. Map © Google.
Why this score? — see what drove the D grade
The composite is a weighted blend of 9 inputs, each scored 0–100. Each bar is that input's sub-score; the figure is the points it added to the 100-point composite (weight × sub-score).
- Cash flow +14.9/30.0
- ARV discount +7.2/15.0
- DSCR +4.6/10.0
- 1% rule +3.2/10.0
- Rent growth +3.2/5.0
- Livability +3.2/5.0
- Condition / age +2.5/5.0
- Schools +2.2/10.0
- Appreciation +0.0/10.0
$193,000
🖨 Deal sheet (PDF) 📄 Offer letter ✓ Due diligence
Listing remarks
Welcome home to 4824 Sterling Drive in Columbus, situated in a cul-de-sac. This 3-bedroom, 2-bath home features an open, split-bedroom floor plan designed for comfort and functionality. The living area offers vaulted ceilings and a fireplace, creating a bright and inviting space that flows into the dining and kitchen areas. The primary suite includes a walk-in closet, double vanity, and a spa-style tub with separate shower, providing a comfortable retreat. Step outside to enjoy the back deck, a firepit for outdoor gatherings, and an additional storage shed for added convenience. Conveniently located near shopping, dining, and major roadways.
Key facts
- Double vanity
- Walk-in closet
- Cul-de-sac
Tags
Property features AI
Finance
- Other: Located in the STERLING RIDGE subdivision; Zoning: SFR4; Directions: From I-185 take Exit 6 (Macon Road/GA-22), head west on Macon Road ~2–3 miles, right on Reese Road for ~1 mile, then left on Sterling Drive.
Exterior
- Security: Smoke detector(s)
- Utilities: Public water; Public sewer
- Home design: Single-family residence; Residential property
- Construction: Brick and vinyl siding exterior
- Exterior features: Deck; Storm door(s); Located on a cul-de-sac
Interior
- Kitchen: Dishwasher; Electric range
- Bathrooms: 2 full bathrooms
- Heating & cooling: Electric heating; Ceiling fan(s); Central cooling
- Interior features: Breakfast bar; Walk-in closet(s); Living room fireplace
- Laundry & utility: Laundry room
Neighborhood map
What this means for you Summary
Snapshot
- This is a 3-bed/2.0-bath single-family listed at $193k.
Deal economics
- At list price, monthly cash flow is $57 ($684/yr) — positive.
- The deal already cash-flows at list — no discount required.
- To meet the 1% rule (rent ≥ 1% of price), the offer needs to be $159k (17.5% below list).
- Recommended offer: $159k (17.5% below list) — sets the bar for 1% rule.
- Cap rate 6.6% vs local median 4.7% in Columbus — top-decile yield for the area; either an underpriced asset or a hidden risk that comps aren't pricing in. Stress-test before assuming the spread holds.
Location & tenants
- Location reads 64/100 on livability (#254 in GA) — a middle-class / working-renter tenant base. Strengths: cost of living A+, housing A+, health & safety B; Watch: amenities D+, crime F, commute F.
- Muscogee County (urban): math 21% / reading 30% proficiency, ranked #120 of 174 in GA (top 69%) — low school quality limits family demand, transient renter base, plan for 1-2y turnover; 61% free/reduced lunch — lower-income household profile, screen leases tightly.
- Zoned schools: Eagle Ridge Academy (math 38% / reading 47%, grade F, #374 of 1,228 statewide, top 31%, 659 students, 47% FRL); Midland Middle School (math 13% / reading 26%, grade F, #356 of 470 statewide, top 78%, 441 students, 97% FRL); Shaw High School (math 12% / reading 5%, grade F, #376 of 424 statewide, top 89%, 1,234 students, 97% FRL) — zoned schools average 80% FRL vs 61% district-wide (19 pts higher); higher-poverty schools than district average — tighter screening recommended.
- Market conditions: Rents rising (+2.8%/yr); 163 active listings in the ZIP; 16 comparable units currently listed for rent nearby; rentals lingering (median 46d on market — plan ~5-8 weeks vacancy on turnover, expect pricing pressure); 50% of comp listings sitting > 30 days — soft ceiling on asking rent; 291 units permitted in Muscogee County in 2024 (30 in 5+ unit buildings).
Forward outlook
- Local home prices are declining (-3.0%/yr); year-one equity from $1k of loan paydown is wiped out by about $6k of value loss. Plan a longer hold.
- Muscogee County population projected at +15% by 2050 — modest demand growth; plan on rents tracking national, not racing it.
Negotiation context
- Only 3 days on market — expect competitive offers; lowballing is unlikely to land.
- 2 sale attempts since 8y ago with the ask held roughly flat each time — persistent listings suggest the price (not the market) is what's stuck; bring a comps-based counter.
Questions for the listing agent
- Is there a deadline driving the sale (1031 exchange, divorce, estate, relocation)? That informs how much negotiation room exists.
- Schools are F-rated, which usually means shorter tenancies and higher turnover. Who's the typical renter profile here, and what's been the actual vacancy rate?
- Crime grade is F in this area — have there been break-ins, vandalism, or insurance claims at this property in the last 3 years? What carrier currently insures it and at what premium?
- The area grade is low — what's the realistic commute time and amenity access for the typical tenant pool here? Any planned neighborhood developments (good or bad) we should know about?
- What's the average days-on-market for RENTAL listings here right now (not sales)? A rising rental-DOM trend means longer vacancies and softer asking-rent achievability than the comps imply.
- What's the recent tenant-quality profile in this submarket — average credit score on applications, eviction rate, late-payment / NSF rate, and stable-employment percentage? A property-management company in the area should have these aggregated.
- How much new for-sale + rental construction is in the pipeline within 1–3 miles? Heavy new supply typically softens prices + rents 12–24 months out; constrained supply supports both.
Investment metrics
- 1% rule
- 0.82% ✗
- Cap rate
- 6.65%
- Cash-on-cash
- 1.27%
- DSCR
- 1.06
- GRM
- 10.1
CMA / ARV
- ARV (median comp)
- $191,528
- List price
- $193,000
- Delta
- 0.77%
- Verdict
- FAIR
- Comps
- 20 within 1.0 mi
Show comp detail 12 sales within ~0.75 mi
| Address | Dist | Beds/Ba | Sqft | Sold | Price | $/sf | Match |
|---|---|---|---|---|---|---|---|
| 4824 Sterling Dr | 0.00mi | 3/2.0 | 1,418 (0%) | 1mo | $190,000 | $134 | 99 |
| 4814 Sterling Dr | 0.03mi | 3/2.0 | 1,319 (-7%) | 2mo | $142,000 | $108 | 86 |
| 4706 Warm Springs Rd | 0.42mi | 3/1.0 | 1,420 (+0%) | 2mo | $65,000 | $46 | 75 |
| 4017 Shade Valley Dr | 0.48mi | 3/2.0 | 1,408 (-1%) | 3mo | $243,500 | $173 | 74 |
| 6068 Bear Creek Ct | 0.46mi | 3/2.5 | 1,423 (+0%) | 3mo | $200,000 | $141 | 73 |
| 5824 Bishop Dr | 0.47mi | 3/2.0 | 1,384 (-2%) | 3mo | $179,000 | $129 | 71 |
| 4027 Shade Valley Dr | 0.53mi | 3/2.0 | 1,394 (-2%) | 2mo | $254,000 | $182 | 71 |
| 5240 Spinnaker Ct | 0.41mi | 3/2.0 | 1,266 (-11%) | 2mo | $200,000 | $158 | 61 |
| 5918 Fornof Rd | 0.52mi | 4/2.0 (+1) | 1,578 (+11%) | 0mo | $225,000 | $143 | 51 |
| 5829 Dearborn Ave | 0.73mi | 3/2.0 | 1,260 (-11%) | 1mo | $215,500 | $171 | 47 |
| 4437 Ansley Ave | 0.73mi | 3/2.0 | 1,589 (+12%) | 1mo | $219,900 | $138 | 45 |
| 5943 Cecil Ave | 0.71mi | 3/1.0 | 1,243 (-12%) | 1mo | $148,900 | $120 | 42 |
Match score weights: distance 35% · size 25% · config 20% · recency 20%. Top-matched comps best support the ARV.
Projected returns pro-forma
-3.0% appreciation · 2.78% rent growth · sell at horizon
- IRR
- -14.5%
- Equity multiple
- 0.48×
- Total profit
- $-28,051
- Equity at exit
- $28,777
- IRR
- -6.2%
- Equity multiple
- 0.60×
- Total profit
- $-21,420
- Equity at exit
- $16,687
Cash invested: $54,040 (down + closing). Projections, not guarantees.
Landlord ↔ Tenant lean methodology
- Overall (STATE)
- 90 Strongly Landlord-Friendly
- State Georgia
- 90 Strongly Landlord-Friendly · R+3
- County
- — inherits STATE
- City
- — inherits STATE
ZIP-level market 31909
- Rents YoY
- 2.8%
- Active inventory
- 163
- Price-to-rent
- 10.1×
Monthly cashflow live
- Estimated rent
- $1,592 high interval (Pro) →
- Mortgage (P&I)
- −$1,012
- Tax from tax record
- −$108 /mo · $1,299/yr
- Insurance
- −$80
- HOA
- −$0
- Vacancy / Maint / Mgmt
- −$334
- Net cashflow
- $57
Break-even live
Sensitivity live
| Price | -10% $166 | -5% $112 | +0% $57 | +5% $2 | +10% $-52 |
|---|---|---|---|---|---|
| Rent | -10% $-69 | -5% $-6 | +0% $57 | +5% $120 | +10% $183 |
| Rate | -1.0pp $154 | -0.5pp $106 | base $57 | +0.5pp $7 | +1.0pp $-44 |
UW: 25.0% down · 7.5% · 30yr · 1.5% tax · 5.0% vac · 8.0% maint · 8.0% mgmt
Financing live
Cash to close
- Down payment
- $48,250
- Closing costs
- $5,790
- Reserves months
- —
- Total cash needed
- —
Loan-product check · same deal, 3 products live
Conventional
25% down · 7.5% · 30yr
- Down + closing
- —
- Monthly P&I
- —
- Monthly cashflow
- —
- DSCR
- —
- Eligible?
- —
Personal DTI + credit; lowest rate.
DSCR
20% down · 8.5% · 30yr
- Down + closing
- —
- Monthly P&I
- —
- Monthly cashflow
- —
- DSCR
- —
- Eligible?
- —
No personal income docs; deal must DSCR.
Hard money
10% down · 12.0% · 12mo
- Down + closing
- —
- Monthly P&I
- —
- Monthly cashflow
- —
- DSCR
- —
- Eligible?
- —
Short-term bridge; refi at stabilization.
Rent comps 16 comps
| Address | Beds | Baths | Sqft | Rent | $/sqft | DOM | Units | Dist |
|---|---|---|---|---|---|---|---|---|
| 4845 Burt Mar Dr Unit G1 Columbus, GA | 2.0 | 2.0 | 1060 | $805 | $0.76 | 45d | 1 | 0.84mi |
| 5577 Terrace Pointe Ct Columbus, GA | 3.0 | 2.0 | 1667 | $1,850 | $1.11 | 22d | 1 | 0.87mi |
| 4343 Warm Springs Rd Columbus, GA | 2.0–3.0 | 2.0 | 1242 | $1,535 | $1.24 | 15d | 10 | 0.92mi |
| 4560 Nan Leah Ln Columbus, GA | 3.0 | 2.0 | 1342 | $1,600 | $1.19 | 45d | 1 | 0.94mi |
| 5941 Reed Ave Columbus, GA | 3.0 | 2.0 | 1280 | $1,550 | $1.21 | 45d | 1 | 0.94mi |
| 4120 Canady St Columbus, GA | 3.0 | 2.0 | 1854 | $1,725 | $0.93 | 45d | 1 | 0.98mi |
| 6009 N Pointe Dr Columbus, GA | 4.0 | 2.0 | 1733 | $1,650 | $0.95 | 45d | 1 | 1.05mi |
| 6418 Charter Oaks Cir Columbus, GA | 3.0 | 2.0 | 1450 | $1,550 | $1.07 | 15d | 1 | 1.07mi |
| 4444 Ritch Haven Rd Columbus, GA | 3.0 | 2.0 | 1621 | $1,500 | $0.93 | 22d | 1 | 1.10mi |
| 30 Sugar Mill Ct Columbus, GA | 3.0 | 2.0 | 1322 | $1,750 | $1.32 | 45d | 1 | 1.14mi |
| 4518 Randall Dr Columbus, GA | 3.0 | 2.0 | 1348 | $1,500 | $1.11 | 45d | 1 | 1.19mi |
| 6625 Charter Oaks Cir Columbus, GA | 3.0 | 2.0 | 1509 | $1,850 | $1.23 | 22d | 1 | 1.28mi |
| 6320 Olde Towne Dr Columbus, GA | 3.0 | 2.5 | 1500 | $1,150 | $0.77 | 15d | 1 | 1.39mi |
| 6515 Thea Ln Columbus, GA | 1.0–2.0 | 1.0–2.0 | 999 | $1,220 | $1.22 | 15d | 19 | 1.45mi |
| 5415 Eugenia Ave Columbus, GA | 3.0 | 1.0 | 964 | $1,200 | $1.24 | 45d | 1 | 1.45mi |
| 4221 Bonnie Dr Columbus, GA | 3.0 | 2.0 | 1700 | $1,750 | $1.03 | 22d | 1 | 1.47mi |
Listing history 4 events
-
2026-05-07status Pending 649-char remark
-
2026-05-03$193,000 Active 649-char remark
-
2018-08-15soldstatus $115,900
-
2018-06-26$115,900
ⓘ Source: listings_history table (triggers on properties + properties_extension) + one-shot
backfill from property_details.listing_events for pre-trigger history.
Tax reassessment forecast GA · Resets to sale price
- Current annual tax
- $1,299 · $108/mo
- Projected year-2 tax
- $1,776 · $148/mo
- Expected delta
- +$477/yr (+$40/mo · 36.7%)
ⓘ Screening estimate from a state-policy table — verify with the county assessor before closing.
Nearby sold comps map
Loading sold comps map…
Walkable amenities ~0.75 mi
Loading nearby amenities…
Taxation est. · year 1
- Rental income
- $19,106
- − Mortgage interest
- −$10,811
- − Property taxes
- −$1,299
- − Insurance
- −$965
- − Repairs & maintenance
- −$1,528
- − Management
- −$1,528
- − Depreciation
- −$5,615
- Taxable loss
- −$2,640
- Est. tax savings @ 24.0%
- +$634
- After-tax cash flow
- $1,318/yr
For passive investors: Depreciation is non-cash, so a rental often shows a tax loss while cash-flowing — sheltering income. Rental losses are passive: they offset passive income freely, and up to $25,000/yr can offset ordinary (W-2) income if you actively participate and your MAGI is under $100k (phasing out to $0 by $150k); unused losses carry forward. On sale, claimed depreciation is recaptured at up to 25%, and gains may owe capital-gains tax (a 1031 exchange can defer both). Figures are a year-1 estimate at your 24.0% rate — not tax advice; consult a CPA.
Schools (NCES district)
- District
- Muscogee County
- NCES district ID
- 1303870
- Math proficiency
- 21% ▼ -11.00%
- Reading proficiency
- 30% ▼ -7.00%
- Median HH income
- $41,176
- Composite
- 21.6/100
- National rank
- #8297
- State rank
- #120 of 174 in GA
Livability — Columbus
- Score
- 64/100
- State rank
- #254
- US rank
- #14102
Category grades
Schools grade is shown separately in the Schools card above.
Census & demographics
- Census place
- Columbus, GA
- County
- Muscogee County · 180,764 people
- City population
- 180,764
- Metro
- Columbus, GA-AL
- Population (ZIP)
- 39,364
- Household income
- $69,166
- Rent vs Own
- Severe rent burden
- 1819.0
Population outlook (Muscogee County) Hauer SSP2
- Today (2025)
- 216,729 people
- By 2030
- 224,504 · +3.6%
- By 2040
- 238,318 · +10.0%
- By 2050
- 249,027 · +14.9%
- By 2075
- 264,862 · +22.2%
- By 2100
- 254,786 · +17.6%
Race, ethnicity, and origin ACS 2023
- Neighborhood character
- Diverse neighborhood (Simpson 0.64)
- Race & ethnicity
- White 53% Black 24% Hispanic / Latino 12% Two or more races 9% Asian 4%
- Hispanic origin (detail)
- Mexican 3% Puerto Rican 4% Dominican 1%
- Common ancestry
- Italian 3% Serbian 2% Lithuanian 2%
- Foreign-born
- 8% · Canada, Vietnam, Jamaica
- Languages at home
- 89% English-only · Spanish 7% Other Indo-European 2% Other Asian/Pacific 1%
Political lean MEDSL · Muscogee
- 2024 margin
- Strong D (+23.4) · D 61.4% · R 38.0%
- 2008→2024 swing
- +3.7pp toward D · 2008: 19.7pp · 2024: 23.4pp
- All cycles
- 2024: D+23.4 2020: D+24.0 2016: D+18.6 2012: D+21.3 2008: D+19.7
Not yet ingested
- Civics
- —
Market trends
- HPI YoY
- ▼ -146.90%
- Current HPI
- 203.1499
- Rent YoY
- ▲ 2.78%
- Metro
- Columbus, GA-AL
- State GDP YoY
- ▲ 2.66%
- F500 in state
- 28
Industry mix (Fortune 500 HQ in GA)
| Industry | F500 HQs | Revenue |
|---|---|---|
| Paper / Packaging | 2 | $29B |
|
||
| Retail | 1 | $160B |
|
||
| Transportation / Logistics | 1 | $91B |
|
||
| Airlines | 1 | $62B |
|
||
| Consumer Goods | 1 | $47B |
|
||
| Utilities | 1 | $25B |
|
||
Price history
+63.9% since first listed6 events — show timeline
- 2026-06-02 Sold (Public Records) $190,000 Public Records
- 2026-05-27 Sold (MLS) $190,000 CBOR
- 2026-05-07 Pending — CBOR
- 2026-05-03 Listed $193,000 CBOR
- 2018-08-15 Sold (Public Records) $115,900 Public Records
- 2018-06-26 Listed $115,900 CBOR
Property tax history
+3.5%/yrLatest (2025): $1,299 · +0.1% YoY. Source: county tax records.
Cash-flow waterfall
monthlySold comps — $/sqft
last 12 mo · ≤1 miLoading sold comps…