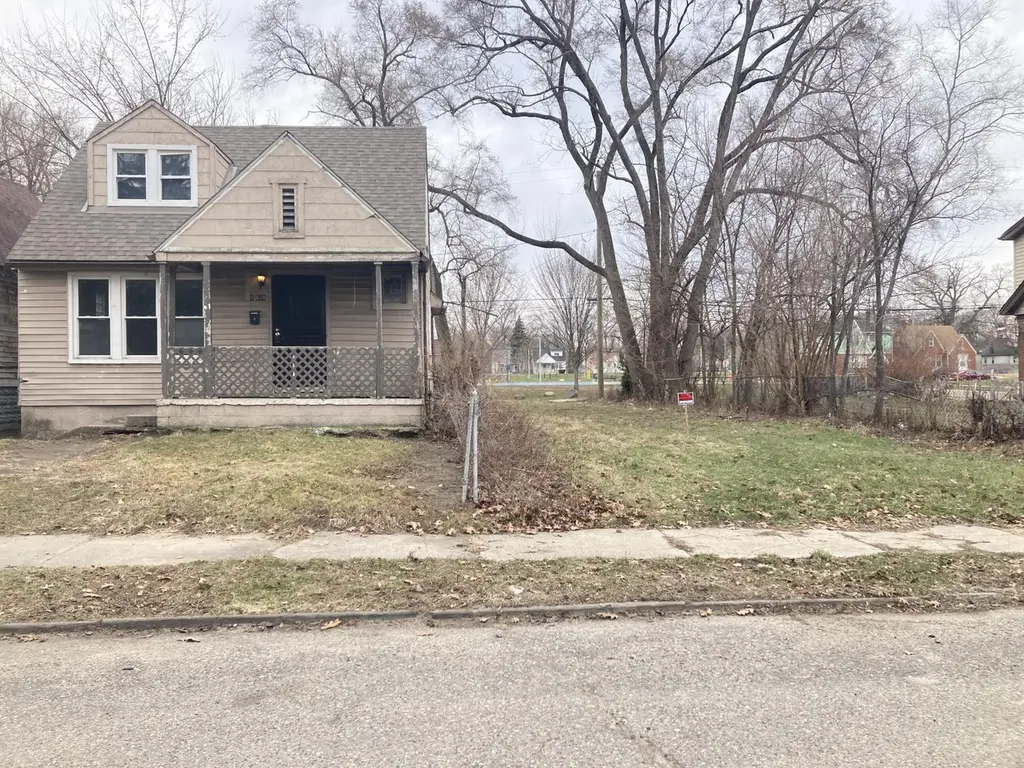
16639 Monica St · Detroit, MI
Flood risk 1/10 · Minimal
- FEMA flood zone
- X (unshaded)
- Chance of flooding over 30 yrs
- 0.0%
- Est. flood insurance / yr
- $473 – $860
Fire risk 1/10 · Minimal
- Est. fire insurance / yr
- $784 – $1,456
Heat risk 3/10 · Minor
- Hot days now (above 97°F)
- 7 days/yr
- Hot days in 30 yrs
- 15 days/yr
Wind risk 2/10 · Minimal
- Chance of severe wind over 30 yrs
- —
Air-quality risk 4/10 · Minor
- Unhealthy air days now
- 4 days/yr
- Unhealthy air days in 30 yrs
- 6 days/yr
Risk factors via First Street. Map © Google.
Why this score? — see what drove the B- grade
The composite is a weighted blend of 9 inputs, each scored 0–100. Each bar is that input's sub-score; the figure is the points it added to the 100-point composite (weight × sub-score).
- Cash flow +30.0/30.0
- DSCR +10.0/10.0
- 1% rule +8.7/10.0
- ARV discount +7.7/15.0
- Livability +3.7/5.0
- Rent growth +3.4/5.0
- Condition / age +2.5/5.0
- Schools +1.3/10.0
- Appreciation +0.0/10.0
$109,900
🖨 Deal sheet 📄 Offer letter ✓ Due diligence
Listing remarks MLS
CASH, CONVENTIONAL OR LAND CONTRACT TERMS are Available. MUST COME INSIDE TO APPRECIATE THIS 4 BEDROOM COMPLETELY REMODELED BUNGALOW. OWNER IS READY TO SALE! Yes it is Move in Ready, Completely Painted inside & Out with New Flooring throughout, New Kitchen & Bath, LR and Formal Dinning. This one has 2 Nice Size Bedrooms on the main Level and 2 Upstairs with Walkin Closets outside each Bedroom. Also, has Large Open Basement. So get your Bags Packed, it is Ready. Lots of Renovation taking place with Parks & Transportation in Walking distance. Contact City of Detroit for lot purchase next door. Home next door reportedly to be Rehabbed by Horatio Williams Foundation
Key facts
- New bath
- New kitchen
- Walkin closets
Tags
Property features AI
Exterior
- Utilities: Public water
- Home design: Single-family residence; Residential property; Built in 1926
- Construction: Vinyl siding construction
- Exterior features: Vinyl siding; Lot of about 0.08 acres; Public water
Interior
- Bathrooms: One full bathroom
- Heating & cooling: Forced air heating
- Interior features: Eight total rooms; Full basement
Neighborhood map
What this means for you Summary
Snapshot
- This is a 4-bed/1.0-bath single-family listed at $110k.
Deal economics
- At list price, monthly cash flow is $503 ($6k/yr) — positive.
- The deal already cash-flows at list — no discount required.
- Meets the 1% rule at list price ($2k rent vs $110k).
- Recommended offer: $108k (1.5% below list) — sets the bar for market timing.
Location & tenants
- Location reads 73/100 on livability (#218 in MI) — a middle-class / working-renter tenant base. Strengths: amenities A+, commute A+, cost of living A+; Watch: schools F, crime F, employment F.
- Detroit Public Schools Community District (urban): math 10% / reading 24% proficiency, ranked #499 of 540 in MI (top 92%) — low school quality limits family demand, transient renter base, plan for 1-2y turnover; 90% free/reduced lunch — lower-income household profile, screen leases tightly.
- Market conditions: Rents rising (+3.4%/yr); 349 active listings in the ZIP; 23 comparable units currently listed for rent nearby; rentals at typical pace (median 18d on market — plan ~3-4 weeks tenant-placement turnaround); 2,639 units permitted in Wayne County in 2024 (1,216 in 5+ unit buildings).
- This rent runs 31% of the median local income ($58k/yr) — at the standard rent-burdened threshold; future hikes will face affordability resistance.
Forward outlook
- Local home prices are declining (-3.0%/yr); year-one equity from $760 of loan paydown is wiped out by about $3k of value loss. Plan a longer hold.
- Wayne County population projected at -17% by 2050 — secular population decline; favor cash flow + early exit over multi-decade hold.
- At projected returns (-3.0% appreciation + 3.4% rent growth), your $31k cash investment doubles in ~7 years — after that, you're playing with house money.
Negotiation context
- It's been on market 27 days — a 2% lower offer ($108k) is reasonable based on typical stale-listing flexibility.
- 11 sale attempts since 31y ago with the ask held roughly flat each time — persistent listings suggest the price (not the market) is what's stuck; bring a comps-based counter.
Risks & watch-outs
- Watch-outs: built in 1926 — expect roof / HVAC / electrical / plumbing capex.
Questions for the listing agent
- Built in 1926 — when were the roof, HVAC, electrical panel, plumbing, and water heater last replaced?
- Is there a deadline driving the sale (1031 exchange, divorce, estate, relocation)? That informs how much negotiation room exists.
- Schools are F-rated, which usually means shorter tenancies and higher turnover. Who's the typical renter profile here, and what's been the actual vacancy rate?
- Crime grade is F in this area — have there been break-ins, vandalism, or insurance claims at this property in the last 3 years? What carrier currently insures it and at what premium?
- What's the average days-on-market for RENTAL listings here right now (not sales)? A rising rental-DOM trend means longer vacancies and softer asking-rent achievability than the comps imply.
- What's the recent tenant-quality profile in this submarket — average credit score on applications, eviction rate, late-payment / NSF rate, and stable-employment percentage? A property-management company in the area should have these aggregated.
- How much new for-sale + rental construction is in the pipeline within 1–3 miles? Heavy new supply typically softens prices + rents 12–24 months out; constrained supply supports both.
Investment metrics
- 1% rule
- 1.37% ✓
- Cap rate
- 11.79%
- Cash-on-cash
- 19.62%
- DSCR
- 1.87
- GRM
- 6.1
CMA / ARV
- ARV (median comp)
- $110,290
- List price
- $109,900
- Delta
- -0.35%
- Verdict
- FAIR
- Comps
- 4 within 1.0 mi
Show comp detail 12 sales within ~0.75 mi
| Address | Dist | Beds/Ba | Sqft | Sold | Price | $/sf | Match |
|---|---|---|---|---|---|---|---|
| 16665 Tuller St | 0.21mi | 3/1.0 (-1) | 960 (-6%) | 1mo | $25,000 | $26 | 75 |
| 16519 Monica St | 0.12mi | 3/2.0 (-1) | 1,000 (-2%) | 10mo | $165,000 | $165 | 74 |
| 15853 Santa Rosa Dr | 0.42mi | 4/1.0 | 1,050 (+3%) | 2mo | $140,000 | $133 | 74 |
| 16212 Turner St | 0.30mi | 3/1.0 (-1) | 1,080 (+6%) | 12mo | $4,500 | $4 | 61 |
| 16177 Turner St | 0.34mi | 4/2.0 | 1,118 (+10%) | 8mo | $55,000 | $49 | 57 |
| 15775 Tuller St | 0.51mi | 4/2.5 | 1,004 (-2%) | 16mo | $50,000 | $50 | 54 |
| 16135 Monica St | 0.27mi | 3/2.0 (-1) | 1,139 (+12%) | 11mo | $159,900 | $140 | 50 |
| 15822 Quincy St | 0.53mi | 3/1.0 (-1) | 1,080 (+6%) | 15mo | $30,000 | $28 | 48 |
| 15745 Holmur St | 0.60mi | 3/1.0 (-1) | 1,070 (+5%) | 13mo | $25,000 | $23 | 48 |
| 15863 Belden St | 0.58mi | 3/1.0 (-1) | 1,156 (+13%) | 1mo | $18,600 | $16 | 45 |
| 16765 Turner St | 0.28mi | 3/3.0 (-1) | 1,173 (+15%) | 9mo | $165,000 | $141 | 41 |
| 16128 Wisconsin St | 0.69mi | 3/1.0 (-1) | 1,128 (+11%) | 8mo | $75,000 | $66 | 39 |
Match score weights: distance 35% · size 25% · config 20% · recency 20%. Top-matched comps best support the ARV.
Projected returns pro-forma
-3.0% appreciation · 3.44% rent growth · sell at horizon
- IRR
- 12.1%
- Equity multiple
- 1.48×
- Total profit
- $14,889
- Equity at exit
- $16,386
- IRR
- 21.4%
- Equity multiple
- 2.85×
- Total profit
- $56,917
- Equity at exit
- $9,502
Cash invested: $30,772 (down + closing). Projections, not guarantees.
Landlord ↔ Tenant lean methodology
- Overall (STATE)
- 62 Landlord-Friendly
- State Michigan
- 62 Landlord-Friendly · EVEN
- County
- — inherits STATE
- City
- — inherits STATE
ZIP-level market 48221
- Rents YoY
- 3.4%
- Active inventory
- 349
- Price-to-rent
- 6.1×
Monthly cashflow live
- Estimated rent
- $1,506 high interval (Pro) →
- Mortgage (P&I)
- −$576
- Tax from tax record
- −$64 /mo · $774/yr
- Insurance
- −$46
- HOA
- −$0
- Vacancy / Maint / Mgmt
- −$316
- Net cashflow
- $503
Break-even live
UW: 25.0% down · 7.5% · 30yr · 1.5% tax · 5.0% vac · 8.0% maint · 8.0% mgmt
Financing live
Cash to close
- Down payment
- $27,475
- Closing costs
- $3,297
- Reserves months
- —
- Total cash needed
- —
Loan-product check · same deal, 3 products live
Conventional
25% down · 7.5% · 30yr
- Down + closing
- —
- Monthly P&I
- —
- Monthly cashflow
- —
- DSCR
- —
- Eligible?
- —
Personal DTI + credit; lowest rate.
DSCR
20% down · 8.5% · 30yr
- Down + closing
- —
- Monthly P&I
- —
- Monthly cashflow
- —
- DSCR
- —
- Eligible?
- —
No personal income docs; deal must DSCR.
Hard money
10% down · 12.0% · 12mo
- Down + closing
- —
- Monthly P&I
- —
- Monthly cashflow
- —
- DSCR
- —
- Eligible?
- —
Short-term bridge; refi at stabilization.
Rent comps 23 comps
| Address | Beds | Baths | Sqft | Rent | $/sqft | DOM | Units | Dist |
|---|---|---|---|---|---|---|---|---|
| 16582 Santa Rosa Dr Detroit, MI | 3.0 | 1.0 | 1314 | $1,399 | $1.06 | 17d | 1 | 0.08mi |
| 16255 Lilac St Detroit, MI | 3.0 | 1.0 | 1312 | $1,394 | $1.06 | 17d | 1 | 0.21mi |
| 16722 Tuller St Detroit, MI | 3.0 | 1.5 | 1100 | $1,500 | $1.36 | 17d | 1 | 0.22mi |
| 17145 Santa Rosa Dr Unit 1 Detroit, MI | 3.0 | 1.0 | 1050 | $1,400 | $1.33 | 18d | 1 | 0.27mi |
| 17163 Prairie St Unit 1B Detroit, MI | 3.0 | 1.5 | 1317 | $1,350 | $1.03 | 44d | 1 | 0.29mi |
| 7350 Globe St Detroit, MI | 3.0 | 1.0 | 1000 | $1,550 | $1.55 | 4d | 1 | 0.49mi |
| 17368 Woodingham Dr Detroit, MI | 3.0 | 1.5 | 1200 | $1,800 | $1.50 | 44d | 1 | 0.51mi |
| 16183 Wisconsin St Detroit, MI | 3.0 | 1.5 | 1370 | $1,400 | $1.02 | 44d | 1 | 0.70mi |
| 15457 Cloverlawn St Detroit, MI | 3.0 | 2.0 | 1500 | $1,275 | $0.85 | 24d | 1 | 0.75mi |
| 15906 Alden St Detroit, MI | 3.0 | 1.0 | 1030 | $1,150 | $1.12 | 17d | 1 | 0.76mi |
| 16889 Washburn St Detroit, MI | 3.0 | 1.5 | 1300 | $1,100 | $0.85 | 17d | 1 | 0.91mi |
| 15345 Parkside St Detroit, MI | 3.0 | 1.0 | 1152 | $1,300 | $1.13 | 44d | 1 | 0.96mi |
| 15708 Birwood St Detroit, MI | 3.0 | 1.0 | 1255 | $1,100 | $0.88 | 5d | 1 | 1.15mi |
| 14656 Roselawn St Detroit, MI | 3.0 | 1.0 | 1000 | $1,200 | $1.20 | 17d | 1 | 1.19mi |
| 17540 Pinehurst St Detroit, MI | 3.0 | 1.0 | 1200 | $1,395 | $1.16 | 44d | 1 | 1.26mi |
| 14550 Northlawn St Detroit, MI | 3.0 | 2.0 | 950 | $1,200 | $1.26 | 17d | 1 | 1.32mi |
| 14570 Cherrylawn St Detroit, MI | 3.0 | 1.0 | 840 | $1,250 | $1.49 | 13d | 1 | 1.32mi |
| 18935 Indiana St Detroit, MI | 3.0 | 1.0 | 1248 | $1,523 | $1.22 | 5d | 1 | 1.35mi |
| Ohio St Unit 4 Detroit, MI | 4.0 | 1.5 | 1400 | $750 | $0.54 | 44d | 1 | 1.41mi |
| 3040 Kendall St Detroit, MI | 5.0 | 1.0 | 1188 | $1,386 | $1.17 | 13d | 1 | 1.42mi |
| 16204 Steel St Detroit, MI | 3.0 | 1.0 | 969 | $1,150 | $1.19 | 44d | 1 | 1.43mi |
| 14881 Mendota St Detroit, MI | 3.0 | 1.0 | 1026 | $1,100 | $1.07 | 24d | 1 | 1.50mi |
| 326 Eason St Highland Park, MI | 3.0 | 1.0 | 1256 | $1,300 | $1.04 | 17d | 1 | 1.50mi |
Listing history 33 events
-
2026-06-17status $109,900 Pending 27 DOM
Show marketing remark (688 chars)
CASH, CONVENTIONAL OR LAND CONTRACT TERMS are Available. MUST COME INSIDE TO APPRECIATE THIS 4 BEDROOM COMPLETELY REMODELED BUNGALOW. OWNER IS READY TO SALE! Yes it is Move in Ready, Completely Painted inside & Out with New Flooring throughout, New Kitchen & Bath, LR and Formal Dinning. This one has 2 Nice Size Bedrooms on the main Level and 2 Upstairs with Walkin Closets outside each Bedroom. Also, has Large Open Basement. So get your Bags Packed, it is Ready. Lots of Renovation taking place with Parks & Transportation in Walking distance. Contact City of Detroit for lot purchase next door. Home next door reportedly to be Rehabbed by Horatio Williams Foundation
-
2026-06-17days on market $109,900 Active 27 DOM
Show marketing remark (688 chars)
CASH, CONVENTIONAL OR LAND CONTRACT TERMS are Available. MUST COME INSIDE TO APPRECIATE THIS 4 BEDROOM COMPLETELY REMODELED BUNGALOW. OWNER IS READY TO SALE! Yes it is Move in Ready, Completely Painted inside & Out with New Flooring throughout, New Kitchen & Bath, LR and Formal Dinning. This one has 2 Nice Size Bedrooms on the main Level and 2 Upstairs with Walkin Closets outside each Bedroom. Also, has Large Open Basement. So get your Bags Packed, it is Ready. Lots of Renovation taking place with Parks & Transportation in Walking distance. Contact City of Detroit for lot purchase next door. Home next door reportedly to be Rehabbed by Horatio Williams Foundation
-
2026-06-15days on market $109,900 Active 25 DOM
-
2026-06-13days on market $109,900 Active 23 DOM
-
2026-06-13days on market $109,900 Active 22 DOM
-
2026-06-09days on market $109,900 Active 19 DOM
-
2026-06-08days on market $109,900 Active 18 DOM
-
2026-06-07days on market $109,900 Active 17 DOM
-
2026-06-04days on market $109,900 Active 14 DOM
-
2026-06-03days on market $109,900 Active 13 DOM
-
2026-06-02days on market $109,900 Active 12 DOM
-
2026-06-01days on market $109,900 Active 11 DOM
-
2026-05-31days on market $109,900 Active 10 DOM
-
2026-04-23price $109,900 824-char remark
-
2026-04-23price $109,900 825-char remark
-
2026-04-23price $109,900
-
2026-03-23$119,900 Active 825-char remark
-
2026-03-23$119,900 Active 824-char remark
-
2026-03-23$119,900 Active
-
2026-03-22historical $119,900 824-char remark
-
2026-03-22historical $119,900
-
2006-03-31soldstatus $12,500
-
2005-11-30$12,900
-
2005-11-21historical
-
2005-05-24$50,000
-
2004-02-18historical
-
2003-08-18$70,000
-
2000-08-31historical
-
2000-02-29$35,000
-
2000-02-06historical
-
1999-10-06$30,000
-
1996-06-28historical
-
1995-12-28$10,000
ⓘ Source: listings_history table (triggers on properties + properties_extension) + one-shot
backfill from property_details.listing_events for pre-trigger history.
Tax reassessment forecast MI · Partial reset (capped growth)
- Current annual tax
- $774 · $64/mo
- Projected year-2 tax
- $1,233 · $103/mo
- Expected delta
- +$459/yr (+$38/mo · 59.4%)
ⓘ Screening estimate from a state-policy table — verify with the county assessor before closing.
Climate risk First Street
- Flood 1/10 Low FEMA zone X (unshaded) · 0% chance over 30 yrs
- Wildfire 1/10 Low
- Heat 3/10 Moderate 7 d/yr ≥97°F today · 15 d/yr by 30 yrs out
- Wind 2/10 Low
- Air quality 4/10 Moderate 4 unhealthy d/yr today · 6 by 30 yrs out
Nearby sold comps map
Loading sold comps map…
Walkable amenities ~0.75 mi
Loading nearby amenities…
Taxation est. · year 1
- Rental income
- $18,073
- − Mortgage interest
- −$6,156
- − Property taxes
- −$774
- − Insurance
- −$550
- − Repairs & maintenance
- −$1,446
- − Management
- −$1,446
- − Depreciation
- −$3,197
- Taxable income
- $4,505
- Est. tax owed @ 24.0%
- −$1,081
- After-tax cash flow
- $4,957/yr
For passive investors: Depreciation is non-cash, so a rental often shows a tax loss while cash-flowing — sheltering income. Rental losses are passive: they offset passive income freely, and up to $25,000/yr can offset ordinary (W-2) income if you actively participate and your MAGI is under $100k (phasing out to $0 by $150k); unused losses carry forward. On sale, claimed depreciation is recaptured at up to 25%, and gains may owe capital-gains tax (a 1031 exchange can defer both). Figures are a year-1 estimate at your 24.0% rate — not tax advice; consult a CPA.
Schools (NCES district)
- District
- Detroit Public Schools Community District
- NCES district ID
- 2601103
- Math proficiency
- 10% ▼ -2.00%
- Reading proficiency
- 24% ▲ 6.00%
- Median HH income
- $25,815
- Composite
- 13.06/100
- National rank
- #9564
- State rank
- #499 of 540 in MI
Livability — Detroit
- Score
- 73/100
- State rank
- #218
- US rank
- #5427
Category grades
Schools grade is shown separately in the Schools card above.
Census & demographics
- Census place
- Detroit, MI
- County
- Wayne County · 1,562,939 people
- City population
- 572,865
- Metro
- Detroit-Warren-Dearborn, MI
- Population (ZIP)
- 41,392
- Household income
- $57,878
- Rent vs Own
- Severe rent burden
- 1646.0
Population outlook (Wayne County) Hauer SSP2
- Today (2025)
- 1,675,273 people
- By 2030
- 1,620,300 · -3.3%
- By 2040
- 1,502,341 · -10.3%
- By 2050
- 1,384,039 · -17.4%
- By 2075
- 1,124,592 · -32.9%
- By 2100
- 881,193 · -47.4%
Race, ethnicity, and origin ACS 2023
- Neighborhood character
- Predominantly Black (85%)
- Race & ethnicity
- Black 85% White 8% Two or more races 4% Asian 1%
- Common ancestry
- Romanian 1% Lithuanian 1%
- Foreign-born
- 2% · Canada
- Languages at home
- 97% English-only · Spanish 1% Other Indo-European 1%
Political lean MEDSL · Wayne
- 2024 margin
- Strong D (+29.0) · D 62.7% · R 33.7% · Other 3.6%
- 2008→2024 swing
- -20.5pp toward R · 2008: 49.5pp · 2024: 29.0pp
- All cycles
- 2024: D+29.0 2020: D+38.1 2016: D+37.3 2012: D+46.9 2008: D+49.5
Not yet ingested
- Civics
- —
Market trends
- HPI YoY
- ▼ -433.14%
- Current HPI
- 280.5434
- Rent YoY
- ▲ 3.44%
- Metro
- Detroit-Warren-Dearborn, MI
- State GDP YoY
- ▲ 1.37%
- F500 in state
- 28
Industry mix (Fortune 500 HQ in MI)
| Industry | F500 HQs | Revenue |
|---|---|---|
| Automotive Parts | 3 | $48B |
|
||
| Automotive | 2 | $372B |
|
||
| Chemicals | 1 | $45B |
|
||
| Automotive Retail | 1 | $29B |
|
||
| Healthcare / Medical Devices | 1 | $23B |
|
||
| Automotive Technology | 1 | $20B |
|
||
Price history
+979.0% since first listed29 events — show timeline
- 2026-06-18 Sold (MLS) $107,900 MiRealSource-MiMLS
- 2026-06-18 Sold (MLS) $107,900 REALCOMP
- 2026-06-18 Sold (MLS) $107,900 SW Michigan MLS
- 2026-06-17 Pending — MiRealSource-MiMLS
- 2026-06-17 Pending — REALCOMP
- 2026-06-17 Pending — SW Michigan MLS
- 2026-05-21 Listing Removed — MiRealSource-MiMLS
- 2026-05-21 Listed $109,900 MiRealSource-MiMLS
- 2026-05-21 Listed $109,900 REALCOMP
- 2026-05-21 Listed $109,900 SW Michigan MLS
- 2026-05-20 Listing Removed — REALCOMP
- 2026-04-23 Price Changed $109,900 MiRealSource-MiMLS
- 2026-04-23 Price Changed $109,900 REALCOMP
- 2026-04-23 Price Changed $109,900 SW Michigan MLS
- 2026-03-23 Listed $119,900 REALCOMP
- 2026-03-23 Listed $119,900 MiRealSource-MiMLS
- 2026-03-22 Coming Soon — MiRealSource-MiMLS
- 2006-03-31 Sold (MLS) $12,500 REALCOMP
- 2005-11-30 Listed $12,900 REALCOMP
- 2005-11-21 Listing Removed — REALCOMP
- 2005-05-24 Listed $50,000 REALCOMP
- 2004-02-18 Listing Removed — REALCOMP
- 2003-08-18 Listed $70,000 REALCOMP
- 2000-08-31 Listing Removed — REALCOMP
- 2000-02-29 Listed $35,000 REALCOMP
- 2000-02-06 Listing Removed — REALCOMP
- 1999-10-06 Listed $30,000 REALCOMP
- 1996-06-28 Listing Removed — REALCOMP
- 1995-12-28 Listed $10,000 REALCOMP
Property tax history
+9.5%/yrLatest (2025): $774 · -36.2% YoY. Source: county tax records.
Cash-flow waterfall
monthlySold comps — $/sqft
last 12 mo · ≤1 miLoading sold comps…