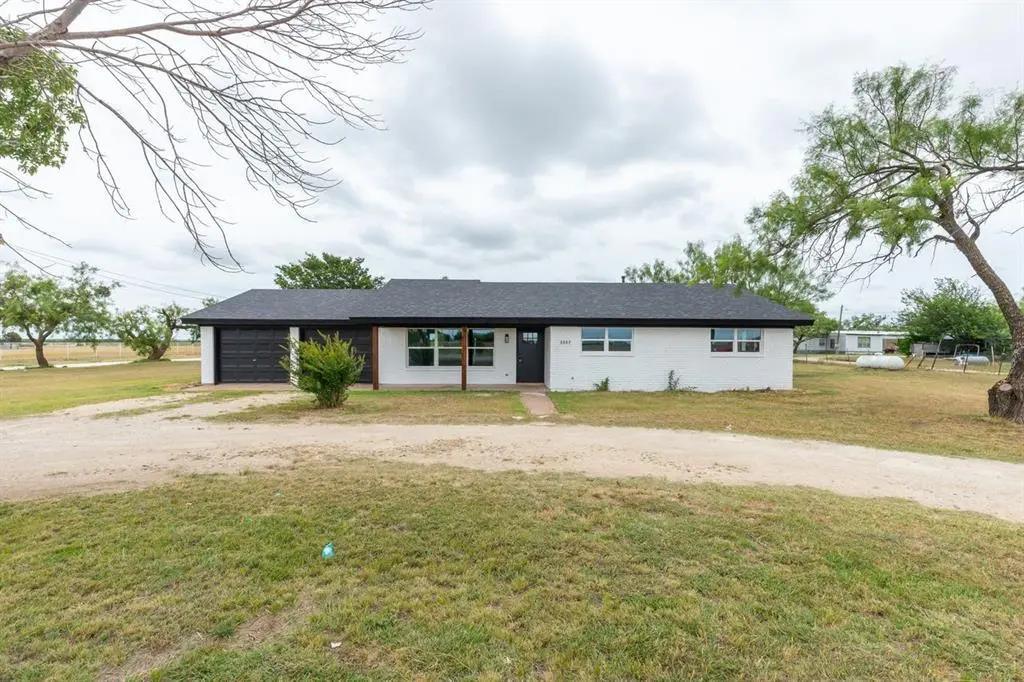
3557 Fm 1750 · Abilene, TX
Flood risk 1/10 · Minimal
- FEMA flood zone
- X (unshaded)
- Chance of flooding over 30 yrs
- 0.0%
- Est. flood insurance / yr
- $507 – $1,088
Fire risk 8/10 · Major
- Est. fire insurance / yr
- $1,222 – $2,270
Heat risk 7/10 · Major
- Hot days now (above 103°F)
- 7 days/yr
- Hot days in 30 yrs
- 23 days/yr
Wind risk 4/10 · Minor
- Chance of severe wind over 30 yrs
- 15.0%
Air-quality risk 1/10 · Minimal
- Unhealthy air days now
- 0 days/yr
- Unhealthy air days in 30 yrs
- 0 days/yr
Risk factors via First Street. Map © Google.
Why this score? — see what drove the D grade
The composite is a weighted blend of 9 inputs, each scored 0–100. Each bar is that input's sub-score; the figure is the points it added to the 100-point composite (weight × sub-score).
- Cash flow +16.7/30.0
- Schools +5.6/10.0
- DSCR +5.2/10.0
- Rent growth +5.0/5.0
- 1% rule +4.1/10.0
- Livability +3.8/5.0
- Condition / age +2.5/5.0
- ARV discount +0.0/15.0
- Appreciation +0.0/10.0
$310,000
🖨 Deal sheet (PDF) 📄 Offer letter ✓ Due diligence
Listing remarks MLS
0.70 acre lot with a 1,424 SF traditional ranch style 3 bedroom, 2 bathroom house in Wylie ISD. The house needs work but is priced reasonably for either an owner occupant to renovate or an investor flip. The house currently sits on 2.5 acres, but the owner would prefer to sell roughly 0.70 acres and replat to keep the remaining acreage. Additional acreage is negotiable.
Key facts
- Half acre
- Remodeled kitchen
- Corner lot
Tags
Property features AI
Finance
- Other: Located in a municipal utility district
- Financial info: Accepts Cash, Conventional, FHA, and VA financing; Treated as clear loan type; No second mortgage
- HOA & community: No association
Exterior
- Parking: Attached garage with 2 covered spaces
- Utilities: City water; City sewer; Electricity available; Individual gas meter; Cable available
- Home design: Single-family residence; One story
- Construction: Built in 1965; Composition roof; Slab foundation
- Exterior features: Half-acre lot (approximately 0.5 acre); Will not subdivide: No; Subdivision: Lunatic Asylum Lands Sec 7
Interior
- Kitchen: Dishwasher; Electric oven; Microwave; Refrigerator
- Bedrooms: 3 bedrooms (primary bedroom on level 1)
- Bathrooms: 2 full bathrooms
- Heating & cooling: Central heating (electric); Central air conditioning (electric)
- Interior features: Open floorplan; Cable TV available; High-speed internet available; One living area; One dining area; 5 total rooms
Neighborhood map
What this means for you Summary
Snapshot
- This is a 3-bed/1.5-bath single-family listed at $310k.
Deal economics
- At list price, monthly cash flow is $190 ($2k/yr) — positive.
- The deal already cash-flows at list — no discount required.
- To meet the 1% rule (rent ≥ 1% of price), the offer needs to be $283k (8.6% below list).
- Recommended offer: $283k (8.6% below list) — sets the bar for 1% rule.
Location & tenants
- Location reads 75/100 on livability (#142 in TX, #4,037 nationally) — a middle-class / working-renter tenant base. Strengths: cost of living A+, housing A+, health & safety A+; Watch: crime D, commute F.
- Wylie ISD (rural): math 63% / reading 62% proficiency, ranked #32 of 826 in TX (top 4%) — acceptable for families but not a draw, mixed tenant base, ~2y average lease; only 17% free/reduced lunch — higher-income household profile.
- Zoned schools: Wylie East El (math 58% / reading 58%, grade C+, #480 of 4,322 statewide, top 11%, 789 students, 30% FRL).
- Market conditions: Rents rising fast (+33.5%/yr); 370 active listings in the ZIP; 20 comparable units currently listed for rent nearby; rentals at typical pace (median 14d on market — plan ~3-4 weeks tenant-placement turnaround); solid renter incomes; 508 units permitted in Taylor County in 2024 (0 in 5+ unit buildings).
- This rent runs 38% of the median local income ($90k/yr) — at the standard rent-burdened threshold; future hikes will face affordability resistance.
Forward outlook
- Local home prices are declining (-3.0%/yr); year-one equity from $2k of loan paydown is wiped out by about $9k of value loss. Plan a longer hold.
- Taylor County population projected at +16% by 2050 — long-run rental-demand tailwind backs the buy-and-hold thesis.
Negotiation context
- Only 12 days on market — expect competitive offers; lowballing is unlikely to land.
- 3 sale attempts since 2y ago with the ask held roughly flat each time — persistent listings suggest the price (not the market) is what's stuck; bring a comps-based counter.
Risks & watch-outs
- Climate carrying-cost: severe wildfire risk; extreme-heat days projected 7→23/yr by 2055 (HVAC capex compounding) — expect insurance premiums to compound above CPI over the hold.
Questions for the listing agent
- Built in 1965 — when were the roof, HVAC, electrical panel, plumbing, and water heater last replaced?
- Is there a deadline driving the sale (1031 exchange, divorce, estate, relocation)? That informs how much negotiation room exists.
- Schools are D-rated, which usually means shorter tenancies and higher turnover. Who's the typical renter profile here, and what's been the actual vacancy rate?
- Crime grade is D in this area — have there been break-ins, vandalism, or insurance claims at this property in the last 3 years? What carrier currently insures it and at what premium?
- The area grade is low — what's the realistic commute time and amenity access for the typical tenant pool here? Any planned neighborhood developments (good or bad) we should know about?
- What's the average days-on-market for RENTAL listings here right now (not sales)? A rising rental-DOM trend means longer vacancies and softer asking-rent achievability than the comps imply.
- What's the recent tenant-quality profile in this submarket — average credit score on applications, eviction rate, late-payment / NSF rate, and stable-employment percentage? A property-management company in the area should have these aggregated.
- How much new for-sale + rental construction is in the pipeline within 1–3 miles? Heavy new supply typically softens prices + rents 12–24 months out; constrained supply supports both.
Investment metrics
- 1% rule
- 0.91% ✗
- Cap rate
- 7.03%
- Cash-on-cash
- 2.63%
- DSCR
- 1.12
- GRM
- 9.1
CMA / ARV
- ARV (on-the-fly)
- $259,168
- Comps found
- 12
Show comp detail 12 sales within ~0.75 mi
| Address | Dist | Beds/Ba | Sqft | Sold | Price | $/sf | Match |
|---|---|---|---|---|---|---|---|
| 950 Swift Water Dr | 0.42mi | 3/2.0 | 1,415 (-1%) | 1mo | $287,500 | $203 | 77 |
| 4725 Many Waters Dr | 0.37mi | 3/2.0 | 1,461 (+3%) | 3mo | $289,000 | $198 | 74 |
| 817 Swift Water Dr | 0.42mi | 3/2.0 | 1,496 (+5%) | 0mo | $289,000 | $193 | 70 |
| 818 Great Waters Dr | 0.24mi | 3/2.0 | 1,631 (+14%) | 1mo | $307,000 | $188 | 62 |
| 4910 Coyote Run | 0.39mi | 3/2.0 | 1,552 (+9%) | 5mo | $268,000 | $173 | 61 |
| 390 Lollipop Trl | 0.68mi | 3/2.0 | 1,449 (+2%) | 7mo | $260,000 | $179 | 57 |
| 5141 Yellowstone Trl | 0.37mi | 3/2.0 | 1,600 (+12%) | 4mo | $299,900 | $187 | 57 |
| 5125 Spring Creek Rd | 0.33mi | 3/2.0 | 1,604 (+13%) | 7mo | $289,900 | $181 | 56 |
| 818 Running Water Trl | 0.30mi | 4/2.0 (+1) | 1,581 (+11%) | 7mo | $275,000 | $174 | 55 |
| 841 Swift Water Dr | 0.41mi | 3/2.0 | 1,618 (+14%) | 6mo | $279,000 | $172 | 52 |
| 365 Lollipop Trl | 0.73mi | 3/2.0 | 1,595 (+12%) | 4mo | $280,000 | $176 | 40 |
| 349 Lollipop Trl | 0.75mi | 4/2.0 (+1) | 1,569 (+10%) | 1mo | $285,000 | $182 | 40 |
Match score weights: distance 35% · size 25% · config 20% · recency 20%. Top-matched comps best support the ARV.
Projected returns pro-forma
-3.0% appreciation · 8.0% rent growth · sell at horizon
- IRR
- -6.9%
- Equity multiple
- 0.73×
- Total profit
- $-23,134
- Equity at exit
- $46,222
- IRR
- 7.9%
- Equity multiple
- 1.73×
- Total profit
- $63,606
- Equity at exit
- $26,803
Cash invested: $86,800 (down + closing). Projections, not guarantees.
Landlord ↔ Tenant lean methodology
- Overall (STATE)
- 87 Strongly Landlord-Friendly
- State Texas
- 87 Strongly Landlord-Friendly · R+5
- County
- — inherits STATE
- City
- — inherits STATE
ZIP-level market 79602
- Home prices YoY
- -19.6%
- Rents YoY
- 33.5%
- Active inventory
- 370
- Price-to-rent
- 9.1×
Monthly cashflow live
- Estimated rent
- $2,835 high interval (Pro) →
- Mortgage (P&I)
- −$1,626
- Tax from tax record
- −$294 /mo · $3,531/yr
- Insurance
- −$129
- HOA
- −$0
- Vacancy / Maint / Mgmt
- −$595
- Net cashflow
- $190
Break-even live
Sensitivity live
| Price | -10% $366 | -5% $278 | +0% $190 | +5% $103 | +10% $15 |
|---|---|---|---|---|---|
| Rent | -10% $-33 | -5% $79 | +0% $190 | +5% $302 | +10% $414 |
| Rate | -1.0pp $347 | -0.5pp $269 | base $190 | +0.5pp $110 | +1.0pp $28 |
UW: 25.0% down · 7.5% · 30yr · 1.5% tax · 5.0% vac · 8.0% maint · 8.0% mgmt
Financing live
Cash to close
- Down payment
- $77,500
- Closing costs
- $9,300
- Reserves months
- —
- Total cash needed
- —
Loan-product check · same deal, 3 products live
Conventional
25% down · 7.5% · 30yr
- Down + closing
- —
- Monthly P&I
- —
- Monthly cashflow
- —
- DSCR
- —
- Eligible?
- —
Personal DTI + credit; lowest rate.
DSCR
20% down · 8.5% · 30yr
- Down + closing
- —
- Monthly P&I
- —
- Monthly cashflow
- —
- DSCR
- —
- Eligible?
- —
No personal income docs; deal must DSCR.
Hard money
10% down · 12.0% · 12mo
- Down + closing
- —
- Monthly P&I
- —
- Monthly cashflow
- —
- DSCR
- —
- Eligible?
- —
Short-term bridge; refi at stabilization.
Rent comps 20 comps
| Address | Beds | Baths | Sqft | Rent | $/sqft | DOM | Units | Dist |
|---|---|---|---|---|---|---|---|---|
| 801 Big Water Trl Abilene, TX | 3.0 | 2.0 | 1537 | $2,800 | $1.82 | 14d | 1 | 0.30mi |
| 350 Miss Ellie Ln Abilene, TX | 3.0 | 2.0 | 1414 | $2,600 | $1.84 | 8d | 1 | 0.77mi |
| 350 Miss Ellie Ln Abilene, TX | 3.0 | 2.0 | 1414 | $2,600 | $1.84 | 3d | 1 | 0.77mi |
| 1341 Briar Cliff Path Abilene, TX | 4.0 | 2.0 | 1712 | $3,100 | $1.81 | 14d | 1 | 0.88mi |
| 1342 Lewis and Clark Trl Abilene, TX | 3.0 | 2.0 | 1572 | $6,900 | $4.39 | 14d | 1 | 0.95mi |
| 349 Whiterock Dr Abilene, TX | 4.0 | 2.0 | 1809 | $6,000 | $3.32 | 18d | 1 | 0.98mi |
| 3933 Wake Forest Ln Abilene, TX | 3.0 | 2.0 | 1320 | $2,495 | $1.89 | 22d | 1 | 1.05mi |
| 3933 Wake Forest Ln Abilene, TX | 3.0 | 2.0 | 1320 | $2,495 | $1.89 | 21d | 1 | 1.05mi |
| 3926 Duke Ln Abilene, TX | 3.0 | 2.0 | 1612 | $2,250 | $1.40 | 8d | 1 | 1.09mi |
| 3873 Purdue Ln Abilene, TX | 3.0 | 1.0 | 1027 | $2,100 | $2.04 | 14d | 1 | 1.15mi |
| 7309 Wildflower Way Abilene, TX | 3.0 | 2.0 | 1578 | $3,195 | $2.02 | 25d | 1 | 1.18mi |
| 3874 Georgetown Dr Abilene, TX | 2.0 | 1.0 | 888 | $1,750 | $1.97 | 14d | 1 | 1.18mi |
| 331 Sophia Ln Abilene, TX | 3.0 | 2.0 | 1632 | $3,195 | $1.96 | 4d | 1 | 1.26mi |
| 3749 Duke Ln Abilene, TX | 2.0 | 1.0 | 925 | $1,650 | $1.78 | 8d | 1 | 1.30mi |
| 273 Martis Way Abilene, TX | 4.0 | 2.0 | 1660 | $3,200 | $1.93 | 14d | 1 | 1.34mi |
| 7319 Mountain View Rd Abilene, TX | 3.0 | 2.0 | 1502 | $4,000 | $2.66 | 44d | 1 | 1.34mi |
| 7326 Mountain View Rd Unit 7328 Abilene, TX | 3.0 | 2.0 | 1481 | $2,995 | $2.02 | 12d | 1 | 1.37mi |
| 7328 Mountain View Rd Abilene, TX | 3.0 | 2.0 | 1481 | $2,995 | $2.02 | 12d | 1 | 1.38mi |
| 3674 Radcliff Rd Abilene, TX | 3.0 | 1.5 | 1155 | $2,000 | $1.73 | 14d | 1 | 1.40mi |
| 3601 Purdue Ln Abilene, TX | 3.0 | 1.0 | 1172 | $2,150 | $1.83 | 3d | 1 | 1.49mi |
Listing history 12 events
-
2026-06-19days on market $310,000 Active 12 DOM
-
2026-06-18days on market $310,000 Active 11 DOM
-
2026-06-17days on market $310,000 Active 10 DOM
-
2026-06-17status $310,000 Active 9 DOM
-
2026-06-16days on market $310,000 Active Option Contract 9 DOM
-
2026-06-15days on market $310,000 Active Option Contract 8 DOM
-
2026-06-14days on market $310,000 Active Option Contract 6 DOM
-
2026-06-13statusdays on market $310,000 Active Option Contract 5 DOM
-
2026-06-10days on market $310,000 Active 3 DOM
-
2026-06-09days on market $310,000 Active 2 DOM
-
2026-06-08remarks 699-char remark
-
2026-06-08$310,000 Active 1 DOM
ⓘ Source: listings_history table (triggers on properties + properties_extension) + one-shot
backfill from property_details.listing_events for pre-trigger history.
Tax reassessment forecast TX · Resets to sale price
- Current annual tax
- $3,531 · $294/mo
- Projected year-2 tax
- $5,673 · $473/mo
- Expected delta
- +$2,142/yr (+$179/mo · 60.7%)
ⓘ Screening estimate from a state-policy table — verify with the county assessor before closing.
Climate risk First Street
- Flood 1/10 Low FEMA zone X (unshaded) · 0% chance over 30 yrs
- Wildfire 8/10 Severe
- Heat 7/10 Severe 7 d/yr ≥103°F today · 23 d/yr by 30 yrs out
- Wind 4/10 Moderate 15% chance of damaging wind over 30 yrs
- Air quality 1/10 Low 0 unhealthy d/yr today · 0 by 30 yrs out
Nearby sold comps map
Loading sold comps map…
Walkable amenities ~0.75 mi
Loading nearby amenities…
Taxation est. · year 1
- Rental income
- $34,018
- − Mortgage interest
- −$17,365
- − Property taxes
- −$3,531
- − Insurance
- −$1,550
- − Repairs & maintenance
- −$2,721
- − Management
- −$2,721
- − Depreciation
- −$9,018
- Taxable loss
- −$2,888
- Est. tax savings @ 24.0%
- +$693
- After-tax cash flow
- $2,979/yr
For passive investors: Depreciation is non-cash, so a rental often shows a tax loss while cash-flowing — sheltering income. Rental losses are passive: they offset passive income freely, and up to $25,000/yr can offset ordinary (W-2) income if you actively participate and your MAGI is under $100k (phasing out to $0 by $150k); unused losses carry forward. On sale, claimed depreciation is recaptured at up to 25%, and gains may owe capital-gains tax (a 1031 exchange can defer both). Figures are a year-1 estimate at your 24.0% rate — not tax advice; consult a CPA.
Schools (NCES district)
- District
- Wylie ISD
- NCES district ID
- 4846500
- Math proficiency
- 63% ▼ -12.00%
- Reading proficiency
- 62% ▼ -4.00%
- Median HH income
- $78,248
- Composite
- 55.86/100
- National rank
- #1206
- State rank
- #32 of 826 in TX
Livability — Abilene
- Score
- 75/100
- State rank
- #142
- US rank
- #4037
Category grades
Schools grade is shown separately in the Schools card above.
Census & demographics
- Census place
- Abilene, TX
- County
- Taylor County · 136,672 people
- City population
- 136,672
- Metro
- Abilene, TX
- Population (ZIP)
- 27,425
- Household income
- $89,551
- Rent vs Own
- Severe rent burden
- 338.0
Population outlook (Taylor County) Hauer SSP2
- Today (2025)
- 145,270 people
- By 2030
- 150,050 · +3.3%
- By 2040
- 159,417 · +9.7%
- By 2050
- 168,883 · +16.3%
- By 2075
- 194,436 · +33.8%
- By 2100
- 203,163 · +39.9%
Race, ethnicity, and origin ACS 2023
- Neighborhood character
- Majority White (64%)
- Race & ethnicity
- White 64% Hispanic / Latino 22% Two or more races 12% Black 10% Asian 2%
- Hispanic origin (detail)
- Mexican 19%
- Common ancestry
- Romanian 2% Italian 2% Portuguese 2%
- Foreign-born
- 6% · Canada, Vietnam, Jamaica
- Languages at home
- 87% English-only · Spanish 9% Other Asian/Pacific 1% French/Haitian/Cajun 1%
Political lean MEDSL · Taylor
- 2024 margin
- Solid R (+49.8) · D 24.6% · R 74.4% · Other 1.0%
- 2008→2024 swing
- -4.2pp toward R · 2008: -45.6pp · 2024: -49.8pp
- All cycles
- 2024: R+49.8 2020: R+45.3 2016: R+51.1 2012: R+53.6 2008: R+45.6
Not yet ingested
- Civics
- —
Market trends
- HPI YoY
- ▼ -46.04%
- Current HPI
- 189.3098
- Rent YoY
- ▲ 33.46%
- Metro
- Abilene, TX
- State GDP YoY
- ▲ 3.95%
- F500 in state
- 110
Industry mix (Fortune 500 HQ in TX)
| Industry | F500 HQs | Revenue |
|---|---|---|
| Energy | 16 | $1,198B |
|
||
| Technology | 5 | $198B |
|
||
| Engineering / Construction | 4 | $72B |
|
||
| Energy Services | 3 | $60B |
|
||
| Utilities | 3 | $41B |
|
||
| Healthcare | 2 | $330B |
|
||
Price history
+24.0% since first listed12 events — show timeline
- 2026-06-04 Listed $310,000 NTREIS
- 2025-04-17 Sold (Public Records) — Public Records
- 2025-04-16 Sold (MLS) — NTREIS
- 2025-03-23 Pending — NTREIS
- 2025-03-20 Contingent — NTREIS
- 2025-03-18 Listed $149,500 NTREIS
- 2025-03-10 Sold (Public Records) — Public Records
- 2025-03-07 Sold (MLS) — NTREIS
- 2025-01-16 Pending — NTREIS
- 2024-06-20 Price Changed $225,000 NTREIS
- 2024-01-24 Listed $250,000 NTREIS
- 2003-09-03 Sold (Public Records) — Public Records
Property tax history
+5.7%/yrLatest (2025): $3,531 · -3.7% YoY. Source: county tax records.
Cash-flow waterfall
monthlySold comps — $/sqft
last 12 mo · ≤1 miLoading sold comps…