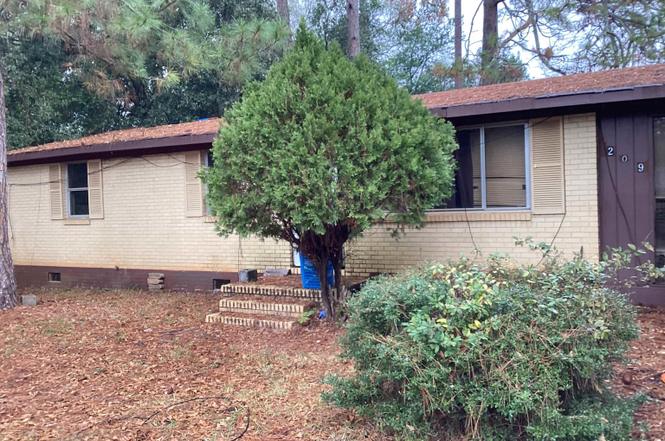
209 E Valley Dr · Fort Valley, GA
Flood risk 1/10 · Minimal
- FEMA flood zone
- X (unshaded)
- Chance of flooding over 30 yrs
- 0.0%
- Est. flood insurance / yr
- $507 – $1,088
Fire risk 4/10 · Minor
- Est. fire insurance / yr
- $963 – $1,789
Heat risk 6/10 · Moderate
- Hot days now (above 107°F)
- 7 days/yr
- Hot days in 30 yrs
- 18 days/yr
Wind risk 8/10 · Major
- Chance of severe wind over 30 yrs
- 80.0%
Air-quality risk 3/10 · Minor
- Unhealthy air days now
- 2 days/yr
- Unhealthy air days in 30 yrs
- 2 days/yr
Risk factors via First Street. Map © Google.
Why this score? — see what drove the B- grade
The composite is a weighted blend of 9 inputs, each scored 0–100. Each bar is that input's sub-score; the figure is the points it added to the 100-point composite (weight × sub-score).
- Cash flow +30.0/30.0
- 1% rule +10.0/10.0
- DSCR +10.0/10.0
- ARV discount +7.5/15.0
- Livability +3.2/5.0
- Rent growth +2.5/5.0
- Condition / age +2.5/5.0
- Schools +1.8/10.0
- Appreciation +0.0/10.0
$40,000
🖨 Deal sheet (PDF) 📄 Offer letter ✓ Due diligence
Listing remarks
Good fixer upper
Key facts
- 0.23 acre lot
- Built 1972
- Listed 3 days
Neighborhood map
What this means for you Summary
Snapshot
- This is a 3-bed/1.0-bath single-family listed at $40k.
Deal economics
- At list price, monthly cash flow is $691 ($8k/yr) — positive.
- The deal already cash-flows at list — no discount required.
- Meets the 1% rule at list price ($1k rent vs $40k).
- Cap rate 27.0% vs local median 5.5% in Fort Valley — top-decile yield for the area; either an underpriced asset or a hidden risk that comps aren't pricing in. Stress-test before assuming the spread holds.
Location & tenants
- Location reads 65/100 on livability (#220 in GA) — a middle-class / working-renter tenant base. Strengths: cost of living A+, health & safety A+, housing A-; Watch: crime D+, amenities F, commute F.
- Peach County (rural): math 17% / reading 25% proficiency, ranked #141 of 174 in GA (top 81%) — low school quality limits family demand, transient renter base, plan for 1-2y turnover; 65% free/reduced lunch — lower-income household profile, screen leases tightly.
- Zoned schools: Kay Road Elementary (math 26% / reading 30%, grade F, #673 of 1,228 statewide, top 55%, 529 students, 82% FRL); Fort Valley Middle School (math 11% / reading 19%, grade F, #397 of 470 statewide, top 85%, 481 students, 82% FRL); Peach County High School (math 3% / reading 22%, grade F, #334 of 424 statewide, top 79%, 1,107 students, 82% FRL) — zoned schools average 82% FRL vs 65% district-wide (17 pts higher); higher-poverty schools than district average — tighter screening recommended.
- Market conditions: 120 active listings in the ZIP; 11 comparable units currently listed for rent nearby; rentals at typical pace (median 15d on market — plan ~3-4 weeks tenant-placement turnaround); 149 units permitted in Peach County in 2024 (0 in 5+ unit buildings).
Forward outlook
- Local home prices are declining (-3.0%/yr); year-one equity from $277 of loan paydown is wiped out by about $1k of value loss. Plan a longer hold.
- Peach County population projected at -18% by 2050 — secular population decline; favor cash flow + early exit over multi-decade hold.
- At projected returns (-3.0% appreciation + 3.0% rent growth), your $11k cash investment doubles in ~2 years — after that, you're playing with house money.
Negotiation context
- Only 3 days on market — expect competitive offers; lowballing is unlikely to land.
Risks & watch-outs
- Climate carrying-cost: severe wind risk, 80% chance of damaging wind over 30y; extreme-heat days projected 7→18/yr by 2055 (HVAC capex compounding) — expect insurance premiums to compound above CPI over the hold.
Questions for the listing agent
- Built in 1972 — when were the roof, HVAC, electrical panel, plumbing, and water heater last replaced?
- Is there a deadline driving the sale (1031 exchange, divorce, estate, relocation)? That informs how much negotiation room exists.
- Schools are F-rated, which usually means shorter tenancies and higher turnover. Who's the typical renter profile here, and what's been the actual vacancy rate?
- Crime grade is D in this area — have there been break-ins, vandalism, or insurance claims at this property in the last 3 years? What carrier currently insures it and at what premium?
- What's the average days-on-market for RENTAL listings here right now (not sales)? A rising rental-DOM trend means longer vacancies and softer asking-rent achievability than the comps imply.
- What's the recent tenant-quality profile in this submarket — average credit score on applications, eviction rate, late-payment / NSF rate, and stable-employment percentage? A property-management company in the area should have these aggregated.
- How much new for-sale + rental construction is in the pipeline within 1–3 miles? Heavy new supply typically softens prices + rents 12–24 months out; constrained supply supports both.
Investment metrics
- 1% rule
- 3.11% ✓
- Cap rate
- 27.04%
- Cash-on-cash
- 74.09%
- DSCR
- 4.30
- GRM
- 2.7
CMA / ARV
- ARV (on-the-fly)
- $185,712
- Comps found
- 10
Show comp detail 10 sales within ~0.75 mi
| Address | Dist | Beds/Ba | Sqft | Sold | Price | $/sf | Match |
|---|---|---|---|---|---|---|---|
| 112 Plum St | 0.39mi | 3/1.0 | 1,290 (+1%) | 2mo | $70,000 | $54 | 78 |
| 325 Peach Cir | 0.15mi | 3/2.0 | 1,334 (+5%) | 8mo | $199,900 | $150 | 74 |
| 327 Peach Cir | 0.15mi | 3/2.0 | 1,334 (+5%) | 10mo | $199,900 | $150 | 72 |
| 327 Peach Cir | 0.16mi | 3/2.0 | 1,334 (+5%) | 10mo | $199,900 | $150 | 72 |
| 5241 341 Hwy | 0.14mi | 3/1.0 | 1,220 (-4%) | 23mo | $180,000 | $148 | 68 |
| 106 Peachtree Ext | 0.17mi | 3/2.0 | 1,250 (-2%) | 21mo | $182,000 | $146 | 68 |
| 313 Vienna St | 0.28mi | 3/1.5 | 1,152 (-9%) | 10mo | $120,000 | $104 | 60 |
| 208 E Love St | 0.20mi | 3/1.0 | 1,124 (-12%) | 22mo | $75,500 | $67 | 53 |
| 217 Chestnut St | 0.67mi | 3/1.0 | 1,184 (-7%) | 22mo | $46,000 | $39 | 39 |
| 305 Chestnut St | 0.73mi | 4/1.5 (+1) | 1,104 (-13%) | 3mo | $120,500 | $109 | 34 |
Match score weights: distance 35% · size 25% · config 20% · recency 20%. Top-matched comps best support the ARV.
Projected returns pro-forma
-3.0% appreciation · 3.0% rent growth · sell at horizon
- IRR
- 73.9%
- Equity multiple
- 4.36×
- Total profit
- $37,587
- Equity at exit
- $5,964
- IRR
- 77.7%
- Equity multiple
- 9.00×
- Total profit
- $89,553
- Equity at exit
- $3,458
Cash invested: $11,200 (down + closing). Projections, not guarantees.
Landlord ↔ Tenant lean methodology
- Overall (STATE)
- 90 Strongly Landlord-Friendly
- State Georgia
- 90 Strongly Landlord-Friendly · R+3
- County
- — inherits STATE
- City
- — inherits STATE
ZIP-level market 31030
- Home prices YoY
- -14.7%
- Active inventory
- 120
- Price-to-rent
- 2.7×
Monthly cashflow live
- Estimated rent
- $1,245 high interval (Pro) →
- Mortgage (P&I)
- −$210
- Tax from tax record
- −$65 /mo · $784/yr
- Insurance
- −$17
- HOA
- −$0
- Vacancy / Maint / Mgmt
- −$261
- Net cashflow
- $691
Break-even live
Sensitivity live
| Price | -10% $714 | -5% $703 | +0% $691 | +5% $680 | +10% $669 |
|---|---|---|---|---|---|
| Rent | -10% $593 | -5% $642 | +0% $691 | +5% $741 | +10% $790 |
| Rate | -1.0pp $712 | -0.5pp $702 | base $691 | +0.5pp $681 | +1.0pp $671 |
UW: 25.0% down · 7.5% · 30yr · 1.5% tax · 5.0% vac · 8.0% maint · 8.0% mgmt
Financing live
Cash to close
- Down payment
- $10,000
- Closing costs
- $1,200
- Reserves months
- —
- Total cash needed
- —
Loan-product check · same deal, 3 products live
Conventional
25% down · 7.5% · 30yr
- Down + closing
- —
- Monthly P&I
- —
- Monthly cashflow
- —
- DSCR
- —
- Eligible?
- —
Personal DTI + credit; lowest rate.
DSCR
20% down · 8.5% · 30yr
- Down + closing
- —
- Monthly P&I
- —
- Monthly cashflow
- —
- DSCR
- —
- Eligible?
- —
No personal income docs; deal must DSCR.
Hard money
10% down · 12.0% · 12mo
- Down + closing
- —
- Monthly P&I
- —
- Monthly cashflow
- —
- DSCR
- —
- Eligible?
- —
Short-term bridge; refi at stabilization.
Rent comps 11 comps
| Address | Beds | Baths | Sqft | Rent | $/sqft | DOM | Units | Dist |
|---|---|---|---|---|---|---|---|---|
| 412 Vienna Cir Fort Valley, GA | 4.0 | 2.0 | 1501 | $1,400 | $0.93 | 15d | 1 | 0.20mi |
| 313 Vienna St Fort Valley, GA | 3.0 | 2.0 | 1158 | $1,100 | $0.95 | 15d | 1 | 0.30mi |
| 305 Chestnut St Fort Valley, GA | 4.0 | 1.5 | 1104 | $1,400 | $1.27 | 22d | 1 | 0.71mi |
| 529 Railroad St Unit 4B Fort Valley, GA | 3.0 | 2.0 | 1100 | $1,095 | $1.00 | 22d | 1 | 0.85mi |
| 529 Railroad St Fort Valley, GA | 3.0 | 2.0 | 1100 | $1,095 | $1.00 | 45d | 1 | 0.85mi |
| 413 Anderson Ave Unit D3 Fort Valley, GA | 3.0 | 2.0 | 950 | $900 | $0.95 | 15d | 1 | 0.87mi |
| 417 Anderson Ave Fort Valley, GA | 3.0 | 2.0 | 950 | $925 | $0.97 | 15d | 1 | 0.89mi |
| 103 Fagan Cir Fort Valley, GA | 4.0 | 2.0 | 1010 | $1,550 | $1.53 | 15d | 1 | 1.26mi |
| 103 Ronald Pride Blvd Fort Valley, GA | 3.0 | 2.0 | 960 | $1,300 | $1.35 | 22d | 1 | 1.27mi |
| 401 Carver Dr Fort Valley, GA | 2.0 | 2.0 | 1000 | $1,450 | $1.45 | 15d | 1 | 1.28mi |
| 714 Green St Fort Valley, GA | 1.0–3.0 | 1.0–2.0 | 975 | $1,449 | $1.49 | 15d | 1 | 1.36mi |
Listing history 2 events
-
2025-12-11status Pending
-
2025-12-08$40,000 Active
ⓘ Source: listings_history table (triggers on properties + properties_extension) + one-shot
backfill from property_details.listing_events for pre-trigger history.
Tax reassessment forecast GA · Resets to sale price
- Current annual tax
- $784 · $65/mo
- Projected year-2 tax
- $784 · $65/mo
- Expected delta
- $0/yr ($0/mo · 0.0%)
ⓘ Screening estimate from a state-policy table — verify with the county assessor before closing.
Climate risk First Street
- Flood 1/10 Low FEMA zone X (unshaded) · 0% chance over 30 yrs
- Wildfire 4/10 Moderate
- Heat 6/10 Major 7 d/yr ≥107°F today · 18 d/yr by 30 yrs out
- Wind 8/10 Severe 80% chance of damaging wind over 30 yrs
- Air quality 3/10 Moderate 2 unhealthy d/yr today · 2 by 30 yrs out
Nearby sold comps map
Loading sold comps map…
Walkable amenities ~0.75 mi
Loading nearby amenities…
Taxation est. · year 1
- Rental income
- $14,935
- − Mortgage interest
- −$2,241
- − Property taxes
- −$784
- − Insurance
- −$200
- − Repairs & maintenance
- −$1,195
- − Management
- −$1,195
- − Depreciation
- −$1,164
- Taxable income
- $8,157
- Est. tax owed @ 24.0%
- −$1,958
- After-tax cash flow
- $6,340/yr
For passive investors: Depreciation is non-cash, so a rental often shows a tax loss while cash-flowing — sheltering income. Rental losses are passive: they offset passive income freely, and up to $25,000/yr can offset ordinary (W-2) income if you actively participate and your MAGI is under $100k (phasing out to $0 by $150k); unused losses carry forward. On sale, claimed depreciation is recaptured at up to 25%, and gains may owe capital-gains tax (a 1031 exchange can defer both). Figures are a year-1 estimate at your 24.0% rate — not tax advice; consult a CPA.
Schools (NCES district)
- District
- Peach County
- NCES district ID
- 1304050
- Math proficiency
- 17% ▼ -15.00%
- Reading proficiency
- 25% ▼ -5.00%
- Median HH income
- $41,348
- Composite
- 17.89/100
- National rank
- #9000
- State rank
- #141 of 174 in GA
Livability — Fort Valley
- Score
- 65/100
- State rank
- #220
- US rank
- #12957
Category grades
Schools grade is shown separately in the Schools card above.
Census & demographics
- Census place
- Fort Valley, GA
- City population
- 17,987
- Population (ZIP)
- 17,987
Population outlook (Peach County) Hauer SSP2
- Today (2025)
- 26,481 people
- By 2030
- 25,723 · -2.9%
- By 2040
- 23,812 · -10.1%
- By 2050
- 21,724 · -18.0%
- By 2075
- 17,513 · -33.9%
- By 2100
- 14,235 · -46.2%
Race, ethnicity, and origin ACS 2023
- Neighborhood character
- Diverse neighborhood (Simpson 0.62)
- Race & ethnicity
- Black 49% White 35% Hispanic / Latino 12% Two or more races 5% Native American 1%
- Hispanic origin (detail)
- Mexican 9% Cuban 2%
- Common ancestry
- Romanian 1% Italian 1% Serbian 1%
- Foreign-born
- 7% · Canada
- Languages at home
- 90% English-only · Spanish 8%
Political lean MEDSL · Peach
- 2024 margin
- Lean R (+6.0) · D 46.8% · R 52.8%
- 2008→2024 swing
- -12.8pp toward R · 2008: 6.8pp · 2024: -6.0pp
- All cycles
- 2024: R+6.0 2020: R+4.7 2016: R+3.0 2012: D+7.5 2008: D+6.8
Not yet ingested
- Civics
- —
Market trends
- HPI YoY
- ▼ -34.82%
- Current HPI
- 202.0025
- Rent YoY
- —
- Metro
- —
- State GDP YoY
- ▲ 2.66%
- F500 in state
- 28
Industry mix (Fortune 500 HQ in GA)
| Industry | F500 HQs | Revenue |
|---|---|---|
| Paper / Packaging | 2 | $29B |
|
||
| Retail | 1 | $160B |
|
||
| Transportation / Logistics | 1 | $91B |
|
||
| Airlines | 1 | $62B |
|
||
| Consumer Goods | 1 | $47B |
|
||
| Utilities | 1 | $25B |
|
||
Price history
2 events — show timeline
- 2025-12-11 Pending — CGMLS
- 2025-12-08 Listed $40,000 CGMLS
Property tax history
+0.8%/yrLatest (2025): $784 · -3.9% YoY. Source: county tax records.
Cash-flow waterfall
monthlySold comps — $/sqft
last 12 mo · ≤1 miLoading sold comps…