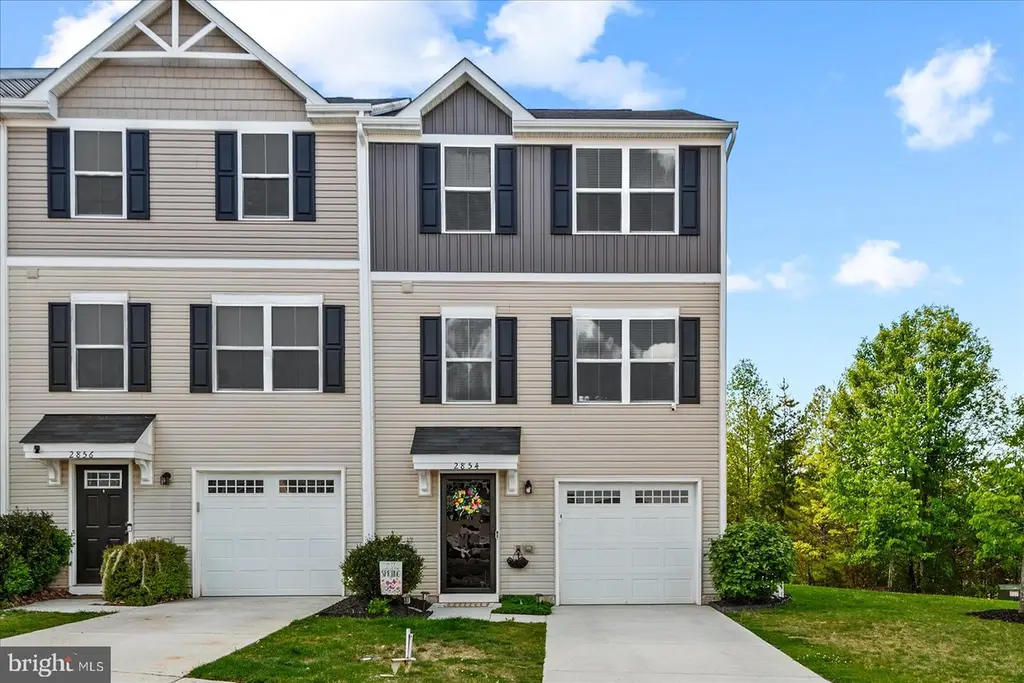
2854 Farzi Cir · Lake of the Woods, VA
Flood risk No data
- FEMA flood zone
- —
- Chance of flooding over 30 yrs
- —
- Est. flood insurance / yr
- —
Fire risk No data
- Est. fire insurance / yr
- —
Heat risk No data
- Hot days now (above threshold)
- —
- Hot days in 30 yrs
- —
Wind risk No data
- Chance of severe wind over 30 yrs
- —
Air-quality risk No data
- Unhealthy air days now
- —
- Unhealthy air days in 30 yrs
- —
Risk factors via First Street. Map © Google.
Why this score? — see what drove the F grade
The composite is a weighted blend of 9 inputs, each scored 0–100. Each bar is that input's sub-score; the figure is the points it added to the 100-point composite (weight × sub-score).
- Cash flow +11.2/30.0
- Schools +4.8/10.0
- ARV discount +4.7/15.0
- DSCR +3.3/10.0
- Livability +3.2/5.0
- Rent growth +2.5/5.0
- Condition / age +2.5/5.0
- 1% rule +2.4/10.0
- Appreciation +0.0/10.0
$339,900
🖨 Deal sheet (PDF) 📄 Offer letter ✓ Due diligence
Listing remarks
METICULOUSLY maintained END-unit townhome, offering 3 bedrooms, 2.5 baths, set on a PRIVATE, oversized lot BACKING to TREES. Upper level features SPACIOUS owner’s suite with a PRIVATE full bath, plus additional 2 bedrooms and full bath. The main level features a BRIGHT WHITE Kitchen that opens seamlessly to the dining and family rooms, creating an ideal open-concept layout. HIGHLIGHT REEL continues, ENJOY a BEAUTIFULLY designed screened-in deck with a ceiling fan and wood-accented ceiling—perfect for RELAXING or ENTERTAINING. Ideally located near everyday conveniences, including Walmart and Starbucks, offering easy access to shopping & dining. Favorite this home and s
Key facts
- Bright white kitchen
- Backing to trees
- Screened in deck
Tags
Property features AI
Finance
- HOA & community: HOA fee $44 monthly; HOA covers common area maintenance; Community has tot lots/playground
Exterior
- Parking: Attached front-entry garage (1 car)
- Utilities: Public water; Public sewer; Electric service
- Home design: End of row townhouse; Fee simple ownership
- Construction: Vinyl siding; Shingle roof; Permanent foundation; Built year source: Assessor
- Exterior features: No tidal water
Interior
- Kitchen: Built-in microwave; Dishwasher; Disposal; Refrigerator; Stove
- Bedrooms: Three bedrooms on the upper level
- Bathrooms: Two full bathrooms on the upper level; One half bathroom on the main level; Total: two full, one half
- Heating & cooling: Central heating (electric); Central air conditioning (electric); Electric hot water
- Interior features: Daylight, full basement; Built-in microwave; Dishwasher; Disposal; Refrigerator; Stove
Neighborhood map
What this means for you Summary
Snapshot
- This is a 3-bed/2.5-bath townhouse listed at $340k.
Deal economics
- At list price, monthly cash flow is $-128 ($-2k/yr) — negative.
- To cash-flow at today's rent, offer at most $317k (6.6% below list).
- To meet the 1% rule (rent ≥ 1% of price), the offer needs to be $253k (25.7% below list).
- Recommended offer: $253k (25.7% below list) — sets the bar for 1% rule.
- Cap rate 5.8% vs local median 4.3% in Lake of the Woods — top-decile yield for the area; either an underpriced asset or a hidden risk that comps aren't pricing in. Stress-test before assuming the spread holds.
Location & tenants
- Location reads 65/100 on livability (#341 in VA) — a middle-class / working-renter tenant base. Strengths: employment A+, housing A+, crime A-; Watch: cost of living C-, schools D+, amenities F.
- Orange County Public School District (rural): math 47% / reading 64% proficiency, ranked #71 of 131 in VA (top 54%) — acceptable for families but not a draw, mixed tenant base, ~2y average lease.
- Market conditions: 196 active listings in the ZIP; 3 comparable units currently listed for rent nearby; rentals at typical pace (median 21d on market — plan ~3-4 weeks tenant-placement turnaround); high-income renter base; 412 units permitted in Orange County in 2024 (0 in 5+ unit buildings).
Forward outlook
- Local home prices are declining (-3.0%/yr); year-one equity from $2k of loan paydown is wiped out by about $10k of value loss. Plan a longer hold.
- Orange County population projected at +18% by 2050 — long-run rental-demand tailwind backs the buy-and-hold thesis.
Negotiation context
- Only 5 days on market — expect competitive offers; lowballing is unlikely to land.
Questions for the listing agent
- What do current leases actually rent for vs. the listed asking? Can we see a recent rent roll and the last 12 months of T-12 income?
- What does the HOA fee cover, when was the last increase, and are there any pending special assessments or reserve-fund shortfalls?
- Is there a deadline driving the sale (1031 exchange, divorce, estate, relocation)? That informs how much negotiation room exists.
- Schools are D-rated, which usually means shorter tenancies and higher turnover. Who's the typical renter profile here, and what's been the actual vacancy rate?
- The area grade is low — what's the realistic commute time and amenity access for the typical tenant pool here? Any planned neighborhood developments (good or bad) we should know about?
- What's the average days-on-market for RENTAL listings here right now (not sales)? A rising rental-DOM trend means longer vacancies and softer asking-rent achievability than the comps imply.
- What's the recent tenant-quality profile in this submarket — average credit score on applications, eviction rate, late-payment / NSF rate, and stable-employment percentage? A property-management company in the area should have these aggregated.
- How much new for-sale + rental construction is in the pipeline within 1–3 miles? Heavy new supply typically softens prices + rents 12–24 months out; constrained supply supports both.
Investment metrics
- 1% rule
- 0.74% ✗
- Cap rate
- 5.84%
- Cash-on-cash
- -1.61%
- DSCR
- 0.93
- GRM
- 11.2
CMA / ARV
- ARV (on-the-fly)
- $319,920
- Comps found
- 8
Show comp detail 8 sales within ~0.75 mi
| Address | Dist | Beds/Ba | Sqft | Sold | Price | $/sf | Match |
|---|---|---|---|---|---|---|---|
| 2868 Farzi Cir | 0.03mi | 3/2.5 | 1,290 (0%) | 1mo | $320,000 | $248 | 98 |
| 2862 Farzi Cir | 0.01mi | 3/2.5 | 1,290 (0%) | 8mo | $315,000 | $244 | 92 |
| 2884 Farzi Cir | 0.04mi | 3/2.5 | 1,290 (0%) | 10mo | $300,000 | $233 | 90 |
| 2840 Farzi Cir | 0.02mi | 3/2.5 | 1,290 (0%) | 14mo | $325,000 | $252 | 87 |
| 35166 Sara Ct | 0.16mi | 3/2.5 | 1,290 (0%) | 10mo | $330,000 | $256 | 84 |
| 35252 Sara Ct | 0.11mi | 3/2.5 | 1,200 (-7%) | 3mo | $315,000 | $263 | 81 |
| 35205 Sara Ct | 0.09mi | 3/2.5 | 1,290 (0%) | 23mo | $315,000 | $244 | 77 |
| 35112 Somerset Ridge Rd | 0.53mi | 2/2.0 (-1) | 1,294 (+0%) | 23mo | $310,000 | $240 | 49 |
Match score weights: distance 35% · size 25% · config 20% · recency 20%. Top-matched comps best support the ARV.
Projected returns pro-forma
-3.0% appreciation · 3.0% rent growth · sell at horizon
- IRR
- -19.0%
- Equity multiple
- 0.33×
- Total profit
- $-63,322
- Equity at exit
- $50,680
- IRR
- -11.6%
- Equity multiple
- 0.31×
- Total profit
- $-66,034
- Equity at exit
- $29,388
Cash invested: $95,172 (down + closing). Projections, not guarantees.
Landlord ↔ Tenant lean methodology
- Overall (STATE)
- 55 Moderately Landlord-Leaning
- State Virginia
- 55 Moderately Landlord-Leaning · D+2
- County
- — inherits STATE
- City
- — inherits STATE
ZIP-level market 22508
- Home prices YoY
- -5.0%
- Active inventory
- 196
- Price-to-rent
- 11.2×
Monthly cashflow live
- Estimated rent
- $2,526 medium interval (Pro) →
- Mortgage (P&I)
- −$1,782
- Tax from tax record
- −$155 /mo · $1,865/yr
- Insurance
- −$142
- HOA
- −$44
- Vacancy / Maint / Mgmt
- −$530
- Net cashflow
- $-128
Break-even live
Sensitivity live
| Price | -10% $65 | -5% $-32 | +0% $-128 | +5% $-224 | +10% $-320 |
|---|---|---|---|---|---|
| Rent | -10% $-327 | -5% $-228 | +0% $-128 | +5% $-28 | +10% $72 |
| Rate | -1.0pp $43 | -0.5pp $-41 | base $-128 | +0.5pp $-216 | +1.0pp $-306 |
UW: 25.0% down · 7.5% · 30yr · 1.5% tax · 5.0% vac · 8.0% maint · 8.0% mgmt
Financing live
Cash to close
- Down payment
- $84,975
- Closing costs
- $10,197
- Reserves months
- —
- Total cash needed
- —
Loan-product check · same deal, 3 products live
Conventional
25% down · 7.5% · 30yr
- Down + closing
- —
- Monthly P&I
- —
- Monthly cashflow
- —
- DSCR
- —
- Eligible?
- —
Personal DTI + credit; lowest rate.
DSCR
20% down · 8.5% · 30yr
- Down + closing
- —
- Monthly P&I
- —
- Monthly cashflow
- —
- DSCR
- —
- Eligible?
- —
No personal income docs; deal must DSCR.
Hard money
10% down · 12.0% · 12mo
- Down + closing
- —
- Monthly P&I
- —
- Monthly cashflow
- —
- DSCR
- —
- Eligible?
- —
Short-term bridge; refi at stabilization.
Rent comps 3 comps
| Address | Beds | Baths | Sqft | Rent | $/sqft | DOM | Units | Dist |
|---|---|---|---|---|---|---|---|---|
| 35178 Sara Ct Locust Grove, VA | 3.0 | 3.5 | 1800 | $2,200 | $1.22 | 44d | 1 | 0.12mi |
| 2736 Bears Den Dr Locust Grove, VA | 3.0 | 2.5 | 1720 | $2,299 | $1.34 | 20d | 1 | 1.08mi |
| 2618 Grey Wolf Ln Locust Grove, VA | 3.0 | 2.5 | 1600 | $2,500 | $1.56 | 2d | 1 | 1.14mi |
HOA detail
- Monthly dues
- $44 · $528/yr
Listing history 2 events
-
2026-04-29status Pending
-
2026-04-24$339,900 Active
ⓘ Source: listings_history table (triggers on properties + properties_extension) + one-shot
backfill from property_details.listing_events for pre-trigger history.
Tax reassessment forecast VA · Resets to sale price
- Current annual tax
- $1,865 · $155/mo
- Projected year-2 tax
- $2,787 · $232/mo
- Expected delta
- +$922/yr (+$77/mo · 49.4%)
ⓘ Screening estimate from a state-policy table — verify with the county assessor before closing.
Nearby sold comps map
Loading sold comps map…
Walkable amenities ~0.75 mi
Loading nearby amenities…
Taxation est. · year 1
- Rental income
- $30,314
- − Mortgage interest
- −$19,040
- − Property taxes
- −$1,865
- − Insurance
- −$1,700
- − Repairs & maintenance
- −$2,425
- − Management
- −$2,425
- − HOA
- −$528
- − Depreciation
- −$9,888
- Taxable loss
- −$7,557
- Est. tax savings @ 24.0%
- +$1,814
- After-tax cash flow
- $279/yr
For passive investors: Depreciation is non-cash, so a rental often shows a tax loss while cash-flowing — sheltering income. Rental losses are passive: they offset passive income freely, and up to $25,000/yr can offset ordinary (W-2) income if you actively participate and your MAGI is under $100k (phasing out to $0 by $150k); unused losses carry forward. On sale, claimed depreciation is recaptured at up to 25%, and gains may owe capital-gains tax (a 1031 exchange can defer both). Figures are a year-1 estimate at your 24.0% rate — not tax advice; consult a CPA.
Schools (NCES district)
- District
- Orange County Public School District
- NCES district ID
- 5102820
- Math proficiency
- 47% ▼ -35.00%
- Reading proficiency
- 64% ▼ -14.00%
- Median HH income
- $61,086
- Composite
- 48.34/100
- National rank
- #2147
- State rank
- #71 of 131 in VA
Livability — Lake of the Woods
- Score
- 65/100
- State rank
- #341
- US rank
- #13456
Category grades
Schools grade is shown separately in the Schools card above.
Census & demographics
- County
- Orange County · 21,992 people
- Metro
- Washington-Arlington-Alexandria, DC-VA-MD-WV
- Population (ZIP)
- 15,557
- Household income
- $111,357
- Rent vs Own
- Severe rent burden
- 102.0
Population outlook (Orange County) Hauer SSP2
- Today (2025)
- 38,758 people
- By 2030
- 40,411 · +4.3%
- By 2040
- 43,477 · +12.2%
- By 2050
- 45,856 · +18.3%
- By 2075
- 51,067 · +31.8%
- By 2100
- 51,387 · +32.6%
Race, ethnicity, and origin ACS 2023
- Neighborhood character
- Predominantly White (73%)
- Race & ethnicity
- White 73% Two or more races 10% Hispanic / Latino 10% Black 8% Asian 2%
- Hispanic origin (detail)
- Mexican 3% Puerto Rican 2%
- Common ancestry
- Serbian 3% Romanian 3% Lithuanian 3%
- Foreign-born
- 7% · Canada, South Korea
- Languages at home
- 91% English-only · Spanish 5% French/Haitian/Cajun 2% Other Indo-European 1%
Political lean MEDSL · Orange
- 2024 margin
- Strong R (+24.7) · D 37.2% · R 61.9%
- 2008→2024 swing
- -15.8pp toward R · 2008: -8.8pp · 2024: -24.7pp
- All cycles
- 2024: R+24.7 2020: R+21.4 2016: R+26.6 2012: R+14.5 2008: R+8.8
Not yet ingested
- Civics
- —
Market trends
- HPI YoY
- ▼ -20.88%
- Current HPI
- 401.2932
- Rent YoY
- —
- Metro
- Washington-Arlington-Alexandria, DC-VA-MD-WV
- State GDP YoY
- ▲ 2.40%
- F500 in state
- 50
Industry mix (Fortune 500 HQ in VA)
| Industry | F500 HQs | Revenue |
|---|---|---|
| Aerospace / Defense | 4 | $236B |
|
||
| Technology / Defense | 3 | $32B |
|
||
| Financial Services | 2 | $176B |
|
||
| Utilities | 2 | $27B |
|
||
| Insurance | 2 | $25B |
|
||
| Technology | 2 | $15B |
|
||
Price history
2 events — show timeline
- 2026-04-29 Pending — BRIGHT MLS
- 2026-04-24 Listed $339,900 BRIGHT MLS
Property tax history
+37.5%/yrLatest (2025): $1,865 · +27.6% YoY. Source: county tax records.
Cash-flow waterfall
monthlySold comps — $/sqft
last 12 mo · ≤1 miLoading sold comps…