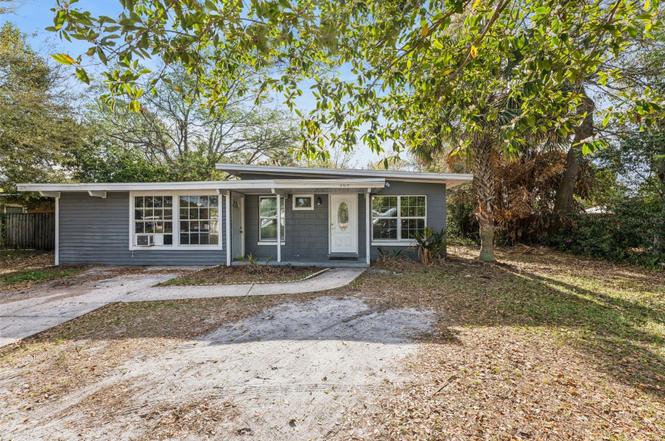
205 Oakland Ave · Sanford, FL
Flood risk 1/10 · Minimal
- FEMA flood zone
- X (unshaded)
- Chance of flooding over 30 yrs
- 0.0%
- Est. flood insurance / yr
- $507 – $1,088
Fire risk 4/10 · Minor
- Est. fire insurance / yr
- $947 – $1,759
Heat risk 9/10 · Severe
- Hot days now (above 107°F)
- 7 days/yr
- Hot days in 30 yrs
- 22 days/yr
Wind risk 9/10 · Severe
- Chance of severe wind over 30 yrs
- 99.0%
Air-quality risk 2/10 · Minimal
- Unhealthy air days now
- 1 days/yr
- Unhealthy air days in 30 yrs
- 2 days/yr
Risk factors via First Street. Map © Google.
Why this score? — see what drove the D+ grade
The composite is a weighted blend of 9 inputs, each scored 0–100. Each bar is that input's sub-score; the figure is the points it added to the 100-point composite (weight × sub-score).
- Cash flow +13.3/30.0
- ARV discount +11.3/15.0
- Schools +5.1/10.0
- DSCR +4.0/10.0
- Livability +3.7/5.0
- Rent growth +2.9/5.0
- 1% rule +2.6/10.0
- Condition / age +2.5/5.0
- Appreciation +0.0/10.0
$269,500
🖨 Deal sheet (PDF) 📄 Offer letter ✓ Due diligence
Listing remarks MLS
Great opportunity for investors. Welcome home renovated. Sold As-Is, Cash only.
Key facts
- Renovated home
- Expansion potential
- Bonus room
Tags
Property features AI
Finance
- Other: Unfurnished; Universal property ID available
- Financial info: No lease restrictions; Homestead exemption indicated
- HOA & community: No HOA/association; No association approval required
Exterior
- Parking: No parking details listed
- Security: No security features listed
- Utilities: Public water; No sewer; Public utilities
- Home design: Single family residence; One story; Faces east
- Construction: Block construction; Shingle roof; Slab foundation; Built as residential single family
- Exterior features: Paved road access; Lot approximately 0.21 acre; Park and playground nearby
Interior
- Kitchen: Refrigerator
- Bedrooms: 3 bedrooms
- Flooring: Tile
- Bathrooms: 1 full bathroom
- Heating & cooling: Central heating; Central air conditioning
- Interior features: Bonus room; No additional interior features listed
- Laundry & utility: Washer hookup; Electric dryer hookup; Gas dryer hookup; Laundry closet
Neighborhood map
What this means for you Summary
Snapshot
- This is a 3-bed/1.0-bath single-family listed at $270k.
Deal economics
- At list price, monthly cash flow is $2 ($29/yr) — positive.
- The deal already cash-flows at list — no discount required.
- To meet the 1% rule (rent ≥ 1% of price), the offer needs to be $205k (23.9% below list).
- Recommended offer: $205k (23.9% below list) — sets the bar for 1% rule.
- Cap rate 6.3% vs local median 3.6% in Sanford — top-decile yield for the area; either an underpriced asset or a hidden risk that comps aren't pricing in. Stress-test before assuming the spread holds.
Location & tenants
- Location reads 73/100 on livability (#316 in FL) — a middle-class / working-renter tenant base. Strengths: cost of living A+, housing A+, health & safety A+; Watch: employment C-, crime F, amenities F.
- Seminole (suburban): math 57% / reading 61% proficiency, ranked #13 of 73 in FL (top 18%) — acceptable for families but not a draw, mixed tenant base, ~2y average lease.
- Zoned schools: Pine Crest Elementary School (math 20% / reading 26%, grade F, #2,070 of 2,144 statewide, top 97%, 701 students, 89% FRL); Lake Mary High School (math 39% / reading 58%, grade D, #198 of 667 statewide, top 30%, 2,684 students, 42% FRL) — zoned schools average 65% FRL vs 38% district-wide (27 pts higher); higher-poverty schools than district average — tighter screening recommended.
- Zoned-school proficiency averages 36% at this address vs 59% district-wide (-23 pts) — the specific schools serving this property underperform the Seminole average; the district grade overstates school quality for this exact location.
- Market conditions: Rents rising (+1.4%/yr); 287 active listings in the ZIP; 16 comparable units currently listed for rent nearby; rentals leasing fast (median 12d on market — plan ~1-2 weeks tenant-placement turnaround); 1,979 units permitted in Seminole County in 2024 (1,191 in 5+ unit buildings).
Forward outlook
- Local home prices are declining (-3.0%/yr); year-one equity from $2k of loan paydown is wiped out by about $8k of value loss. Plan a longer hold.
- Seminole County population projected at +24% by 2050 — long-run rental-demand tailwind backs the buy-and-hold thesis.
Negotiation context
- It's been on market 95 days — a 9% lower offer ($245k) is reasonable based on typical stale-listing flexibility.
- 2 sale attempts since 9y ago with the ask held roughly flat each time — persistent listings suggest the price (not the market) is what's stuck; bring a comps-based counter.
- Current owner paid $115k; list at $270k implies a 134% gain — meaningful room to come down on a strong offer.
Risks & watch-outs
- Watch-outs: built in 1958 — expect roof / HVAC / electrical / plumbing capex.
- Climate carrying-cost: severe wind risk, 99% chance of damaging wind over 30y; extreme-heat days projected 7→22/yr by 2055 (HVAC capex compounding) — expect insurance premiums to compound above CPI over the hold.
Questions for the listing agent
- It's been on market 95 days. Have you received any prior offers? Is the seller open to a 24% concession, seller financing, or rate buy-down credit?
- Built in 1958 — when were the roof, HVAC, electrical panel, plumbing, and water heater last replaced?
- Why hasn't it sold? Are there any deal-killer items the seller is aware of (foundation, flood, title, zoning, code violations)?
- Is there a deadline driving the sale (1031 exchange, divorce, estate, relocation)? That informs how much negotiation room exists.
- Schools are B-rated — typically a magnet for longer-tenancy family renters. What's the average tenant stay here, and is there a school-zone premium baked into asking?
- Crime grade is F in this area — have there been break-ins, vandalism, or insurance claims at this property in the last 3 years? What carrier currently insures it and at what premium?
- The area grade is low — what's the realistic commute time and amenity access for the typical tenant pool here? Any planned neighborhood developments (good or bad) we should know about?
- What's the average days-on-market for RENTAL listings here right now (not sales)? A rising rental-DOM trend means longer vacancies and softer asking-rent achievability than the comps imply.
- What's the recent tenant-quality profile in this submarket — average credit score on applications, eviction rate, late-payment / NSF rate, and stable-employment percentage? A property-management company in the area should have these aggregated.
- How much new for-sale + rental construction is in the pipeline within 1–3 miles? Heavy new supply typically softens prices + rents 12–24 months out; constrained supply supports both.
Investment metrics
- 1% rule
- 0.76% ✗
- Cap rate
- 6.30%
- Cash-on-cash
- 0.04%
- DSCR
- 1.00
- GRM
- 11.0
CMA / ARV
- ARV (on-the-fly)
- $294,500
- Comps found
- 12
Show comp detail 12 sales within ~0.75 mi
| Address | Dist | Beds/Ba | Sqft | Sold | Price | $/sf | Match |
|---|---|---|---|---|---|---|---|
| 619 Mimosa Ter | 0.14mi | 3/1.0 | 1,211 (+3%) | 7mo | $270,000 | $223 | 83 |
| 617 Mimosa Ter | 0.15mi | 4/1.0 (+1) | 1,320 (+12%) | 2mo | $285,000 | $216 | 66 |
| 720 Baywood Cir | 0.43mi | 3/1.5 | 1,234 (+5%) | 5mo | $269,000 | $218 | 66 |
| 705 Cherokee Cir | 0.33mi | 3/1.0 | 1,053 (-11%) | 3mo | $270,000 | $256 | 64 |
| 732 Cherokee Cir | 0.40mi | 3/1.0 | 1,053 (-11%) | 1mo | $237,000 | $225 | 63 |
| 701 Cherokee Cir | 0.30mi | 3/2.0 | 1,040 (-12%) | 1mo | $260,000 | $250 | 62 |
| 116 Azalea Ln | 0.24mi | 3/2.0 | 1,040 (-12%) | 5mo | $285,000 | $274 | 61 |
| 4204 Rocky Ridge Pl | 0.50mi | 3/2.0 | 1,249 (+6%) | 4mo | $330,000 | $264 | 59 |
| 107 Tucker Dr | 0.20mi | 2/2.0 (-1) | 1,056 (-10%) | 6mo | $190,000 | $180 | 59 |
| 763 Osprey Nest Pt | 0.65mi | 3/2.0 | 1,136 (-4%) | 3mo | $263,000 | $232 | 58 |
| 956 Penfield Cv | 0.50mi | 3/2.0 | 1,246 (+6%) | 8mo | $335,000 | $269 | 57 |
| 182 Lakeside Dr | 0.71mi | 2/1.0 (-1) | 1,050 (-11%) | 6mo | $360,000 | $343 | 38 |
Match score weights: distance 35% · size 25% · config 20% · recency 20%. Top-matched comps best support the ARV.
Projected returns pro-forma
-3.0% appreciation · 1.45% rent growth · sell at horizon
- IRR
- -17.8%
- Equity multiple
- 0.38×
- Total profit
- $-46,784
- Equity at exit
- $40,183
- IRR
- -12.9%
- Equity multiple
- 0.29×
- Total profit
- $-53,550
- Equity at exit
- $23,301
Cash invested: $75,460 (down + closing). Projections, not guarantees.
Landlord ↔ Tenant lean methodology
- Overall (STATE)
- 87 Strongly Landlord-Friendly
- State Florida
- 87 Strongly Landlord-Friendly · R+3
- County
- — inherits STATE
- City
- — inherits STATE
ZIP-level market 32773
- Home prices YoY
- -27.8%
- Rents YoY
- 1.4%
- Active inventory
- 287
- Price-to-rent
- 11.0×
Monthly cashflow live
- Estimated rent
- $2,050 high interval (Pro) →
- Mortgage (P&I)
- −$1,413
- Tax from tax record
- −$92 /mo · $1,101/yr
- Insurance
- −$112
- HOA
- −$0
- Vacancy / Maint / Mgmt
- −$431
- Net cashflow
- $2
Break-even live
Sensitivity live
| Price | -10% $155 | -5% $79 | +0% $2 | +5% $-74 | +10% $-150 |
|---|---|---|---|---|---|
| Rent | -10% $-160 | -5% $-79 | +0% $2 | +5% $83 | +10% $164 |
| Rate | -1.0pp $138 | -0.5pp $71 | base $2 | +0.5pp $-67 | +1.0pp $-138 |
UW: 25.0% down · 7.5% · 30yr · 1.5% tax · 5.0% vac · 8.0% maint · 8.0% mgmt
Financing live
Cash to close
- Down payment
- $67,375
- Closing costs
- $8,085
- Reserves months
- —
- Total cash needed
- —
Loan-product check · same deal, 3 products live
Conventional
25% down · 7.5% · 30yr
- Down + closing
- —
- Monthly P&I
- —
- Monthly cashflow
- —
- DSCR
- —
- Eligible?
- —
Personal DTI + credit; lowest rate.
DSCR
20% down · 8.5% · 30yr
- Down + closing
- —
- Monthly P&I
- —
- Monthly cashflow
- —
- DSCR
- —
- Eligible?
- —
No personal income docs; deal must DSCR.
Hard money
10% down · 12.0% · 12mo
- Down + closing
- —
- Monthly P&I
- —
- Monthly cashflow
- —
- DSCR
- —
- Eligible?
- —
Short-term bridge; refi at stabilization.
Rent comps 16 comps
| Address | Beds | Baths | Sqft | Rent | $/sqft | DOM | Units | Dist |
|---|---|---|---|---|---|---|---|---|
| 759 Baywood Cir Sanford, FL | 4.0 | 2.0 | 1443 | $2,075 | $1.44 | 25d | 1 | 0.28mi |
| 929 Old Mail Ln Sanford, FL | 3.0 | 2.0 | 1429 | $2,225 | $1.56 | 12d | 1 | 0.43mi |
| 801 Northlake Dr #801 Sanford, FL | 2.0 | 2.0 | 912 | $1,400 | $1.54 | 25d | 1 | 0.53mi |
| 305 Northlake Dr Sanford, FL | 2.0 | 2.0 | 912 | $1,345 | $1.47 | 25d | 1 | 0.56mi |
| 166 Lakeside Dr Sanford, FL | 3.0 | 1.0 | 1250 | $2,065 | $1.65 | 6d | 1 | 0.75mi |
| 3733 Eagle Preserve Pt Sanford, FL | 2.0 | 2.5 | 1308 | $2,200 | $1.68 | 21d | 1 | 0.76mi |
| 100 Sweet Gum Ct Sanford, FL | 3.0 | 2.0 | 1315 | $1,995 | $1.52 | 6d | 1 | 0.91mi |
| 500 Fox Quarry Ln Sanford, FL | 1.0–4.0 | 1.0–3.0 | 1134 | $1,578 | $1.39 | 3d | 16 | 0.97mi |
| 120 Bent Oak Ct Sanford, FL | 3.0 | 2.0 | 1064 | $2,150 | $2.02 | 19d | 1 | 1.07mi |
| 3560 Windleshore Way Sanford, FL | 3.0 | 2.5 | 1420 | $1,795 | $1.26 | 3d | 1 | 1.18mi |
| 3360 Windleshore Way Sanford, FL | 3.0 | 2.5 | 1420 | $2,000 | $1.41 | 4d | 1 | 1.22mi |
| 3251 Windleshore Way Sanford, FL | 2.0 | 2.5 | 1056 | $1,950 | $1.85 | 12d | 1 | 1.25mi |
| 5361 Windsor Lake Cir Sanford, FL | 3.0 | 2.5 | 1420 | $1,950 | $1.37 | 6d | 1 | 1.27mi |
| 3141 Windleshore Way Sanford, FL | 2.0 | 2.5 | 1144 | $1,800 | $1.57 | 19d | 1 | 1.27mi |
| 131 Andrews Rd Sanford, FL | 3.0 | 2.0 | 1485 | $3,400 | $2.29 | 25d | 1 | 1.39mi |
| 131 Andrews Rd Sanford, FL | 3.0 | 2.0 | 1485 | $3,095 | $2.08 | 4d | 1 | 1.39mi |
Listing history 18 events
-
2026-06-17days on market $269,500 Active 95 DOM
-
2026-06-16days on market $269,500 Active 94 DOM
-
2026-06-15days on market $269,500 Active 93 DOM
-
2026-06-13days on market $269,500 Active 91 DOM
-
2026-06-09days on market $269,500 Active 87 DOM
-
2026-06-08days on market $269,500 Active 86 DOM
-
2026-06-07days on market $269,500 Active 85 DOM
-
2026-06-04days on market $269,500 Active 82 DOM
-
2026-06-03days on market $269,500 Active 81 DOM
-
2026-06-02days on market $269,500 Active 80 DOM
-
2026-06-01days on market $269,500 Active 79 DOM
-
2026-05-31days on market $269,500 Active 78 DOM
-
2026-04-09price $269,500
-
2026-03-15$280,000 Active
-
2018-01-03soldstatus $115,000
-
2017-12-22soldstatus $115,000 Sold 79-char remark
Show marketing remark (79 chars)
Great opportunity for investors. Welcome home renovated. Sold As-Is, Cash only.
-
2017-11-21status Pending 79-char remark
Show marketing remark (79 chars)
Great opportunity for investors. Welcome home renovated. Sold As-Is, Cash only.
-
2017-11-16$98,900 Active 79-char remark
Show marketing remark (79 chars)
Great opportunity for investors. Welcome home renovated. Sold As-Is, Cash only.
ⓘ Source: listings_history table (triggers on properties + properties_extension) + one-shot
backfill from property_details.listing_events for pre-trigger history.
Tax reassessment forecast FL · Resets to sale price
- Current annual tax
- $1,101 · $92/mo
- Projected year-2 tax
- $2,237 · $186/mo
- Expected delta
- +$1,136/yr (+$95/mo · 103.2%)
ⓘ Screening estimate from a state-policy table — verify with the county assessor before closing.
Climate risk First Street
- Flood 1/10 Low FEMA zone X (unshaded) · 0% chance over 30 yrs
- Wildfire 4/10 Moderate
- Heat 9/10 Extreme 7 d/yr ≥107°F today · 22 d/yr by 30 yrs out
- Wind 9/10 Extreme 99% chance of damaging wind over 30 yrs
- Air quality 2/10 Low 1 unhealthy d/yr today · 2 by 30 yrs out
Nearby sold comps map
Loading sold comps map…
Walkable amenities ~0.75 mi
Loading nearby amenities…
Taxation est. · year 1
- Rental income
- $24,604
- − Mortgage interest
- −$15,096
- − Property taxes
- −$1,101
- − Insurance
- −$1,348
- − Repairs & maintenance
- −$1,968
- − Management
- −$1,968
- − Depreciation
- −$7,840
- Taxable loss
- −$4,717
- Est. tax savings @ 24.0%
- +$1,132
- After-tax cash flow
- $1,161/yr
For passive investors: Depreciation is non-cash, so a rental often shows a tax loss while cash-flowing — sheltering income. Rental losses are passive: they offset passive income freely, and up to $25,000/yr can offset ordinary (W-2) income if you actively participate and your MAGI is under $100k (phasing out to $0 by $150k); unused losses carry forward. On sale, claimed depreciation is recaptured at up to 25%, and gains may owe capital-gains tax (a 1031 exchange can defer both). Figures are a year-1 estimate at your 24.0% rate — not tax advice; consult a CPA.
Schools (NCES district)
- District
- Seminole
- NCES district ID
- 1201710
- Math proficiency
- 57% ▼ -7.00%
- Reading proficiency
- 61% ▼ -1.00%
- Median HH income
- $58,478
- Composite
- 51.05/100
- National rank
- #1769
- State rank
- #13 of 73 in FL
Livability — Sanford
- Score
- 73/100
- State rank
- #316
- US rank
- #5359
Category grades
Schools grade is shown separately in the Schools card above.
Census & demographics
- County
- Seminole County · 436,154 people
- City population
- 96,638
- Metro
- Orlando-Kissimmee-Sanford, FL
- Population (ZIP)
- 34,032
- Household income
- $70,442
- Rent vs Own
- Severe rent burden
- 1516.0
Population outlook (Seminole County) Hauer SSP2
- Today (2025)
- 515,494 people
- By 2030
- 545,713 · +5.9%
- By 2040
- 598,068 · +16.0%
- By 2050
- 640,663 · +24.3%
- By 2075
- 724,461 · +40.5%
- By 2100
- 755,530 · +46.6%
Race, ethnicity, and origin ACS 2023
- Neighborhood character
- Highly diverse neighborhood (Simpson 0.70)
- Race & ethnicity
- White 43% Hispanic / Latino 26% Black 20% Two or more races 16% Asian 7%
- Hispanic origin (detail)
- Mexican 3% Puerto Rican 12% Cuban 2% Dominican 2%
- Common ancestry
- Romanian 2% Slovak 1% Hispanic 1%
- Foreign-born
- 17% · Canada, Vietnam, Jamaica
- Languages at home
- 72% English-only · Spanish 21% Vietnamese 3% Other Indo-European 2%
Political lean MEDSL · Seminole
- 2024 margin
- Toss-up / Even · D 47.6% · R 51.1% · Other 1.3%
- 2008→2024 swing
- -0.8pp no change · 2008: -2.8pp · 2024: -3.5pp
- All cycles
- 2024: R+3.5 2020: D+2.8 2016: R+1.6 2012: R+6.5 2008: R+2.8
Not yet ingested
- Civics
- —
Market trends
- HPI YoY
- ▼ -126.55%
- Current HPI
- 328.5485
- Rent YoY
- ▲ 1.45%
- Metro
- Orlando-Kissimmee-Sanford, FL
- State GDP YoY
- ▲ 3.28%
- F500 in state
- 36
Industry mix (Fortune 500 HQ in FL)
| Industry | F500 HQs | Revenue |
|---|---|---|
| Industrial Technology | 2 | $29B |
|
||
| Insurance | 2 | $17B |
|
||
| Retail | 1 | $60B |
|
||
| Technology Distribution | 1 | $58B |
|
||
| Homebuilding | 1 | $35B |
|
||
| Technology Manufacturing | 1 | $35B |
|
||
Price history
+172.5% since first listed6 events — show timeline
- 2026-04-09 Price Changed $269,500 Stellar MLS as Distributed by MLS Grid
- 2026-03-15 Listed $280,000 Stellar MLS as Distributed by MLS Grid
- 2018-01-03 Sold (Public Records) $115,000 Public Records
- 2017-12-22 Sold (MLS) $115,000 Stellar MLS as Distributed by MLS Grid
- 2017-11-21 Pending — Stellar MLS as Distributed by MLS Grid
- 2017-11-16 Listed $98,900 Stellar MLS as Distributed by MLS Grid
Property tax history
+6.6%/yrLatest (2025): $1,101 · -19.9% YoY. Source: county tax records.
Cash-flow waterfall
monthlySold comps — $/sqft
last 12 mo · ≤1 miLoading sold comps…