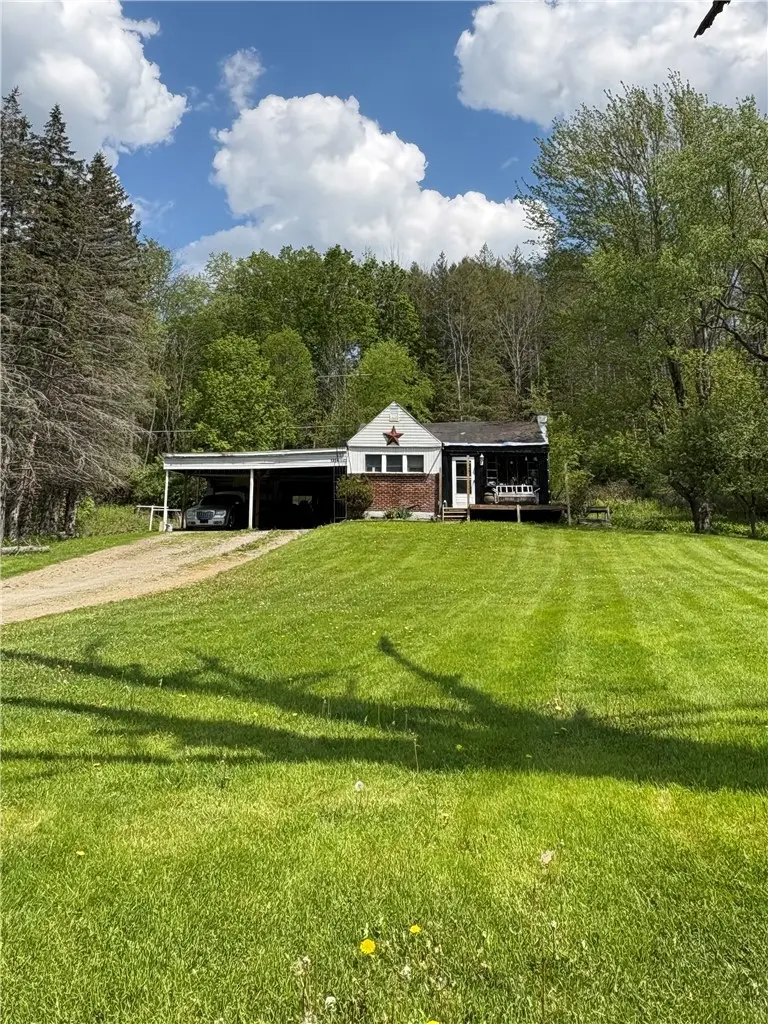
1524 Thurber Rd · South Corning, NY
Flood risk 1/10 · Minimal
- FEMA flood zone
- X
- Chance of flooding over 30 yrs
- 0.0%
- Est. flood insurance / yr
- $473 – $860
Fire risk 4/10 · Minor
- Est. fire insurance / yr
- $691 – $1,283
Heat risk 2/10 · Minimal
- Hot days now (above 92°F)
- 7 days/yr
- Hot days in 30 yrs
- 15 days/yr
Wind risk 1/10 · Minimal
- Chance of severe wind over 30 yrs
- —
Air-quality risk 1/10 · Minimal
- Unhealthy air days now
- 0 days/yr
- Unhealthy air days in 30 yrs
- 0 days/yr
Risk factors via First Street. Map © Google.
Why this score? — see what drove the B grade
The composite is a weighted blend of 9 inputs, each scored 0–100. Each bar is that input's sub-score; the figure is the points it added to the 100-point composite (weight × sub-score).
- Cash flow +30.0/30.0
- 1% rule +10.0/10.0
- DSCR +10.0/10.0
- ARV discount +7.5/15.0
- Schools +4.2/10.0
- Livability +3.8/5.0
- Rent growth +2.5/5.0
- Condition / age +2.5/5.0
- Appreciation +0.0/10.0
$87,000
🖨 Deal sheet (PDF) 📄 Offer letter ✓ Due diligence
Listing remarks
2 bedroom ranch-style cottage on nearly half an acre in Caton. New septic in 2025. Eat-in kitchen, 2 car garage and a full basement offers suitable storage. Private backyard to create your perfect outdoor oasis. Move-in and enjoy as-is or enjoy a renovation opportunity. Delayed showings until 5/23/26.
Key facts
- New septic
- Private backyard
- Full basement
Tags
Property features AI
Exterior
- Parking: Attached 2-car garage
- Utilities: Electricity available and connected (fuse panel); Septic tank; Water from spring/well
- Home design: Single-story home; Resale property
- Construction: Brick and vinyl siding exterior; Block foundation; Existing structure
- Exterior features: Open porch; Gravel driveway; Rectangular lot (approximately 0.4 acres, 143 x 271); Main thoroughfare frontage
Interior
- Kitchen: Gas oven; Gas range; Refrigerator; Eat-in kitchen
- Bedrooms: Two main-level bedrooms
- Flooring: Carpet; Vinyl; Varies
- Bathrooms: One full bathroom (main level)
- Heating & cooling: Gas forced-air heating
- Interior features: Ceiling fan(s); Den; Eat-in kitchen; Bedroom on main level; Full basement
- Laundry & utility: Washer included; Laundry in basement; Gas water heater
Neighborhood map
What this means for you Summary
Snapshot
- This is a 2-bed/1.0-bath single-family listed at $87k.
Deal economics
- At list price, monthly cash flow is $391 ($5k/yr) — positive.
- The deal already cash-flows at list — no discount required.
- Meets the 1% rule at list price ($2k rent vs $87k).
- Recommended offer: $86k (1.5% below list) — sets the bar for market timing.
Location & tenants
- Location reads 76/100 on livability (#228 in NY, #3,596 nationally) — a middle-class / working-renter tenant base. Strengths: housing A+, health & safety A+, crime A; Watch: schools D, amenities F, commute F.
- Corning City School District (town): math 44% / reading 53% proficiency, ranked #406 of 590 in NY (top 69%) — families likely to look elsewhere, expect single-tenant / working-renter base with shorter leases.
- Market conditions: 106 active listings in the ZIP; 196 units permitted in Steuben County in 2024 (0 in 5+ unit buildings).
Forward outlook
- Local home prices are declining (-3.0%/yr); year-one equity from $601 of loan paydown is wiped out by about $3k of value loss. Plan a longer hold.
- Steuben County population projected at -20% by 2050 — secular population decline; favor cash flow + early exit over multi-decade hold.
- At projected returns (-3.0% appreciation + 3.0% rent growth), your $24k cash investment doubles in ~7 years — after that, you're playing with house money.
Negotiation context
- It's been on market 17 days — a 2% lower offer ($86k) is reasonable based on typical stale-listing flexibility.
Risks & watch-outs
- Watch-outs: property tax is 4.2% of price; built in 1955 — expect roof / HVAC / electrical / plumbing capex.
Questions for the listing agent
- Built in 1955 — when were the roof, HVAC, electrical panel, plumbing, and water heater last replaced?
- Property tax is high relative to price — has the assessment been appealed recently, and will the sale trigger a re-assessment?
- Is there a deadline driving the sale (1031 exchange, divorce, estate, relocation)? That informs how much negotiation room exists.
- Schools are D-rated, which usually means shorter tenancies and higher turnover. Who's the typical renter profile here, and what's been the actual vacancy rate?
- What's the average days-on-market for RENTAL listings here right now (not sales)? A rising rental-DOM trend means longer vacancies and softer asking-rent achievability than the comps imply.
- What's the recent tenant-quality profile in this submarket — average credit score on applications, eviction rate, late-payment / NSF rate, and stable-employment percentage? A property-management company in the area should have these aggregated.
- How much new for-sale + rental construction is in the pipeline within 1–3 miles? Heavy new supply typically softens prices + rents 12–24 months out; constrained supply supports both.
Investment metrics
- 1% rule
- 1.72% ✓
- Cap rate
- 11.68%
- Cash-on-cash
- 19.26%
- DSCR
- 1.86
- GRM
- 4.8
CMA / ARV
- ARV (on-the-fly)
- $190,920
- Comps found
- 2
Show comp detail 2 sales within ~0.75 mi
| Address | Dist | Beds/Ba | Sqft | Sold | Price | $/sf | Match |
|---|---|---|---|---|---|---|---|
| 1653 Caton Rd | 0.43mi | 3/2.0 (+1) | 1,152 (+4%) | 13mo | $143,608 | $125 | 54 |
| 10940 Wolcott Rd | 0.48mi | 2/2.0 | 1,224 (+10%) | 22mo | $210,000 | $172 | 38 |
Match score weights: distance 35% · size 25% · config 20% · recency 20%. Top-matched comps best support the ARV.
Projected returns pro-forma
-3.0% appreciation · 3.0% rent growth · sell at horizon
- IRR
- 11.3%
- Equity multiple
- 1.45×
- Total profit
- $10,940
- Equity at exit
- $12,972
- IRR
- 20.4%
- Equity multiple
- 2.73×
- Total profit
- $42,158
- Equity at exit
- $7,522
Cash invested: $24,360 (down + closing). Projections, not guarantees.
Landlord ↔ Tenant lean methodology
- Overall (STATE)
- 15 Strongly Tenant-Friendly
- State New York
- 15 Strongly Tenant-Friendly · D+10
- County
- — inherits STATE
- City
- — inherits STATE
ZIP-level market 14830
- Active inventory
- 106
- Price-to-rent
- 4.8×
Monthly cashflow live
- Estimated rent
- $1,500 medium interval (Pro) →
- Mortgage (P&I)
- −$456
- Tax from tax record
- −$302 /mo · $3,619/yr
- Insurance
- −$36
- HOA
- −$0
- Vacancy / Maint / Mgmt
- −$315
- Net cashflow
- $391
Break-even live
Sensitivity live
| Price | -10% $440 | -5% $416 | +0% $391 | +5% $366 | +10% $342 |
|---|---|---|---|---|---|
| Rent | -10% $272 | -5% $332 | +0% $391 | +5% $450 | +10% $509 |
| Rate | -1.0pp $435 | -0.5pp $413 | base $391 | +0.5pp $368 | +1.0pp $345 |
UW: 25.0% down · 7.5% · 30yr · 1.5% tax · 5.0% vac · 8.0% maint · 8.0% mgmt
Financing live
Cash to close
- Down payment
- $21,750
- Closing costs
- $2,610
- Reserves months
- —
- Total cash needed
- —
Loan-product check · same deal, 3 products live
Conventional
25% down · 7.5% · 30yr
- Down + closing
- —
- Monthly P&I
- —
- Monthly cashflow
- —
- DSCR
- —
- Eligible?
- —
Personal DTI + credit; lowest rate.
DSCR
20% down · 8.5% · 30yr
- Down + closing
- —
- Monthly P&I
- —
- Monthly cashflow
- —
- DSCR
- —
- Eligible?
- —
No personal income docs; deal must DSCR.
Hard money
10% down · 12.0% · 12mo
- Down + closing
- —
- Monthly P&I
- —
- Monthly cashflow
- —
- DSCR
- —
- Eligible?
- —
Short-term bridge; refi at stabilization.
Listing history 8 events
-
2026-06-19days on market $87,000 Active 17 DOM
-
2026-06-18days on market $87,000 Active 16 DOM
-
2026-06-17days on market $87,000 Active 15 DOM
-
2026-06-16days on market $87,000 Active 14 DOM
-
2026-06-15days on market $87,000 Active 13 DOM
-
2026-06-14days on market $87,000 Active 11 DOM
-
2026-06-12statusdays on market $87,000 Active 10 DOM
-
2026-05-19$87,000 Active
ⓘ Source: listings_history table (triggers on properties + properties_extension) + one-shot
backfill from property_details.listing_events for pre-trigger history.
Tax reassessment forecast NY · Partial reset (capped growth)
- Current annual tax
- $3,619 · $302/mo
- Projected year-2 tax
- $3,619 · $302/mo
- Expected delta
- $0/yr ($0/mo · 0.0%)
ⓘ Screening estimate from a state-policy table — verify with the county assessor before closing.
Climate risk First Street
- Flood 1/10 Low FEMA zone X · 0% chance over 30 yrs
- Wildfire 4/10 Moderate
- Heat 2/10 Low 7 d/yr ≥92°F today · 15 d/yr by 30 yrs out
- Wind 1/10 Low
- Air quality 1/10 Low 0 unhealthy d/yr today · 0 by 30 yrs out
Nearby sold comps map
Loading sold comps map…
Walkable amenities ~0.75 mi
Loading nearby amenities…
Taxation est. · year 1
- Rental income
- $17,999
- − Mortgage interest
- −$4,873
- − Property taxes
- −$3,619
- − Insurance
- −$435
- − Repairs & maintenance
- −$1,440
- − Management
- −$1,440
- − Depreciation
- −$2,531
- Taxable income
- $3,661
- Est. tax owed @ 24.0%
- −$879
- After-tax cash flow
- $3,812/yr
For passive investors: Depreciation is non-cash, so a rental often shows a tax loss while cash-flowing — sheltering income. Rental losses are passive: they offset passive income freely, and up to $25,000/yr can offset ordinary (W-2) income if you actively participate and your MAGI is under $100k (phasing out to $0 by $150k); unused losses carry forward. On sale, claimed depreciation is recaptured at up to 25%, and gains may owe capital-gains tax (a 1031 exchange can defer both). Figures are a year-1 estimate at your 24.0% rate — not tax advice; consult a CPA.
Schools (NCES district)
- District
- Corning City School District
- NCES district ID
- 3608400
- Math proficiency
- 44% ▼ -12.00%
- Reading proficiency
- 53% ▲ 4.00%
- Median HH income
- $53,042
- Composite
- 41.8/100
- National rank
- #3392
- State rank
- #406 of 590 in NY
Livability — South Corning
- Score
- 76/100
- State rank
- #228
- US rank
- #3596
Category grades
Schools grade is shown separately in the Schools card above.
Census & demographics
- County
- Steuben County · 41,193 people
- Metro
- Corning, NY
- Population (ZIP)
- 19,015
- Household income
- $73,263
- Rent vs Own
- Severe rent burden
- 565.0
Population outlook (Steuben County) Hauer SSP2
- Today (2025)
- 93,062 people
- By 2030
- 89,793 · -3.5%
- By 2040
- 82,353 · -11.5%
- By 2050
- 74,286 · -20.2%
- By 2075
- 55,589 · -40.3%
- By 2100
- 37,587 · -59.6%
Race, ethnicity, and origin ACS 2023
- Neighborhood character
- Predominantly White (91%)
- Race & ethnicity
- White 91% Two or more races 3% Black 3% Hispanic / Latino 3% Asian 2%
- Common ancestry
- Romanian 4% Slovak 3% Lithuanian 2%
- Foreign-born
- 5% · Canada, China
- Languages at home
- 95% English-only · Russian/Polish/Slavic 1% Spanish 1% Other Asian/Pacific 1%
Political lean MEDSL · Steuben
- 2024 margin
- Solid R (+31.8) · D 34.1% · R 65.9%
- 2008→2024 swing
- -15.0pp toward R · 2008: -16.8pp · 2024: -31.8pp
- All cycles
- 2024: R+31.8 2020: R+29.6 2016: R+36.2 2012: R+16.4 2008: R+16.8
Not yet ingested
- Civics
- —
Market trends
- HPI YoY
- ▼ -94.59%
- Current HPI
- 173.9857
- Rent YoY
- —
- Metro
- Corning, NY
- State GDP YoY
- ▲ 2.60%
- F500 in state
- 92
Industry mix (Fortune 500 HQ in NY)
| Industry | F500 HQs | Revenue |
|---|---|---|
| Financial Services | 10 | $950B |
|
||
| Consumer Goods | 9 | $162B |
|
||
| Insurance | 4 | $225B |
|
||
| Telecommunications | 2 | $144B |
|
||
| Pharmaceuticals | 2 | $112B |
|
||
| Media / Entertainment | 2 | $69B |
|
||
Price history
1 event — show timeline
- 2026-05-19 Listed $87,000 UNYREIS
Property tax history
+2.6%/yrLatest (2025): $3,619 · +3.3% YoY. Source: county tax records.
Cash-flow waterfall
monthlySold comps — $/sqft
last 12 mo · ≤1 miLoading sold comps…