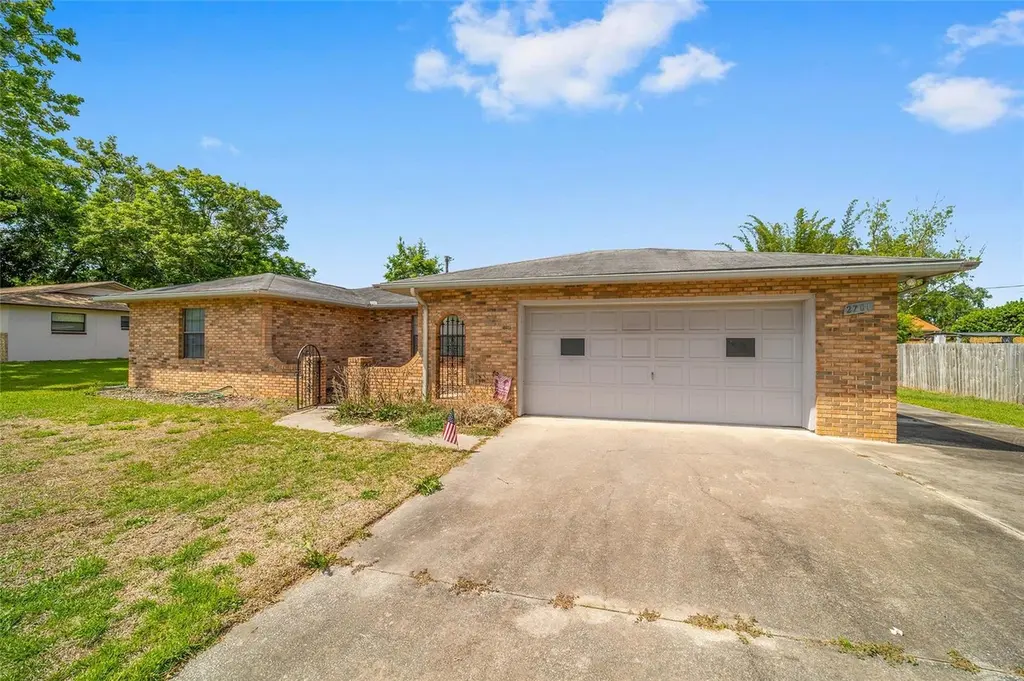
2701 SE 36th St · Ocala, FL
Flood risk 1/10 · Minimal
- FEMA flood zone
- X (unshaded)
- Chance of flooding over 30 yrs
- 0.0%
- Est. flood insurance / yr
- $507 – $1,088
Fire risk 2/10 · Minimal
- Est. fire insurance / yr
- $947 – $1,759
Heat risk 8/10 · Major
- Hot days now (above 108°F)
- 7 days/yr
- Hot days in 30 yrs
- 21 days/yr
Wind risk 9/10 · Severe
- Chance of severe wind over 30 yrs
- 99.0%
Air-quality risk 4/10 · Minor
- Unhealthy air days now
- 5 days/yr
- Unhealthy air days in 30 yrs
- 5 days/yr
Risk factors via First Street. Map © Google.
Why this score? — see what drove the C- grade
The composite is a weighted blend of 9 inputs, each scored 0–100. Each bar is that input's sub-score; the figure is the points it added to the 100-point composite (weight × sub-score).
- Cash flow +16.1/30.0
- ARV discount +14.5/15.0
- DSCR +5.0/10.0
- Schools +3.6/10.0
- Livability +3.5/5.0
- 1% rule +3.4/10.0
- Condition / age +2.5/5.0
- Rent growth +2.3/5.0
- Appreciation +0.0/10.0
$238,700
🖨 Deal sheet (PDF) 📄 Offer letter ✓ Due diligence
Listing remarks MLS
Charming SE Ocala Home in a Prime Location! Welcome to this well-maintained 2-bedroom, 2-bath 2 car garage home offering 1,525 square feet of comfortable living space in SE Ocala. Situated on a spacious . 33-acre lot, this property provides the perfect blend of convenience, value, and room to enjoy outdoor living. Inside, you’ll find a functional and inviting layout with generous living areas that provide flexibility for everyday living, entertaining, or even a home office setup. The kitchen features ample cabinet and counter space, making meal prep and hosting a breeze. Step outside to enjoy the large yard—ideal for pets, gardening, or creating your own backyard retreat. You’ll appreciate the freedom and flexibility this property offers. Conveniently located near shopping, dining, medical facilities, and major roadways, this home is well-positioned for easy living in one of Ocala’s most established areas. Perfect for first-time buyers, downsizers, or investors, this home offers a great opportunity to own in a sought-after SE location. Schedule your showing today and explore the potential this home has!
Key facts
- Flexible layout
- Large yard
- Spacious lot
Tags
Neighborhood map
What this means for you Summary
Snapshot
- This is a 2-bed/2.0-bath single-family listed at $239k.
Deal economics
- At list price, monthly cash flow is $122 ($1k/yr) — positive.
- The deal already cash-flows at list — no discount required.
- To meet the 1% rule (rent ≥ 1% of price), the offer needs to be $201k (15.9% below list).
- Recommended offer: $201k (15.9% below list) — sets the bar for 1% rule.
- Cap rate 6.9% vs local median 4.2% in Ocala — top-decile yield for the area; either an underpriced asset or a hidden risk that comps aren't pricing in. Stress-test before assuming the spread holds.
Location & tenants
- Location reads 69/100 on livability (#476 in FL) — a middle-class / working-renter tenant base. Strengths: cost of living A+, housing A+, health & safety A+; Watch: crime F, amenities F, commute F.
- Marion (rural): math 42% / reading 43% proficiency, ranked #61 of 73 in FL (top 84%) — families likely to look elsewhere, expect single-tenant / working-renter base with shorter leases; 61% free/reduced lunch — lower-income household profile, screen leases tightly.
- Market conditions: Rents soft (-0.6%/yr); 317 active listings in the ZIP; 12 comparable units currently listed for rent nearby; rentals at typical pace (median 23d on market — plan ~3-4 weeks tenant-placement turnaround); 7,071 units permitted in Marion County in 2024 (534 in 5+ unit buildings).
- This rent runs 37% of the median local income ($66k/yr) — at the standard rent-burdened threshold; future hikes will face affordability resistance.
Forward outlook
- Local home prices are declining (-3.0%/yr); year-one equity from $2k of loan paydown is wiped out by about $7k of value loss. Plan a longer hold.
- Marion County population projected at +13% by 2050 — modest demand growth; plan on rents tracking national, not racing it.
Negotiation context
- It's been on market 47 days — a 3% lower offer ($232k) is reasonable based on typical stale-listing flexibility.
Risks & watch-outs
- Climate carrying-cost: severe wind risk, 99% chance of damaging wind over 30y; extreme-heat days projected 7→21/yr by 2055 (HVAC capex compounding) — expect insurance premiums to compound above CPI over the hold.
Questions for the listing agent
- It's been on market 47 days. Have you received any prior offers? Is the seller open to a 16% concession, seller financing, or rate buy-down credit?
- Is there a deadline driving the sale (1031 exchange, divorce, estate, relocation)? That informs how much negotiation room exists.
- Crime grade is F in this area — have there been break-ins, vandalism, or insurance claims at this property in the last 3 years? What carrier currently insures it and at what premium?
- What's the average days-on-market for RENTAL listings here right now (not sales)? A rising rental-DOM trend means longer vacancies and softer asking-rent achievability than the comps imply.
- What's the recent tenant-quality profile in this submarket — average credit score on applications, eviction rate, late-payment / NSF rate, and stable-employment percentage? A property-management company in the area should have these aggregated.
- How much new for-sale + rental construction is in the pipeline within 1–3 miles? Heavy new supply typically softens prices + rents 12–24 months out; constrained supply supports both.
Investment metrics
- 1% rule
- 0.84% ✗
- Cap rate
- 6.91%
- Cash-on-cash
- 2.19%
- DSCR
- 1.10
- GRM
- 9.9
CMA / ARV
- ARV (median comp)
- $282,723
- List price
- $238,700
- Delta
- -15.57%
- Verdict
- UNDERPRICED
- Comps
- 20 within 1.0 mi
Show comp detail 5 sales within ~0.75 mi
| Address | Dist | Beds/Ba | Sqft | Sold | Price | $/sf | Match |
|---|---|---|---|---|---|---|---|
| 3450 SE 26th Ct | 0.10mi | 3/2.0 (+1) | 1,722 (+13%) | 10mo | $319,900 | $186 | 60 |
| 2990 SE 36th St | 0.32mi | 3/2.0 (+1) | 1,748 (+15%) | 6mo | $334,000 | $191 | 50 |
| 2767 SE 35th St | 0.09mi | 3/2.0 (+1) | 1,736 (+14%) | 23mo | $285,000 | $164 | 49 |
| 3225 SE 32nd Ave | 0.51mi | 3/2.0 (+1) | 1,722 (+13%) | 6mo | $380,000 | $221 | 44 |
| 3261 SE 32nd St | 0.61mi | 3/2.0 (+1) | 1,626 (+7%) | 15mo | $290,000 | $178 | 43 |
Match score weights: distance 35% · size 25% · config 20% · recency 20%. Top-matched comps best support the ARV.
Projected returns pro-forma
-3.0% appreciation · 0.0% rent growth · sell at horizon
- IRR
- -15.9%
- Equity multiple
- 0.45×
- Total profit
- $-36,877
- Equity at exit
- $35,591
- IRR
- -13.2%
- Equity multiple
- 0.32×
- Total profit
- $-45,183
- Equity at exit
- $20,638
Cash invested: $66,836 (down + closing). Projections, not guarantees.
Landlord ↔ Tenant lean methodology
- Overall (STATE)
- 87 Strongly Landlord-Friendly
- State Florida
- 87 Strongly Landlord-Friendly · R+3
- County
- — inherits STATE
- City
- — inherits STATE
ZIP-level market 34471
- Rents YoY
- -0.6%
- Active inventory
- 317
- Price-to-rent
- 9.9×
Monthly cashflow live
- Estimated rent
- $2,007 high interval (Pro) →
- Mortgage (P&I)
- −$1,252
- Tax from tax record
- −$112 /mo · $1,350/yr
- Insurance
- −$99
- HOA
- −$0
- Vacancy / Maint / Mgmt
- −$422
- Net cashflow
- $122
Break-even live
Sensitivity live
| Price | -10% $257 | -5% $190 | +0% $122 | +5% $54 | +10% $-13 |
|---|---|---|---|---|---|
| Rent | -10% $-37 | -5% $43 | +0% $122 | +5% $201 | +10% $281 |
| Rate | -1.0pp $242 | -0.5pp $183 | base $122 | +0.5pp $60 | +1.0pp $-3 |
UW: 25.0% down · 7.5% · 30yr · 1.5% tax · 5.0% vac · 8.0% maint · 8.0% mgmt
Financing live
Cash to close
- Down payment
- $59,675
- Closing costs
- $7,161
- Reserves months
- —
- Total cash needed
- —
Loan-product check · same deal, 3 products live
Conventional
25% down · 7.5% · 30yr
- Down + closing
- —
- Monthly P&I
- —
- Monthly cashflow
- —
- DSCR
- —
- Eligible?
- —
Personal DTI + credit; lowest rate.
DSCR
20% down · 8.5% · 30yr
- Down + closing
- —
- Monthly P&I
- —
- Monthly cashflow
- —
- DSCR
- —
- Eligible?
- —
No personal income docs; deal must DSCR.
Hard money
10% down · 12.0% · 12mo
- Down + closing
- —
- Monthly P&I
- —
- Monthly cashflow
- —
- DSCR
- —
- Eligible?
- —
Short-term bridge; refi at stabilization.
Rent comps 12 comps
| Address | Beds | Baths | Sqft | Rent | $/sqft | DOM | Units | Dist |
|---|---|---|---|---|---|---|---|---|
| 2700 SE 35th St Ocala, FL | 3.0 | 2.0 | 1977 | $2,500 | $1.26 | 22d | 1 | 0.04mi |
| 3700 SE 34th Ct Ocala, FL | 3.0 | 2.0 | 1508 | $2,050 | $1.36 | 22d | 1 | 0.65mi |
| 4760 SE 30th Ct Ocala, FL | 3.0 | 2.0 | 1520 | $1,500 | $0.99 | 22d | 1 | 0.88mi |
| 3674 SE 37th Ct Ocala, FL | 3.0 | 2.5 | 1708 | $1,800 | $1.05 | 15d | 1 | 0.95mi |
| 4861 SE 31st Ter Ocala, FL | 3.0 | 2.0 | 1482 | $1,700 | $1.15 | 22d | 1 | 1.00mi |
| 3339 SE 37th Avenue Rd Ocala, FL | 3.0 | 2.5 | 1828 | $1,900 | $1.04 | 15d | 1 | 1.01mi |
| 3488 SE 37th Avenue Rd Ocala, FL | 3.0 | 2.5 | 1708 | $1,800 | $1.05 | 22d | 1 | 1.01mi |
| 3663 SE 37th Avenue Rd Ocala, FL | 3.0 | 2.5 | 1707 | $1,825 | $1.07 | 22d | 1 | 1.03mi |
| 3001 SE Lake Weir Ave Ocala, FL | 1.0–3.0 | 1.0–2.0 | 812 | $1,612 | $1.98 | 15d | 16 | 1.25mi |
| 1906 SE Clatter Bridge Rd Ocala, FL | 3.0 | 2.5 | 2176 | $2,400 | $1.10 | 22d | 1 | 1.26mi |
| 2201 SE 14th Ave Ocala, FL | 2.0 | 1.5 | 1050 | $1,162 | $1.11 | 15d | 2 | 1.44mi |
| 1850 SE 18th Ave Ocala, FL | 1.0–3.0 | 1.0–2.0 | 999 | $1,648 | $1.65 | 15d | 51 | 1.45mi |
Listing history 6 events
-
2026-06-02status $238,700 Pending 47 DOM
-
2026-06-01days on market $238,700 Active 47 DOM
-
2026-05-31days on market $238,700 Active 46 DOM
-
2026-05-30days on market $238,700 Active 45 DOM
-
2026-05-16price $238,700 1147-char remark
Show marketing remark (1147 chars)
Charming SE Ocala Home in a Prime Location! Welcome to this well-maintained 2-bedroom, 2-bath 2 car garage home offering 1,525 square feet of comfortable living space in SE Ocala. Situated on a spacious . 33-acre lot, this property provides the perfect blend of convenience, value, and room to enjoy outdoor living. Inside, you’ll find a functional and inviting layout with generous living areas that provide flexibility for everyday living, entertaining, or even a home office setup. The kitchen features ample cabinet and counter space, making meal prep and hosting a breeze. Step outside to enjoy the large yard—ideal for pets, gardening, or creating your own backyard retreat. You’ll appreciate the freedom and flexibility this property offers. Conveniently located near shopping, dining, medical facilities, and major roadways, this home is well-positioned for easy living in one of Ocala’s most established areas. Perfect for first-time buyers, downsizers, or investors, this home offers a great opportunity to own in a sought-after SE location. Schedule your showing today and explore the potential this home has!
-
2026-04-15$259,700 Active 1147-char remark
Show marketing remark (1147 chars)
Charming SE Ocala Home in a Prime Location! Welcome to this well-maintained 2-bedroom, 2-bath 2 car garage home offering 1,525 square feet of comfortable living space in SE Ocala. Situated on a spacious . 33-acre lot, this property provides the perfect blend of convenience, value, and room to enjoy outdoor living. Inside, you’ll find a functional and inviting layout with generous living areas that provide flexibility for everyday living, entertaining, or even a home office setup. The kitchen features ample cabinet and counter space, making meal prep and hosting a breeze. Step outside to enjoy the large yard—ideal for pets, gardening, or creating your own backyard retreat. You’ll appreciate the freedom and flexibility this property offers. Conveniently located near shopping, dining, medical facilities, and major roadways, this home is well-positioned for easy living in one of Ocala’s most established areas. Perfect for first-time buyers, downsizers, or investors, this home offers a great opportunity to own in a sought-after SE location. Schedule your showing today and explore the potential this home has!
ⓘ Source: listings_history table (triggers on properties + properties_extension) + one-shot
backfill from property_details.listing_events for pre-trigger history.
Tax reassessment forecast FL · Resets to sale price
- Current annual tax
- $1,350 · $112/mo
- Projected year-2 tax
- $1,981 · $165/mo
- Expected delta
- +$631/yr (+$53/mo · 46.8%)
ⓘ Screening estimate from a state-policy table — verify with the county assessor before closing.
Climate risk First Street
- Flood 1/10 Low FEMA zone X (unshaded) · 0% chance over 30 yrs
- Wildfire 2/10 Low
- Heat 8/10 Severe 7 d/yr ≥108°F today · 21 d/yr by 30 yrs out
- Wind 9/10 Extreme 99% chance of damaging wind over 30 yrs
- Air quality 4/10 Moderate 5 unhealthy d/yr today · 5 by 30 yrs out
Nearby sold comps map
Loading sold comps map…
Walkable amenities ~0.75 mi
Loading nearby amenities…
Taxation est. · year 1
- Rental income
- $24,086
- − Mortgage interest
- −$13,371
- − Property taxes
- −$1,350
- − Insurance
- −$1,194
- − Repairs & maintenance
- −$1,927
- − Management
- −$1,927
- − Depreciation
- −$6,944
- Taxable loss
- −$2,626
- Est. tax savings @ 24.0%
- +$630
- After-tax cash flow
- $2,094/yr
For passive investors: Depreciation is non-cash, so a rental often shows a tax loss while cash-flowing — sheltering income. Rental losses are passive: they offset passive income freely, and up to $25,000/yr can offset ordinary (W-2) income if you actively participate and your MAGI is under $100k (phasing out to $0 by $150k); unused losses carry forward. On sale, claimed depreciation is recaptured at up to 25%, and gains may owe capital-gains tax (a 1031 exchange can defer both). Figures are a year-1 estimate at your 24.0% rate — not tax advice; consult a CPA.
Schools (NCES district)
- District
- Marion
- NCES district ID
- 1201260
- Math proficiency
- 42% ▼ -7.00%
- Reading proficiency
- 43% ▼ -4.00%
- Median HH income
- $40,015
- Composite
- 35.61/100
- National rank
- #4890
- State rank
- #61 of 73 in FL
Livability — Ocala
- Score
- 69/100
- State rank
- #476
- US rank
- #8461
Category grades
Schools grade is shown separately in the Schools card above.
Census & demographics
- County
- Marion County · 315,796 people
- City population
- 263,375
- Metro
- Ocala, FL
- Population (ZIP)
- 28,342
- Household income
- $65,789
- Rent vs Own
- Severe rent burden
- 1494.0
Population outlook (Marion County) Hauer SSP2
- Today (2025)
- 365,905 people
- By 2030
- 376,768 · +3.0%
- By 2040
- 396,555 · +8.4%
- By 2050
- 412,723 · +12.8%
- By 2075
- 446,090 · +21.9%
- By 2100
- 436,193 · +19.2%
Race, ethnicity, and origin ACS 2023
- Neighborhood character
- Predominantly White (67%)
- Race & ethnicity
- White 67% Hispanic / Latino 16% Two or more races 11% Black 10% Asian 3%
- Hispanic origin (detail)
- Mexican 2% Puerto Rican 6% Cuban 3% Dominican 1%
- Common ancestry
- Slovak 3% Italian 2% Lithuanian 2%
- Foreign-born
- 9% · Canada, Jamaica, Dominican Republic
- Languages at home
- 86% English-only · Spanish 11% Other Asian/Pacific 1%
Political lean MEDSL · Marion
- 2024 margin
- Solid R (+31.6) · D 33.8% · R 65.5%
- 2008→2024 swing
- -20.0pp toward R · 2008: -11.6pp · 2024: -31.6pp
- All cycles
- 2024: R+31.6 2020: R+25.9 2016: R+26.2 2012: R+16.2 2008: R+11.6
Not yet ingested
- Civics
- —
Market trends
- HPI YoY
- ▼ -176.55%
- Current HPI
- 224.1709
- Rent YoY
- ▼ -0.64%
- Metro
- Ocala, FL
- State GDP YoY
- ▲ 3.28%
- F500 in state
- 36
Industry mix (Fortune 500 HQ in FL)
| Industry | F500 HQs | Revenue |
|---|---|---|
| Industrial Technology | 2 | $29B |
|
||
| Insurance | 2 | $17B |
|
||
| Retail | 1 | $60B |
|
||
| Technology Distribution | 1 | $58B |
|
||
| Homebuilding | 1 | $35B |
|
||
| Technology Manufacturing | 1 | $35B |
|
||
Price history
-8.1% since first listed2 events — show timeline
- 2026-05-16 Price Changed $238,700 Stellar MLS as Distributed by MLS Grid
- 2026-04-15 Listed $259,700 Stellar MLS as Distributed by MLS Grid
Property tax history
+3.6%/yrLatest (2025): $1,350 · +13.3% YoY. Source: county tax records.
Cash-flow waterfall
monthlySold comps — $/sqft
last 12 mo · ≤1 miLoading sold comps…