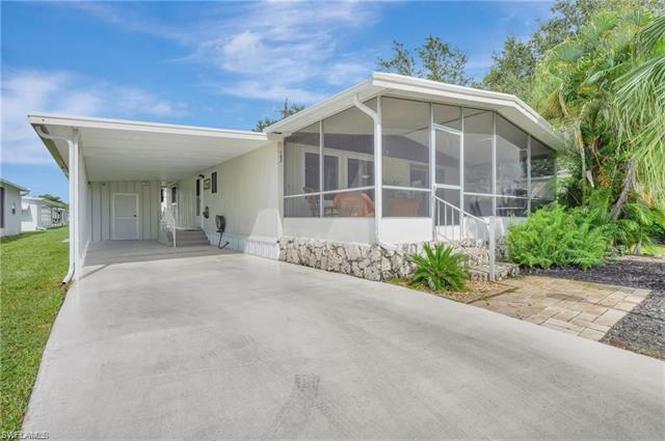
193 Carissa Ln #89 · Winding Cypress, FL
Flood risk 9/10 · Severe
- FEMA flood zone
- AE
- Chance of flooding over 30 yrs
- 0.99%
- Est. flood insurance / yr
- $1,737 – $8,500
Fire risk 4/10 · Minor
- Est. fire insurance / yr
- $947 – $1,759
Heat risk 10/10 · Severe
- Hot days now (above 108°F)
- 6 days/yr
- Hot days in 30 yrs
- 22 days/yr
Wind risk 10/10 · Severe
- Chance of severe wind over 30 yrs
- 99.0%
Air-quality risk 2/10 · Minimal
- Unhealthy air days now
- 2 days/yr
- Unhealthy air days in 30 yrs
- 2 days/yr
Risk factors via First Street. Map © Google.
Why this score? — see what drove the B+ grade
The composite is a weighted blend of 9 inputs, each scored 0–100. Each bar is that input's sub-score; the figure is the points it added to the 100-point composite (weight × sub-score).
- Cash flow +30.0/30.0
- 1% rule +10.0/10.0
- DSCR +10.0/10.0
- ARV discount +7.5/15.0
- Schools +5.0/10.0
- Appreciation +4.3/10.0
- Condition / age +3.8/5.0
- Rent growth +3.3/5.0
- Livability +2.5/5.0
$150,000
🖨 Deal sheet 📄 Offer letter ✓ Due diligence
Listing remarks
PACK YOUR BAGS—PARADISE AWAITS! Welcome to this beautifully updated and meticulously maintained 2-bedroom plus den, 2-bath residence in the highly desired Holiday Manor Community- perfectly designed for easy Florida living. FRESHLY PAINTED and move-in ready, this open-concept home shines with BRAND NEW VINYL PLANK FLOORING INSTALLED MARCH 2026 and ceiling fans throughout, offering both style and comfort. Step outside to the spacious screened lanai, an ideal spot for entertaining guests or unwinding with your favorite beverage while enjoying serene tropical views on a quiet DEAD-END STREET. Enjoy added privacy with neighbors on only one side. Recent upgrades provide peace of mind, incl
Key facts
- Screened lanai
- Tropical views
- Double-pane windows
Tags
Property features AI
Other
- Lot & land: 1.00 acre lot; Deeded lot in a regular, dead-end paved road location (Lot Unit 89); Property appraiser office is source for lot dimensions; Views of landscaped and wooded areas; Has waterfront access — canal with gulf access via bridges; canal width 121–150 feet; wooden dock with water available at dock; boat ramp and boat slip available
- Possession: Possession at closing
- Multi-unit info: One unit on the lot/building; 1 floor; 312 total units in the complex
Finance
- HOA & community: Mandatory HOA; On-site management; Monthly master HOA fee of $180 (total annual recurring fees $2,160); HOA covers lawn/land maintenance, pest control (exterior), street maintenance, street lights, legal/accounting, manager services, recreation facilities; master association fee included; Community amenities include clubhouse, community pool, community spa/hot tub, exercise room, community boat dock/ramps/slips, boat storage, billiards, community room, fish cleaning station, internet access, and streetlights; Community type: boating, mobile/manufactured, non-gated
Exterior
- Parking: Covered parking; Driveway (paved); Carport — attached, 2 spaces; Additional 2+ parking spaces; Golf cart parking
- Security: Exterior shutters
- Utilities: Central water; Central sewer; Cable available
- Home design: Manufactured home; Single-story ranch / traditional design; Rear exposure faces west; Located in Holiday Manor community
- Construction: Manufactured construction; Vinyl siding; Built in 1973
- Exterior features: Privacy wall; Shutters for storm protection; Single-hung and sliding windows; Rolled roof
Interior
- Kitchen: Island; Pantry; Electric cooktop; Dishwasher; Microwave; Refrigerator/freezer
- Bedrooms: 2 bedrooms plus a den; Split bedroom plan; Primary/guest bedroom on the first floor
- Flooring: Vinyl flooring
- Bathrooms: 2 full bathrooms; Master bathroom with tub only
- Heating & cooling: Central electric heating; Central electric cooling
- Interior features: High-speed internet available; Window coverings; Partially furnished; Den/Study, Family Room, Great Room, Florida Room, Screened lanai/porch, Home office
- Laundry & utility: Washer and dryer included; Laundry located in garage
Neighborhood map
What this means for you Summary
Snapshot
- This is a 2-bed/2.0-bath manufactured listed at $150k. Condition is rated good.
Deal economics
- At list price, monthly cash flow is $648 ($8k/yr) — positive.
- The deal already cash-flows at list — no discount required.
- Meets the 1% rule at list price ($3k rent vs $150k).
- Recommended offer: $132k (12.0% below list) — sets the bar for market timing.
Location & tenants
- Location reads: area grade B — affects rentability + tenant quality, not the cash-flow math above.
- Collier (suburban): math 60% / reading 56% proficiency, ranked #16 of 73 in FL (top 22%) — acceptable for families but not a draw, mixed tenant base, ~2y average lease.
- Market conditions: Rents rising (+3.2%/yr); 900 active listings in the ZIP; 28 comparable units currently listed for rent nearby; rentals at typical pace (median 24d on market — plan ~3-4 weeks tenant-placement turnaround); solid renter incomes; 3,520 units permitted in Collier County in 2024 (959 in 5+ unit buildings).
- This rent runs 39% of the median local income ($89k/yr) — at the standard rent-burdened threshold; future hikes will face affordability resistance.
Forward outlook
- Local home prices are declining (-1.5%/yr); year-one equity from $1k of loan paydown is wiped out by about $2k of value loss. Plan a longer hold.
- Collier County population projected at +30% by 2050 — long-run rental-demand tailwind backs the buy-and-hold thesis.
- At projected returns (-1.5% appreciation + 3.2% rent growth), your $42k cash investment doubles in ~6 years — after that, you're playing with house money.
Negotiation context
- It's been on market 182 days — a 12% lower offer ($132k) is reasonable based on typical stale-listing flexibility.
Risks & watch-outs
- Watch-outs: flood insurance adds $427/mo.
- Climate carrying-cost: in FEMA flood zone AE (mandatory federal flood insurance); severe wind risk, 99% chance of damaging wind over 30y; extreme-heat days projected 6→22/yr by 2055 (HVAC capex compounding) — expect insurance premiums to compound above CPI over the hold.
Questions for the listing agent
- It's been on market 182 days. Have you received any prior offers? Is the seller open to a 12% concession, seller financing, or rate buy-down credit?
- Built in 1973 — when were the roof, HVAC, electrical panel, plumbing, and water heater last replaced?
- What's the actual annual flood-insurance premium (NFIP or private), and is the property in a SFHA with mandatory coverage?
- What does the HOA fee cover, when was the last increase, and are there any pending special assessments or reserve-fund shortfalls?
- Why hasn't it sold? Are there any deal-killer items the seller is aware of (foundation, flood, title, zoning, code violations)?
- Is there a deadline driving the sale (1031 exchange, divorce, estate, relocation)? That informs how much negotiation room exists.
- What's the average days-on-market for RENTAL listings here right now (not sales)? A rising rental-DOM trend means longer vacancies and softer asking-rent achievability than the comps imply.
- What's the recent tenant-quality profile in this submarket — average credit score on applications, eviction rate, late-payment / NSF rate, and stable-employment percentage? A property-management company in the area should have these aggregated.
- How much new for-sale + rental construction is in the pipeline within 1–3 miles? Heavy new supply typically softens prices + rents 12–24 months out; constrained supply supports both.
Investment metrics
- 1% rule
- 1.93% ✓
- Cap rate
- 14.89%
- Cash-on-cash
- 30.70%
- DSCR
- 2.37
- GRM
- 4.3
CMA / ARV
No comps found within radius.
Projected returns pro-forma
-1.48% appreciation · 3.21% rent growth · sell at horizon
- IRR
- 15.0%
- Equity multiple
- 1.66×
- Total profit
- $27,782
- Equity at exit
- $32,777
- IRR
- 21.8%
- Equity multiple
- 3.16×
- Total profit
- $90,523
- Equity at exit
- $31,573
Cash invested: $42,000 (down + closing). Projections, not guarantees.
Landlord ↔ Tenant lean methodology
- Overall (STATE)
- 87 Strongly Landlord-Friendly
- State Florida
- 87 Strongly Landlord-Friendly · R+3
- County
- — inherits STATE
- City
- — inherits STATE
ZIP-level market 34114
- Home prices YoY
- -0.6%
- Rents YoY
- 3.2%
- Active inventory
- 900
- Price-to-rent
- 4.3×
Monthly cashflow live
- Estimated rent
- $2,900 high interval (Pro) →
- Mortgage (P&I)
- −$787
- Tax est. 1.5%
- −$188 /mo · $2,250/yr
- Insurance
- −$62
- Flood insurance flood zone
- −$427 /mo · $5,118/yr
- HOA
- −$180
- Vacancy / Maint / Mgmt
- −$609
- Net cashflow
- $648
Break-even live
UW: 25.0% down · 7.5% · 30yr · 1.5% tax · 5.0% vac · 8.0% maint · 8.0% mgmt
Financing live
Cash to close
- Down payment
- $37,500
- Closing costs
- $4,500
- Reserves months
- —
- Total cash needed
- —
Loan-product check · same deal, 3 products live
Conventional
25% down · 7.5% · 30yr
- Down + closing
- —
- Monthly P&I
- —
- Monthly cashflow
- —
- DSCR
- —
- Eligible?
- —
Personal DTI + credit; lowest rate.
DSCR
20% down · 8.5% · 30yr
- Down + closing
- —
- Monthly P&I
- —
- Monthly cashflow
- —
- DSCR
- —
- Eligible?
- —
No personal income docs; deal must DSCR.
Hard money
10% down · 12.0% · 12mo
- Down + closing
- —
- Monthly P&I
- —
- Monthly cashflow
- —
- DSCR
- —
- Eligible?
- —
Short-term bridge; refi at stabilization.
Rent comps 28 comps
| Address | Beds | Baths | Sqft | Rent | $/sqft | DOM | Units | Dist |
|---|---|---|---|---|---|---|---|---|
| 1252 Henderson Creek Dr Naples, FL | 2.0 | 1.5 | 820 | $1,895 | $2.31 | 23d | 1 | 0.23mi |
| 1747 Beverly Dr Naples, FL | 2.0 | 2.0 | 1080 | $2,300 | $2.13 | 23d | 1 | 0.39mi |
| 274 Riverwood Rd Unit 1546056P Naples, FL | 2.0 | 2.0 | 1496 | $4,451 | $2.98 | 14d | 1 | 0.44mi |
| 158 Rookery Rd Naples, FL | 3.0 | 2.0 | 1456 | $2,450 | $1.68 | 23d | 1 | 0.45mi |
| 6750 Beach Resort Dr #7 Naples, FL | 2.0 | 2.0 | 1351 | $3,900 | $2.89 | 23d | 1 | 0.51mi |
| 6750 Beach Resort Dr Naples, FL | 2.0 | 2.0 | 1351 | $3,200 | $2.37 | 14d | 2 | 0.51mi |
| 1010 Manatee Rd Unit B304 Naples, FL | 2.0 | 2.0 | 1000 | $1,800 | $1.80 | 23d | 1 | 0.54mi |
| 1000 Manatee Rd Unit A201 Naples, FL | 2.0 | 2.0 | 1000 | $1,695 | $1.70 | 23d | 1 | 0.56mi |
| 1022 Manatee Rd Unit D107 Naples, FL | 2.0 | 2.0 | 1000 | $2,000 | $2.00 | 23d | 1 | 0.56mi |
| 6680 Beach Resort Dr Unit 1214 Naples, FL | 2.0 | 2.0 | 1351 | $4,500 | $3.33 | 14d | 1 | 0.59mi |
| 6650 Beach Resort Dr Unit 908 Naples, FL | 2.0 | 2.0 | 1351 | $4,600 | $3.40 | 14d | 1 | 0.60mi |
| 1014 Manatee Rd Unit F307 Naples, FL | 2.0 | 2.0 | 900 | $1,800 | $2.00 | 23d | 1 | 0.63mi |
| 6590 Beach Resort Dr Unit 305 Naples, FL | 2.0 | 2.0 | 1351 | $4,500 | $3.33 | 14d | 1 | 0.66mi |
| 2000 Rookery Bay Dr Naples, FL | 1.0–3.0 | 1.0–2.0 | 929 | $1,772 | $1.91 | 23d | 9 | 0.69mi |
| 1212 Enbrook Loop Naples, FL | 2.0 | 2.0 | 1496 | $2,850 | $1.91 | 23d | 1 | 0.72mi |
| 9175 Celeste Dr Unit 105 Naples, FL | 2.0 | 2.0 | 1000 | $2,000 | $2.00 | 23d | 1 | 1.00mi |
| 9187 Celeste Dr Unit 1073494P Naples, FL | 2.0 | 2.0 | 1399 | $2,979 | $2.13 | 14d | 1 | 1.00mi |
| 9165 Celeste Dr Unit 3-303 Naples, FL | 2.0 | 2.0 | 1000 | $6,500 | $6.50 | 23d | 1 | 1.05mi |
| 2235 Yellowfin Cir Naples, FL | 2.0 | 2.0 | 1500 | $2,795 | $1.86 | 23d | 1 | 1.18mi |
| 9111 Capistrano St S #8303 Naples, FL | 2.0 | 2.5 | 1432 | $7,500 | $5.24 | 23d | 1 | 1.24mi |
| 9115 Capistrano St S #8207 Naples, FL | 2.0 | 2.5 | 1494 | $6,000 | $4.02 | 23d | 1 | 1.25mi |
| 1435 Santiago Cir #2003 Naples, FL | 3.0 | 2.5 | 1315 | $2,600 | $1.98 | 23d | 1 | 1.25mi |
| 9092 Chula Vista St #11003 Naples, FL | 2.0 | 2.0 | 1404 | $6,850 | $4.88 | 23d | 1 | 1.32mi |
| 9088 Chula Vista St Unit 108-3 Naples, FL | 2.0 | 2.0 | 1404 | $5,700 | $4.06 | 23d | 1 | 1.34mi |
| 9022 Michael Cir Unit 2-205 Naples, FL | 2.0 | 2.0 | 1450 | $3,500 | $2.41 | 23d | 1 | 1.36mi |
| 9081 Albion Ln S #6505 Naples, FL | 2.0 | 2.0 | 1225 | $7,500 | $6.12 | 23d | 1 | 1.37mi |
| 9071 Albion Ln N #5706 Naples, FL | 2.0 | 2.5 | 1441 | $2,200 | $1.53 | 23d | 1 | 1.43mi |
| 9082 Capistrano St N Unit 48-5 Naples, FL | 2.0 | 2.0 | 1227 | $6,500 | $5.30 | 23d | 1 | 1.47mi |
HOA detail
- Monthly dues
- $180 · $2,160/yr
Listing history 9 events
-
2026-06-18days on market $150,000 Active 182 DOM
-
2026-06-17days on market $150,000 Active 181 DOM
-
2026-06-16days on market $150,000 Active 180 DOM
-
2026-06-15days on market $150,000 Active 179 DOM
-
2026-06-10days on market $150,000 Active 174 DOM
-
2026-06-09days on market $150,000 Active 173 DOM
-
2026-06-08days on market $150,000 Active 172 DOM
-
2026-06-07remarks 693-char remark
-
2026-06-07$150,000 Active 171 DOM
ⓘ Source: listings_history table (triggers on properties + properties_extension) + one-shot
backfill from property_details.listing_events for pre-trigger history.
Climate risk First Street
- Flood 9/10 Extreme FEMA zone AE · 99% chance over 30 yrs
- Wildfire 4/10 Moderate
- Heat 10/10 Extreme 6 d/yr ≥108°F today · 22 d/yr by 30 yrs out
- Wind 10/10 Extreme 99% chance of damaging wind over 30 yrs
- Air quality 2/10 Low 2 unhealthy d/yr today · 2 by 30 yrs out
Nearby sold comps map
Loading sold comps map…
Walkable amenities ~0.75 mi
Loading nearby amenities…
Taxation est. · year 1
- Rental income
- $34,802
- − Mortgage interest
- −$8,402
- − Property taxes
- −$2,250
- − Insurance
- −$5,868
- − Repairs & maintenance
- −$2,784
- − Management
- −$2,784
- − HOA
- −$2,160
- − Depreciation
- −$4,364
- Taxable income
- $6,189
- Est. tax owed @ 24.0%
- −$1,485
- After-tax cash flow
- $6,290/yr
For passive investors: Depreciation is non-cash, so a rental often shows a tax loss while cash-flowing — sheltering income. Rental losses are passive: they offset passive income freely, and up to $25,000/yr can offset ordinary (W-2) income if you actively participate and your MAGI is under $100k (phasing out to $0 by $150k); unused losses carry forward. On sale, claimed depreciation is recaptured at up to 25%, and gains may owe capital-gains tax (a 1031 exchange can defer both). Figures are a year-1 estimate at your 24.0% rate — not tax advice; consult a CPA.
Condition & rehab AI · 13 photos
This beautifully updated and move-in ready manufactured home in the Holiday Manor Community offers a serene tropical setting with fresh paint, updated flooring, and a spacious screened lanai.
Value-add opportunities
- Both Paint the exterior siding — Enhances curb appeal and value
- Both Replace the ceiling fans — Improves comfort and aesthetics
- Both Install new outdoor lighting — Enhances safety and curb appeal
Renovation cost estimate screening
Value-add ROI direction
- Both Paint the exterior siding — Enhances curb appeal and value ↑
- Both Replace the ceiling fans — Improves comfort and aesthetics ↑
- Both Install new outdoor lighting — Enhances safety and curb appeal ↑
ⓘ Cost ranges are severity-bucket heuristics (US national rule-of-thumb). Get contractor quotes + a written scope before underwriting a rehab budget.
Schools (NCES district)
- District
- Collier
- NCES district ID
- 1200330
- Math proficiency
- 60% ▼ -4.00%
- Reading proficiency
- 56% ▼ -2.00%
- Median HH income
- $58,275
- Composite
- 50.23/100
- National rank
- #1892
- State rank
- #16 of 73 in FL
Livability — Winding Cypress
No livability data for this city. (Only ~50 U.S. cities are tracked.)
Census & demographics
- County
- Collier County · 396,295 people
- Metro
- Naples-Marco Island, FL
- Population (ZIP)
- 23,559
- Household income
- $89,334
- Rent vs Own
- Severe rent burden
- 550.0
Population outlook (Collier County) Hauer SSP2
- Today (2025)
- 420,858 people
- By 2030
- 450,054 · +6.9%
- By 2040
- 502,232 · +19.3%
- By 2050
- 544,932 · +29.5%
- By 2075
- 627,203 · +49.0%
- By 2100
- 659,015 · +56.6%
Race, ethnicity, and origin ACS 2023
- Neighborhood character
- Predominantly White (72%)
- Race & ethnicity
- White 72% Hispanic / Latino 17% Two or more races 13% Black 7%
- Hispanic origin (detail)
- Mexican 7% Puerto Rican 1% Cuban 3%
- Common ancestry
- Hispanic 5% Romanian 4% Lithuanian 1%
- Foreign-born
- 21% · Canada, Jamaica
- Languages at home
- 75% English-only · Spanish 15% French/Haitian/Cajun 5% Other Indo-European 4%
Political lean MEDSL · Collier
- 2024 margin
- Solid R (+33.1) · D 33.1% · R 66.2%
- 2008→2024 swing
- -10.6pp toward R · 2008: -22.5pp · 2024: -33.1pp
- All cycles
- 2024: R+33.1 2020: R+24.7 2016: R+26.0 2012: R+30.1 2008: R+22.5
Not yet ingested
- Civics
- —
Market trends
- HPI YoY
- ▼ -1.48%
- Current HPI
- 266.5545
- Rent YoY
- ▲ 3.21%
- Metro
- Naples-Marco Island, FL
- State GDP YoY
- ▲ 3.28%
- F500 in state
- 36
Industry mix (Fortune 500 HQ in FL)
| Industry | F500 HQs | Revenue |
|---|---|---|
| Industrial Technology | 2 | $29B |
|
||
| Insurance | 2 | $17B |
|
||
| Retail | 1 | $60B |
|
||
| Technology Distribution | 1 | $58B |
|
||
| Homebuilding | 1 | $35B |
|
||
| Technology Manufacturing | 1 | $35B |
|
||
Price history
1 event — show timeline
- 2025-12-18 Listed $150,000 BEARMLS
Cash-flow waterfall
monthlySold comps — $/sqft
last 12 mo · ≤1 miLoading sold comps…