 Multi-family
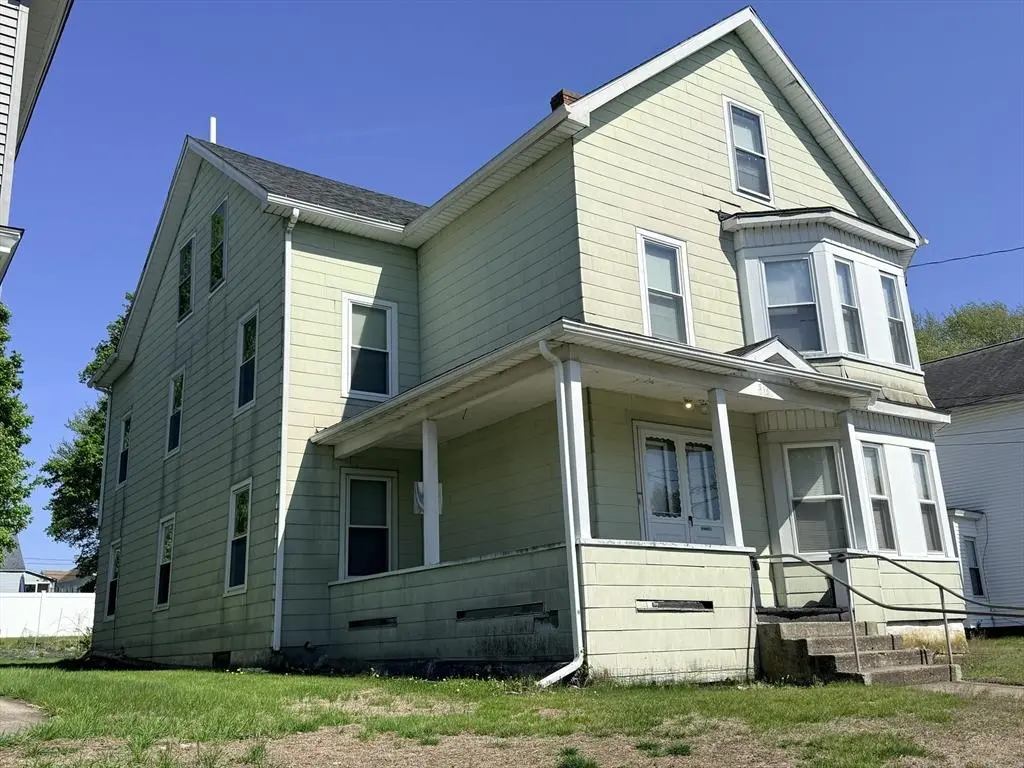
315 High St · Webster, MA
Flood risk 1/10 · Minimal
- FEMA flood zone
- X (unshaded)
- Chance of flooding over 30 yrs
- 0.0%
- Est. flood insurance / yr
- $473 – $860
Fire risk 3/10 · Minor
- Est. fire insurance / yr
- $915 – $1,699
Heat risk 4/10 · Minor
- Hot days now (above 94°F)
- 7 days/yr
- Hot days in 30 yrs
- 15 days/yr
Wind risk 6/10 · Moderate
- Chance of severe wind over 30 yrs
- 46.0%
Air-quality risk 2/10 · Minimal
- Unhealthy air days now
- 2 days/yr
- Unhealthy air days in 30 yrs
- 2 days/yr
Risk factors via First Street. Map © Google.
Why this score? — see what drove the A- grade
The composite is a weighted blend of 9 inputs, each scored 0–100. Each bar is that input's sub-score; the figure is the points it added to the 100-point composite (weight × sub-score).
- Cash flow +30.0/30.0
- ARV discount +15.0/15.0
- DSCR +10.0/10.0
- Appreciation +10.0/10.0
- 1% rule +9.6/10.0
- Livability +3.2/5.0
- Rent growth +2.5/5.0
- Condition / age +2.5/5.0
- Schools +1.9/10.0
$360,000
🖨 Deal sheet (PDF) 📄 Offer letter ✓ Due diligence
Multi-family units
County records classify this as Multi-Family (2-4 Unit). Listing-text estimate: 1 unit. estimate disagrees with records
Listing remarks
>> Opportunity Knocks! >> Presenting 315 High St, Webster, MA >> a distinguished multi-family residence constructed in 1910, offering 2,838 SF+-, 6 well-proportioned bedrooms, & 2 full baths, thoughtfully designed to support the needs of multiple occupants. Spanning 3 stories, the residence provides versatile accommodation options, especially with the potential of the 644 SF+- / 4 room walk-up finished Attic. Two apartments have been continuously occupied & with a little TLC & elbow grease, can easily & immediately provide comfortable, pleasing & versatile living space for it's occupants. The 5’x20’ 3-season 2-story & front po
Key facts
- Finished attic
- Garden area
- 3 season porches
Tags
Property features AI
Finance
- HOA & community: Community features include shopping, walk/jog trails, medical facility, highway access, house of worship, marina, private and public schools, and sidewalks; Not a senior community
Exterior
- Parking: Off-street paved parking; Open parking for 3 vehicles
- Utilities: Public water; Public sewer; Electric with circuit breakers; Gas hookup for range; Washer hookup and electric dryer hookup
- Home design: 2-family (up/down); 3 stories; Green exterior color; Approximate year built (per public records)
- Construction: Frame construction; Stone foundation; Shingle roof; Lead paint certified treated
- Exterior features: Porch (enclosed); Garden; Cleared, level lot; Lake/pond access with public beach ownership; Paved public road frontage; public maintained road
Interior
- Kitchen: Range; Refrigerator
- Flooring: Tile; Vinyl/VCT; Carpet
- Bathrooms: 2 full bathrooms
- Heating & cooling: Baseboard heating (oil); 2 heating units
- Interior features: Living room; Kitchen; Storm doors; Insulated windows; Total of 10 rooms
- Laundry & utility: Washer hookup; Electric dryer hookup
Neighborhood map
What this means for you Summary
Snapshot
- This is a 4-bed/2.0-bath multifamily listed at $360k.
Deal economics
- At list price, monthly cash flow is $2k ($23k/yr) — positive.
- The deal already cash-flows at list — no discount required.
- Meets the 1% rule at list price ($5k rent vs $360k).
- Recommended offer: $355k (1.5% below list) — sets the bar for market timing.
- Cap rate 12.6% vs local median 3.2% in Webster — top-decile yield for the area; either an underpriced asset or a hidden risk that comps aren't pricing in. Stress-test before assuming the spread holds.
Location & tenants
- Location reads 65/100 on livability (#183 in MA) — a middle-class / working-renter tenant base. Strengths: health & safety A+, housing A; Watch: crime D-, amenities F, commute F.
- Webster (suburban): math 15% / reading 28% proficiency, ranked #286 of 302 in MA (top 95%) — low school quality limits family demand, transient renter base, plan for 1-2y turnover.
- Zoned schools: Park Avenue Elementary (math 21% / reading 35%, grade F, #689 of 938 statewide, top 74%, 737 students, 0% FRL); Webster Middle School (math 11% / reading 23%, grade F, #266 of 305 statewide, top 88%, 590 students, 0% FRL); Bartlett High School (math 32% / reading 42%, grade F, #238 of 343 statewide, top 71%, 365 students, 0% FRL) — zoned schools average 0% FRL vs 46% district-wide (46 pts lower); this property's tenant base skews higher-income than the district average.
- Market conditions: 40 active listings in the ZIP; 2,293 units permitted in Worcester County in 2024 (1,205 in 5+ unit buildings).
- At $5,269/mo this rent would consume 87% of the median local household income ($73k/yr) (locally 690% of renters already pay >50% of income on rent) — very limited rent-growth headroom before tenants either downsize or default.
Forward outlook
- In year one you build about $38k of equity ($2k loan paydown + $36k appreciation (10.0% local appreciation)).
- At projected returns (10.0% appreciation + 3.0% rent growth), your $101k cash investment doubles in ~2 years — after that, you're playing with house money.
- By year 2, paydown + projected appreciation supports a ~$62k cash-out refi (75% LTV) — recoverable capital for the next deal without selling this one.
Negotiation context
- It's been on market 16 days — a 2% lower offer ($355k) is reasonable based on typical stale-listing flexibility.
Risks & watch-outs
- Watch-outs: built in 1910 — expect roof / HVAC / electrical / plumbing capex.
- Climate carrying-cost: major wind risk, 46% chance of damaging wind over 30y — expect insurance premiums to compound above CPI over the hold.
Questions for the listing agent
- Built in 1910 — when were the roof, HVAC, electrical panel, plumbing, and water heater last replaced?
- Is there a deadline driving the sale (1031 exchange, divorce, estate, relocation)? That informs how much negotiation room exists.
- Schools are D-rated, which usually means shorter tenancies and higher turnover. Who's the typical renter profile here, and what's been the actual vacancy rate?
- Crime grade is D in this area — have there been break-ins, vandalism, or insurance claims at this property in the last 3 years? What carrier currently insures it and at what premium?
- What's the average days-on-market for RENTAL listings here right now (not sales)? A rising rental-DOM trend means longer vacancies and softer asking-rent achievability than the comps imply.
- What's the recent tenant-quality profile in this submarket — average credit score on applications, eviction rate, late-payment / NSF rate, and stable-employment percentage? A property-management company in the area should have these aggregated.
- How much new apartment / multifamily construction is in the pipeline within 1–3 miles? Heavy new supply (>2% of stock underway) typically softens rents 12–24 months out; light construction supports rent growth.
Investment metrics
- 1% rule
- 1.46% ✓
- Cap rate
- 12.63%
- Cash-on-cash
- 22.63%
- DSCR
- 2.01
- GRM
- 5.7
CMA / ARV
- ARV (on-the-fly)
- $547,734
- Comps found
- 7
Show comp detail 7 sales within ~0.75 mi
| Address | Dist | Beds/Ba | Sqft | Sold | Price | $/sf | Match |
|---|---|---|---|---|---|---|---|
| 4 Boyden St Ext | 0.28mi | 4/3.0 | 3,060 (+8%) | 18mo | $589,000 | $192 | 55 |
| 19 Park St | 0.26mi | 5/5.0 (+1) | 3,023 (+6%) | 10mo | $545,714 | $181 | 51 |
| 576-578 School St | 0.30mi | 5/4.0 (+1) | 2,545 (-10%) | 9mo | $530,000 | $208 | 48 |
| 10 New St | 0.63mi | 4/2.0 | 2,688 (-5%) | 21mo | $520,000 | $193 | 44 |
| 730 School St | 0.52mi | 5/4.5 (+1) | 2,550 (-10%) | 5mo | $575,000 | $225 | 40 |
| 17 Granite St | 0.61mi | 5/3.0 (+1) | 2,418 (-15%) | 9mo | $465,000 | $192 | 30 |
| 15 New St | 0.63mi | 5/2.0 (+1) | 2,470 (-13%) | 23mo | $485,000 | $196 | 25 |
Match score weights: distance 35% · size 25% · config 20% · recency 20%. Top-matched comps best support the ARV.
Projected returns pro-forma
10.0% appreciation · 3.0% rent growth · sell at horizon
- IRR
- 41.2%
- Equity multiple
- 4.15×
- Total profit
- $317,100
- Equity at exit
- $324,317
- IRR
- 35.6%
- Equity multiple
- 9.32×
- Total profit
- $838,461
- Equity at exit
- $699,401
Cash invested: $100,800 (down + closing). Projections, not guarantees.
Landlord ↔ Tenant lean methodology
- Overall (STATE)
- 20 Strongly Tenant-Friendly
- State Massachusetts
- 20 Strongly Tenant-Friendly · D+15
- County
- — inherits STATE
- City
- — inherits STATE
ZIP-level market 01570
- Home prices YoY
- 20.5%
- Active inventory
- 40
- Price-to-rent
- 17.1×
Monthly cashflow live
- Estimated rent
- $5,269 high interval (Pro) →
- Mortgage (P&I)
- −$1,888
- Tax from tax record
- −$223 /mo · $2,680/yr
- Insurance
- −$150
- HOA
- −$0
- Vacancy / Maint / Mgmt
- −$1,106
- Net cashflow
- $1,901
Break-even live
Sensitivity live
| Price | -10% $2,105 | -5% $2,003 | +0% $1,901 | +5% $1,799 | +10% $1,698 |
|---|---|---|---|---|---|
| Rent | -10% $1,485 | -5% $1,693 | +0% $1,901 | +5% $2,109 | +10% $2,318 |
| Rate | -1.0pp $2,083 | -0.5pp $1,993 | base $1,901 | +0.5pp $1,808 | +1.0pp $1,713 |
3-unit breakdown (identical units grouped — click to expand)
| Units | Beds | Baths | Est. rent |
|---|---|---|---|
| 3× units | 2 | 1 | $5,268 |
| #1 | 2 | 1 | $1,756 |
| #2 | 2 | 1 | $1,756 |
| #3 | 2 | 1 | $1,756 |
| Total (3 units) | $5,269 | ||
UW: 25.0% down · 7.5% · 30yr · 1.5% tax · 5.0% vac · 8.0% maint · 8.0% mgmt
Financing live
Cash to close
- Down payment
- $90,000
- Closing costs
- $10,800
- Reserves months
- —
- Total cash needed
- —
Loan-product check · same deal, 3 products live
Conventional
25% down · 7.5% · 30yr
- Down + closing
- —
- Monthly P&I
- —
- Monthly cashflow
- —
- DSCR
- —
- Eligible?
- —
Personal DTI + credit; lowest rate.
DSCR
20% down · 8.5% · 30yr
- Down + closing
- —
- Monthly P&I
- —
- Monthly cashflow
- —
- DSCR
- —
- Eligible?
- —
No personal income docs; deal must DSCR.
Hard money
10% down · 12.0% · 12mo
- Down + closing
- —
- Monthly P&I
- —
- Monthly cashflow
- —
- DSCR
- —
- Eligible?
- —
Short-term bridge; refi at stabilization.
Listing history 12 events
-
2026-06-18days on market $360,000 Active 16 DOM
-
2026-06-17days on market $360,000 Active 15 DOM
-
2026-06-16days on market $360,000 Active 14 DOM
-
2026-06-15days on market $360,000 Active 13 DOM
-
2026-06-14days on market $360,000 Active 11 DOM
-
2026-06-10days on market $360,000 Active 8 DOM
-
2026-06-09days on market $360,000 Active 7 DOM
-
2026-06-08days on market $360,000 Active 6 DOM
-
2026-06-07statusdays on market $360,000 Active 5 DOM
-
2026-06-05days on market $360,000 New 2 DOM
-
2026-06-03remarks 645-char remark
-
2026-06-03$360,000 New 1 DOM
ⓘ Source: listings_history table (triggers on properties + properties_extension) + one-shot
backfill from property_details.listing_events for pre-trigger history.
Tax reassessment forecast MA · Partial reset (capped growth)
- Current annual tax
- $2,680 · $223/mo
- Projected year-2 tax
- $3,554 · $296/mo
- Expected delta
- +$874/yr (+$73/mo · 32.6%)
ⓘ Screening estimate from a state-policy table — verify with the county assessor before closing.
Climate risk First Street
- Flood 1/10 Low FEMA zone X (unshaded) · 0% chance over 30 yrs
- Wildfire 3/10 Moderate
- Heat 4/10 Moderate 7 d/yr ≥94°F today · 15 d/yr by 30 yrs out
- Wind 6/10 Major 46% chance of damaging wind over 30 yrs
- Air quality 2/10 Low 2 unhealthy d/yr today · 2 by 30 yrs out
Nearby sold comps map
Loading sold comps map…
Walkable amenities ~0.75 mi
Loading nearby amenities…
Taxation est. · year 1
- Rental income
- $63,228
- − Mortgage interest
- −$20,166
- − Property taxes
- −$2,680
- − Insurance
- −$1,800
- − Repairs & maintenance
- −$5,058
- − Management
- −$5,058
- − Depreciation
- −$10,473
- Taxable income
- $17,993
- Est. tax owed @ 24.0%
- −$4,318
- After-tax cash flow
- $18,497/yr
For passive investors: Depreciation is non-cash, so a rental often shows a tax loss while cash-flowing — sheltering income. Rental losses are passive: they offset passive income freely, and up to $25,000/yr can offset ordinary (W-2) income if you actively participate and your MAGI is under $100k (phasing out to $0 by $150k); unused losses carry forward. On sale, claimed depreciation is recaptured at up to 25%, and gains may owe capital-gains tax (a 1031 exchange can defer both). Figures are a year-1 estimate at your 24.0% rate — not tax advice; consult a CPA.
Schools (NCES district)
- District
- Webster
- NCES district ID
- 2512240
- Math proficiency
- 15% ▼ -10.00%
- Reading proficiency
- 28% ▼ -3.00%
- Median HH income
- $49,939
- Composite
- 19.1/100
- National rank
- #8837
- State rank
- #286 of 302 in MA
Livability — Webster
- Score
- 65/100
- State rank
- #183
- US rank
- #13047
Category grades
Schools grade is shown separately in the Schools card above.
Census & demographics
- Census place
- Webster, MA
- County
- Worcester County · 487,911 people
- City population
- 17,748
- Metro
- Worcester, MA-CT
- Population (ZIP)
- 17,748
- Household income
- $72,895
- Rent vs Own
- Severe rent burden
- 690.0
Population outlook (Worcester County) Hauer SSP2
- Today (2025)
- 850,858 people
- By 2030
- 860,403 · +1.1%
- By 2040
- 869,902 · +2.2%
- By 2050
- 869,110 · +2.1%
- By 2075
- 870,120 · +2.3%
- By 2100
- 829,703 · -2.5%
Race, ethnicity, and origin ACS 2023
- Neighborhood character
- Predominantly White (71%)
- Race & ethnicity
- White 71% Hispanic / Latino 19% Two or more races 9% Black 5% Asian 2%
- Hispanic origin (detail)
- Puerto Rican 13% Cuban 1% Dominican 2%
- Common ancestry
- Romanian 14% Lithuanian 12% Slovak 2%
- Foreign-born
- 10% · Canada, China, Vietnam
- Languages at home
- 80% English-only · Spanish 13% Russian/Polish/Slavic 3% Other Indo-European 1%
Political lean MEDSL · Worcester
- 2024 margin
- D (+10.0) · D 53.9% · R 43.9% · Other 2.2%
- 2008→2024 swing
- -3.8pp toward R · 2008: 13.8pp · 2024: 10.0pp
- All cycles
- 2024: D+10.0 2020: D+17.8 2016: D+10.5 2012: D+9.2 2008: D+13.8
Not yet ingested
- Civics
- —
Market trends
- HPI YoY
- ▲ 101.75%
- Current HPI
- 598.587
- Rent YoY
- —
- Metro
- Worcester, MA-CT
- State GDP YoY
- ▲ 2.28%
- F500 in state
- 38
Industry mix (Fortune 500 HQ in MA)
| Industry | F500 HQs | Revenue |
|---|---|---|
| Technology | 3 | $17B |
|
||
| Insurance | 2 | $84B |
|
||
| Retail | 2 | $76B |
|
||
| Life Sciences | 1 | $43B |
|
||
| Energy Technology | 1 | $31B |
|
||
| Aerospace / Defense | 1 | $18B |
|
||
Price history
1 event — show timeline
- 2026-06-02 Listed $360,000 MLS PIN
Property tax history
+3.1%/yrLatest (2023): $2,680 · +1.8% YoY. Source: county tax records.
Cash-flow waterfall
monthlySold comps — $/sqft
last 12 mo · ≤1 miLoading sold comps…