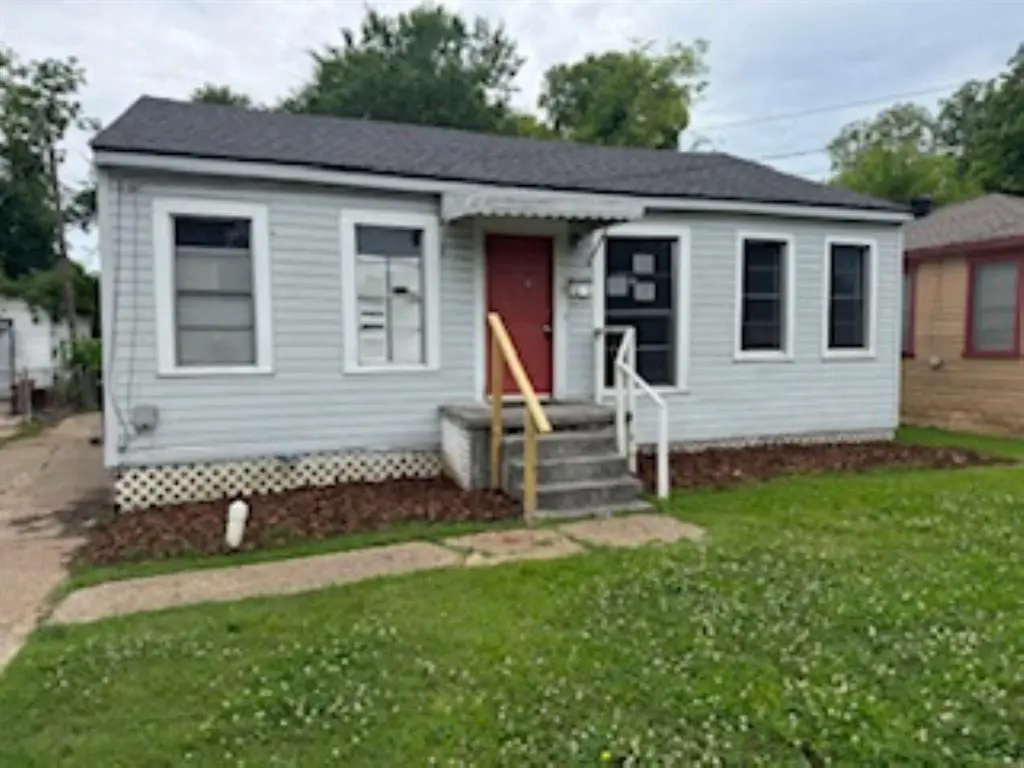
2538 Northside Dr · Bossier City, LA
Flood risk 1/10 · Minimal
- FEMA flood zone
- X (unshaded)
- Chance of flooding over 30 yrs
- 0.0%
- Est. flood insurance / yr
- $507 – $1,088
Fire risk 1/10 · Minimal
- Est. fire insurance / yr
- $1,269 – $2,357
Heat risk 7/10 · Major
- Hot days now (above 110°F)
- 7 days/yr
- Hot days in 30 yrs
- 21 days/yr
Wind risk 6/10 · Moderate
- Chance of severe wind over 30 yrs
- 63.0%
Air-quality risk 2/10 · Minimal
- Unhealthy air days now
- 1 days/yr
- Unhealthy air days in 30 yrs
- 2 days/yr
Risk factors via First Street. Map © Google.
Why this score? — see what drove the B+ grade
The composite is a weighted blend of 9 inputs, each scored 0–100. Each bar is that input's sub-score; the figure is the points it added to the 100-point composite (weight × sub-score).
- Cash flow +30.0/30.0
- ARV discount +15.0/15.0
- 1% rule +10.0/10.0
- DSCR +10.0/10.0
- Rent growth +4.1/5.0
- Schools +3.8/10.0
- Livability +3.6/5.0
- Condition / age +2.5/5.0
- Appreciation +0.0/10.0
$74,900
🖨 Deal sheet 📄 Offer letter ✓ Due diligence
Listing remarks
Two bedroom home with an additional room that may be used as an office or bedroom. Laundry room located in the kitchen. First Look period expires July 15, 2026. Owner-occupant offers will be reviewed and considered during the First Look period. Investor offers may be submitted at any time but will not be reviewed or considered until after the First Look period has expired. Please allow 2 to 3 business days for a response to offers. All offers must include a pre-qualification letter or proof of funds.
Key facts
- 8,712 sq ft lot
- Built 1959
- Listed 31 days
Property features AI
Finance
- Financial info: Listed as HUD owned; Treat As Clear loan type; No second mortgage indicated
- HOA & community: No HOA/association
Exterior
- Parking: Concrete driveway; No garage; No covered or carport spaces
- Utilities: Cable available; City sewer; City water; Electricity available; Individual gas meter; Individual water meter; Natural gas available; Overhead utilities; Phone available
- Home design: Single-family residence; One story; Residential property
- Construction: Built in 1959
- Exterior features: Lot under 0.5 acre (approximately 0.20 acre); Located in the Northside Add subdivision
Interior
- Kitchen: Gas range
- Bedrooms: 2 bedrooms (both on the main level); Primary bedroom on the main level
- Bathrooms: 1 full bathroom; 1 half bathroom
- Interior features: High-speed internet available; 4 total rooms; One living area; One dining area
Neighborhood map
What this means for you Summary
Snapshot
- This is a 2-bed/1.5-bath single-family listed at $75k.
Deal economics
- At list price, monthly cash flow is $526 ($6k/yr) — positive.
- The deal already cash-flows at list — no discount required.
- Meets the 1% rule at list price ($1k rent vs $75k).
- Recommended offer: $73k (3.0% below list) — sets the bar for market timing.
- Cap rate 14.7% vs local median 4.7% in Bossier City — top-decile yield for the area; either an underpriced asset or a hidden risk that comps aren't pricing in. Stress-test before assuming the spread holds.
Location & tenants
- Location reads 71/100 on livability (#47 in LA) — a middle-class / working-renter tenant base. Strengths: commute A+, cost of living A+, housing A+; Watch: employment D+, crime F, amenities F.
- Bossier Parish (urban): math 40% / reading 47% proficiency, ranked #17 of 98 in LA (top 17%) — families likely to look elsewhere, expect single-tenant / working-renter base with shorter leases.
- Market conditions: Rents rising fast (+6.6%/yr); 421 active listings in the ZIP; 12 comparable units currently listed for rent nearby; rentals at typical pace (median 21d on market — plan ~3-4 weeks tenant-placement turnaround); 716 units permitted in Bossier Parish in 2024 (0 in 5+ unit buildings).
Forward outlook
- Local home prices are declining (-3.0%/yr); year-one equity from $518 of loan paydown is wiped out by about $2k of value loss. Plan a longer hold.
- Bossier County population projected at +28% by 2050 — long-run rental-demand tailwind backs the buy-and-hold thesis.
- At projected returns (-3.0% appreciation + 6.6% rent growth), your $21k cash investment doubles in ~4 years — after that, you're playing with house money.
Negotiation context
- It's been on market 31 days — a 3% lower offer ($73k) is reasonable based on typical stale-listing flexibility.
- 2 sale attempts since 2y ago with the ask held roughly flat each time — persistent listings suggest the price (not the market) is what's stuck; bring a comps-based counter.
- Current owner paid $30k; list at $75k implies a 150% gain — meaningful room to come down on a strong offer.
Risks & watch-outs
- Watch-outs: built in 1959 — expect roof / HVAC / electrical / plumbing capex.
- Climate carrying-cost: major wind risk, 63% chance of damaging wind over 30y; extreme-heat days projected 7→21/yr by 2055 (HVAC capex compounding) — expect insurance premiums to compound above CPI over the hold.
Questions for the listing agent
- It's been on market 31 days. Have you received any prior offers? Is the seller open to a 3% concession, seller financing, or rate buy-down credit?
- Built in 1959 — when were the roof, HVAC, electrical panel, plumbing, and water heater last replaced?
- Is there a deadline driving the sale (1031 exchange, divorce, estate, relocation)? That informs how much negotiation room exists.
- Schools are B-rated — typically a magnet for longer-tenancy family renters. What's the average tenant stay here, and is there a school-zone premium baked into asking?
- Crime grade is F in this area — have there been break-ins, vandalism, or insurance claims at this property in the last 3 years? What carrier currently insures it and at what premium?
- What's the average days-on-market for RENTAL listings here right now (not sales)? A rising rental-DOM trend means longer vacancies and softer asking-rent achievability than the comps imply.
- What's the recent tenant-quality profile in this submarket — average credit score on applications, eviction rate, late-payment / NSF rate, and stable-employment percentage? A property-management company in the area should have these aggregated.
- How much new for-sale + rental construction is in the pipeline within 1–3 miles? Heavy new supply typically softens prices + rents 12–24 months out; constrained supply supports both.
Investment metrics
- 1% rule
- 1.68% ✓
- Cap rate
- 14.72%
- Cash-on-cash
- 30.10%
- DSCR
- 2.34
- GRM
- 5.0
CMA / ARV
- ARV (on-the-fly)
- $128,481
- Comps found
- 12
Show comp detail 12 sales within ~0.75 mi
| Address | Dist | Beds/Ba | Sqft | Sold | Price | $/sf | Match |
|---|---|---|---|---|---|---|---|
| 2600 Bardot Ln | 0.08mi | 3/1.0 (+1) | 1,125 (-1%) | 3mo | $124,900 | $111 | 85 |
| 2416 Broadway Dr | 0.29mi | 3/1.0 (+1) | 1,125 (-1%) | 3mo | $124,800 | $111 | 75 |
| 2420 Northside Dr | 0.27mi | 3/1.0 (+1) | 1,077 (-5%) | 1mo | $110,000 | $102 | 71 |
| 3007 Gaines St | 0.56mi | 3/1.0 (+1) | 1,142 (+0%) | 1mo | $131,229 | $115 | 66 |
| 1536 James St | 0.23mi | 3/1.0 (+1) | 1,250 (+10%) | 3mo | $127,386 | $102 | 64 |
| 2425 Douglas Dr | 0.38mi | 3/1.0 (+1) | 1,206 (+6%) | 6mo | $149,999 | $124 | 60 |
| 2406 Waverly Dr | 0.47mi | 3/1.5 (+1) | 1,258 (+11%) | 0mo | $169,900 | $135 | 55 |
| 2400 Broadway Dr | 0.34mi | 3/1.0 (+1) | 1,295 (+14%) | 0mo | $164,999 | $127 | 54 |
| 1509 James St | 0.36mi | 3/1.0 (+1) | 1,284 (+13%) | 2mo | $70,000 | $55 | 53 |
| 2804 Hood Dr | 0.60mi | 3/1.0 (+1) | 1,027 (-10%) | 3mo | $107,000 | $104 | 46 |
| 2408 Belle Grove Dr | 0.49mi | 3/2.0 (+1) | 1,305 (+15%) | 3mo | $169,900 | $130 | 43 |
| 1105 Len St | 0.56mi | 3/2.0 (+1) | 1,300 (+14%) | 4mo | $147,400 | $113 | 40 |
Match score weights: distance 35% · size 25% · config 20% · recency 20%. Top-matched comps best support the ARV.
Projected returns pro-forma
-3.0% appreciation · 6.56% rent growth · sell at horizon
- IRR
- 28.5%
- Equity multiple
- 2.24×
- Total profit
- $26,032
- Equity at exit
- $11,168
- IRR
- 37.9%
- Equity multiple
- 5.12×
- Total profit
- $86,407
- Equity at exit
- $6,476
Cash invested: $20,972 (down + closing). Projections, not guarantees.
Landlord ↔ Tenant lean methodology
- Overall (STATE)
- 90 Strongly Landlord-Friendly
- State Louisiana
- 90 Strongly Landlord-Friendly · R+12
- County
- — inherits STATE
- City
- — inherits STATE
ZIP-level market 71111
- Home prices YoY
- -34.8%
- Rents YoY
- 6.6%
- Active inventory
- 421
- Price-to-rent
- 5.0×
Monthly cashflow live
- Estimated rent
- $1,260 high interval (Pro) →
- Mortgage (P&I)
- −$393
- Tax from tax record
- −$45 /mo · $542/yr
- Insurance
- −$31
- HOA
- −$0
- Vacancy / Maint / Mgmt
- −$265
- Net cashflow
- $526
Break-even live
UW: 25.0% down · 7.5% · 30yr · 1.5% tax · 5.0% vac · 8.0% maint · 8.0% mgmt
Financing live
Cash to close
- Down payment
- $18,725
- Closing costs
- $2,247
- Reserves months
- —
- Total cash needed
- —
Loan-product check · same deal, 3 products live
Conventional
25% down · 7.5% · 30yr
- Down + closing
- —
- Monthly P&I
- —
- Monthly cashflow
- —
- DSCR
- —
- Eligible?
- —
Personal DTI + credit; lowest rate.
DSCR
20% down · 8.5% · 30yr
- Down + closing
- —
- Monthly P&I
- —
- Monthly cashflow
- —
- DSCR
- —
- Eligible?
- —
No personal income docs; deal must DSCR.
Hard money
10% down · 12.0% · 12mo
- Down + closing
- —
- Monthly P&I
- —
- Monthly cashflow
- —
- DSCR
- —
- Eligible?
- —
Short-term bridge; refi at stabilization.
Rent comps 12 comps
| Address | Beds | Baths | Sqft | Rent | $/sqft | DOM | Units | Dist |
|---|---|---|---|---|---|---|---|---|
| 1525 Debra St Bossier City, LA | 3.0 | 1.0 | 1033 | $975 | $0.94 | 21d | 1 | 0.26mi |
| 1518 Viosca St Bossier City, LA | 3.0 | 2.0 | 1434 | $1,200 | $0.84 | 21d | 1 | 0.30mi |
| 2400 Broadway Dr Bossier City, LA | 3.0 | 1.0 | 1295 | $1,450 | $1.12 | 13d | 1 | 0.35mi |
| 3009 Gaines St Bossier City, LA | 3.0 | 1.0 | 1060 | $1,200 | $1.13 | 21d | 1 | 0.56mi |
| 1005 Clarence St Bossier City, LA | 3.0 | 2.0 | 1203 | $1,300 | $1.08 | 43d | 1 | 0.56mi |
| 2804 Hood Dr Bossier City, LA | 3.0 | 1.0 | 1027 | $1,250 | $1.22 | 13d | 1 | 0.59mi |
| 2579 Airline Dr Bossier City, LA | 1.0–2.0 | 1.0–1.5 | 847 | $1,213 | $1.43 | 13d | 6 | 0.78mi |
| 2601 Airline Dr Bossier City, LA | 1.0–2.0 | 1.0–2.0 | 746 | $1,510 | $2.02 | 13d | 10 | 0.91mi |
| 1820 E Texas St Bossier City, LA | 2.0 | 1.0 | 750 | $850 | $1.13 | 43d | 1 | 1.08mi |
| 3325 E Texas St Bossier City, LA | 1.0–2.0 | 1.0–2.0 | 810 | $950 | $1.17 | 21d | 1 | 1.17mi |
| 2604 Benton Rd Bossier City, LA | 1.0 | 1.0 | 713 | $1,160 | $1.63 | 13d | 1 | 1.22mi |
| 400 Preston Blvd Bossier City, LA | 1.0 | 1.0 | 706 | $870 | $1.23 | 43d | 1 | 1.27mi |
Listing history 20 events
-
2026-06-18days on market $74,900 Active 31 DOM
-
2026-06-17days on market $74,900 Active 30 DOM
-
2026-06-16days on market $74,900 Active 29 DOM
-
2026-06-15days on market $74,900 Active 28 DOM
-
2026-06-14days on market $74,900 Active 26 DOM
-
2026-06-13days on market $74,900 Active 25 DOM
-
2026-06-10days on market $74,900 Active 23 DOM
-
2026-06-09days on market $74,900 Active 22 DOM
-
2026-06-08days on market $74,900 Active 21 DOM
-
2026-06-07days on market $74,900 Active 20 DOM
-
2026-06-03remarks 505-char remark
-
2026-06-02days on market $74,900 Active 15 DOM
-
2026-06-01days on market $74,900 Active 14 DOM
-
2026-05-31days on market $74,900 Active 13 DOM
-
2026-05-30days on market $74,900 Active 12 DOM
-
2026-05-15$74,900 Active
-
2024-07-24status Pending
-
2024-07-24historical
-
2024-07-23$49,900 Active
-
1995-07-12soldstatus $30,000
ⓘ Source: listings_history table (triggers on properties + properties_extension) + one-shot
backfill from property_details.listing_events for pre-trigger history.
Tax reassessment forecast LA · Resets to sale price
- Current annual tax
- $542 · $45/mo
- Projected year-2 tax
- $542 · $45/mo
- Expected delta
- $0/yr ($0/mo · 0.0%)
ⓘ Screening estimate from a state-policy table — verify with the county assessor before closing.
Climate risk First Street
- Flood 1/10 Low FEMA zone X (unshaded) · 0% chance over 30 yrs
- Wildfire 1/10 Low
- Heat 7/10 Severe 7 d/yr ≥110°F today · 21 d/yr by 30 yrs out
- Wind 6/10 Major 63% chance of damaging wind over 30 yrs
- Air quality 2/10 Low 1 unhealthy d/yr today · 2 by 30 yrs out
Nearby sold comps map
Loading sold comps map…
Walkable amenities ~0.75 mi
Loading nearby amenities…
Taxation est. · year 1
- Rental income
- $15,118
- − Mortgage interest
- −$4,196
- − Property taxes
- −$542
- − Insurance
- −$374
- − Repairs & maintenance
- −$1,209
- − Management
- −$1,209
- − Depreciation
- −$2,179
- Taxable income
- $5,408
- Est. tax owed @ 24.0%
- −$1,298
- After-tax cash flow
- $5,015/yr
For passive investors: Depreciation is non-cash, so a rental often shows a tax loss while cash-flowing — sheltering income. Rental losses are passive: they offset passive income freely, and up to $25,000/yr can offset ordinary (W-2) income if you actively participate and your MAGI is under $100k (phasing out to $0 by $150k); unused losses carry forward. On sale, claimed depreciation is recaptured at up to 25%, and gains may owe capital-gains tax (a 1031 exchange can defer both). Figures are a year-1 estimate at your 24.0% rate — not tax advice; consult a CPA.
Schools (NCES district)
- District
- Bossier Parish
- NCES district ID
- 2200270
- Math proficiency
- 40% ▼ -32.00%
- Reading proficiency
- 47% ▼ -28.00%
- Median HH income
- $51,326
- Composite
- 37.5/100
- National rank
- #4402
- State rank
- #17 of 98 in LA
Livability — Bossier City
- Score
- 71/100
- State rank
- #47
- US rank
- #7044
Category grades
Schools grade is shown separately in the Schools card above.
Census & demographics
- Census place
- Bossier City, LA
- County
- Bossier Parish · 98,704 people
- City population
- 91,925
- Metro
- Shreveport-Bossier City, LA
- Population (ZIP)
- 43,925
- Household income
- $65,292
- Rent vs Own
- Severe rent burden
- 1942.0
Population outlook (Bossier County) Hauer SSP2
- Today (2025)
- 143,247 people
- By 2030
- 151,802 · +6.0%
- By 2040
- 168,194 · +17.4%
- By 2050
- 183,533 · +28.1%
- By 2075
- 217,009 · +51.5%
- By 2100
- 230,091 · +60.6%
Race, ethnicity, and origin ACS 2023
- Neighborhood character
- Diverse neighborhood (Simpson 0.60)
- Race & ethnicity
- White 56% Black 29% Hispanic / Latino 9% Two or more races 8% Asian 3%
- Hispanic origin (detail)
- Mexican 5%
- Common ancestry
- Lithuanian 2% Iranian 1% Slovak 1%
- Foreign-born
- 5% · Canada, Vietnam
- Languages at home
- 90% English-only · Spanish 7% Vietnamese 1% French/Haitian/Cajun 1%
Political lean MEDSL · Bossier
- 2024 margin
- Solid R (+43.3) · D 27.7% · R 71.0% · Other 1.3%
- 2008→2024 swing
- +0.3pp no change · 2008: -43.7pp · 2024: -43.3pp
- All cycles
- 2024: R+43.3 2020: R+41.0 2016: R+45.8 2012: R+45.4 2008: R+43.7
Not yet ingested
- Civics
- —
Market trends
- HPI YoY
- ▼ -79.78%
- Current HPI
- 149.4336
- Rent YoY
- ▲ 6.56%
- Metro
- Shreveport-Bossier City, LA
- State GDP YoY
- ▲ 3.29%
- F500 in state
- 10
Industry mix (Fortune 500 HQ in LA)
| Industry | F500 HQs | Revenue |
|---|---|---|
| Telecommunications | 2 | $23B |
|
||
| Utilities | 1 | $12B |
|
||
| Wholesale / Distribution | 1 | $5B |
|
||
| Advertising | 1 | $2B |
|
||
Price history
+149.7% since first listed5 events — show timeline
- 2026-05-15 Listed $74,900 NTREIS
- 2024-07-24 Pending — NTREIS
- 2024-07-24 Listing Removed — NTREIS
- 2024-07-23 Listed $49,900 NTREIS
- 1995-07-12 Sold (Public Records) $30,000 Public Records
Property tax history
+13.9%/yrLatest (2025): $542 · -1.3% YoY. Source: county tax records.
Cash-flow waterfall
monthlySold comps — $/sqft
last 12 mo · ≤1 miLoading sold comps…