1465 East Shore Dr · Lansing, NY
Flood risk 5/10 · Moderate
- FEMA flood zone
- X
- Chance of flooding over 30 yrs
- 0.47%
- Est. flood insurance / yr
- $473 – $860
Fire risk 1/10 · Minimal
- Est. fire insurance / yr
- $691 – $1,283
Heat risk 2/10 · Minimal
- Hot days now (above 93°F)
- 7 days/yr
- Hot days in 30 yrs
- 15 days/yr
Wind risk 2/10 · Minimal
- Chance of severe wind over 30 yrs
- 1.0%
Air-quality risk 2/10 · Minimal
- Unhealthy air days now
- 0 days/yr
- Unhealthy air days in 30 yrs
- 1 days/yr
Risk factors via First Street. Map © Google.
Why this score? — see what drove the B grade
The composite is a weighted blend of 9 inputs, each scored 0–100. Each bar is that input's sub-score; the figure is the points it added to the 100-point composite (weight × sub-score).
- Cash flow +28.2/30.0
- 1% rule +10.0/10.0
- DSCR +10.0/10.0
- ARV discount +7.5/15.0
- Schools +5.1/10.0
- Livability +4.2/5.0
- Rent growth +3.8/5.0
- Condition / age +2.5/5.0
- Appreciation +0.0/10.0
$150,000
🖨 Deal sheet 📄 Offer letter ✓ Due diligence
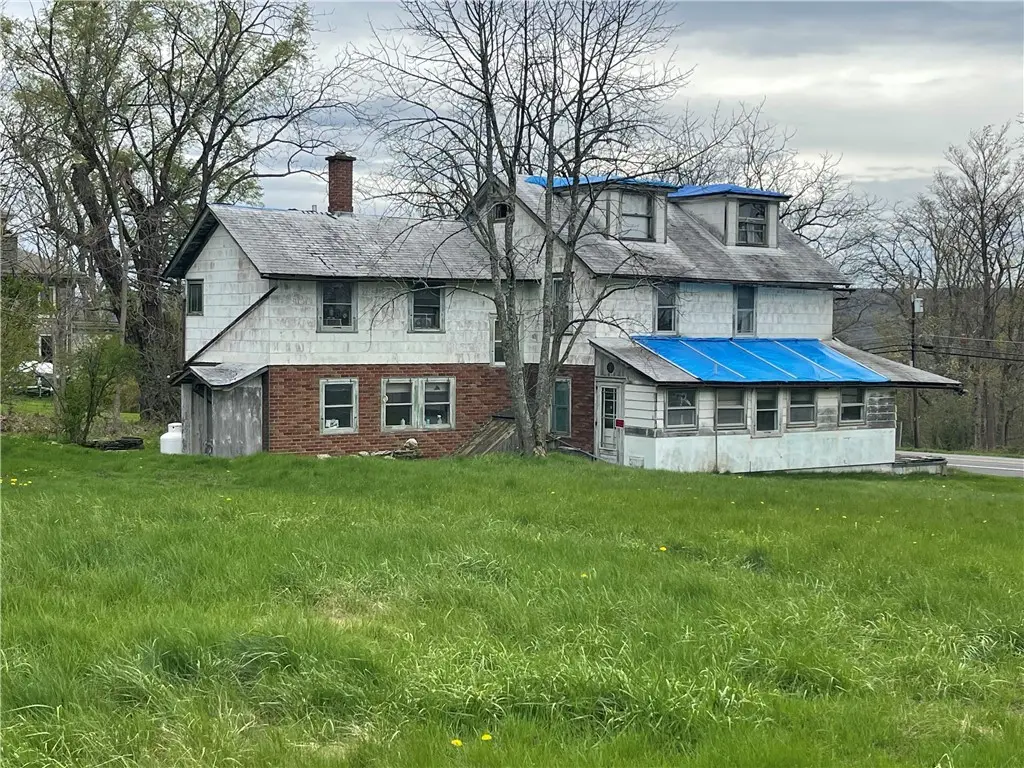
Listing remarks
This property offers a rare opportunity to create a custom home on a beautiful two-acre lot in a highly desirable location near Ithaca. With Municipal water and sewer already available, the groundwork is in place for a smooth development process. Conveniently located with easy access to Cornell University and nearby recreational areas like Myers Park and Steward Park, the property combines both accessibility and lifestyle appeal. The existing structure requires renovation, making it ideal for buyers looking to bring their own vision to life - whether through restoration or a complete redesign.
Key facts
- Municipal water
- Two acre lot
- Municipal sewer
Tags
Property features AI
Exterior
- Parking: Detached garage
- Utilities: Public water; Sewer available / Septic tank; Water connected/available; Propane available
- Home design: Single-family residence; Two levels / 2 stories
- Construction: Brick and frame construction; Stone and slab foundation
- Exterior features: Rectangular, wooded lot; Approximately 1.98 acres; Lot dimensions about 150 x 536
Interior
- Kitchen: Eat-in kitchen; Gas water heater
- Flooring: Hardwood; Varied flooring
- Bathrooms: 1 full bathroom; 1 half bathroom; 1 main-level bathroom
- Heating & cooling: Oil heating; Hot water/steam heat
- Interior features: Entrance foyer; Eat-in kitchen; 3 total rooms
- Laundry & utility: Main-level laundry room
Neighborhood map
What this means for you Summary
Snapshot
- This is a 3-bed/1.5-bath single-family listed at $150k.
Deal economics
- At list price, monthly cash flow is $478 ($6k/yr) — positive.
- The deal already cash-flows at list — no discount required.
- Meets the 1% rule at list price ($2k rent vs $150k).
Location & tenants
- Location reads 83/100 on livability (#67 in NY, #1,006 nationally) — a professional / high-income tenant draw. Strengths: crime A+, commute A+, employment A+; Watch: amenities F, cost of living F.
- Lansing Central School District (rural): math 53% / reading 62% proficiency, ranked #244 of 590 in NY (top 41%) — acceptable for families but not a draw, mixed tenant base, ~2y average lease; only 19% free/reduced lunch — higher-income household profile.
- Zoned schools: Raymond C Buckley Elementary School (math 37% / reading 67%, grade C-, #988 of 2,108 statewide, top 49%, 405 students, 32% FRL).
- Market conditions: Rents rising fast (+5.2%/yr); 327 active listings in the ZIP; 382 units permitted in Tompkins County in 2024 (208 in 5+ unit buildings).
- This rent runs 39% of the median local income ($71k/yr) — at the standard rent-burdened threshold; future hikes will face affordability resistance.
Forward outlook
- Local home prices are declining (-3.0%/yr); year-one equity from $1k of loan paydown is wiped out by about $4k of value loss. Plan a longer hold.
- Tompkins County population projected at +17% by 2050 — long-run rental-demand tailwind backs the buy-and-hold thesis.
- At projected returns (-3.0% appreciation + 5.2% rent growth), your $42k cash investment doubles in ~7 years — after that, you're playing with house money.
Negotiation context
- Only 13 days on market — expect competitive offers; lowballing is unlikely to land.
- Current owner paid $72k; list at $150k implies a 107% gain — meaningful room to come down on a strong offer.
Risks & watch-outs
- Watch-outs: property tax is 3.9% of price; built in 1837 — expect roof / HVAC / electrical / plumbing capex.
- Climate carrying-cost: moderate flood risk — expect insurance premiums to compound above CPI over the hold.
Questions for the listing agent
- Built in 1837 — when were the roof, HVAC, electrical panel, plumbing, and water heater last replaced?
- Property tax is high relative to price — has the assessment been appealed recently, and will the sale trigger a re-assessment?
- Is there a deadline driving the sale (1031 exchange, divorce, estate, relocation)? That informs how much negotiation room exists.
- Schools are A-rated — typically a magnet for longer-tenancy family renters. What's the average tenant stay here, and is there a school-zone premium baked into asking?
- What's the average days-on-market for RENTAL listings here right now (not sales)? A rising rental-DOM trend means longer vacancies and softer asking-rent achievability than the comps imply.
- What's the recent tenant-quality profile in this submarket — average credit score on applications, eviction rate, late-payment / NSF rate, and stable-employment percentage? A property-management company in the area should have these aggregated.
- How much new for-sale + rental construction is in the pipeline within 1–3 miles? Heavy new supply typically softens prices + rents 12–24 months out; constrained supply supports both.
Investment metrics
- 1% rule
- 1.53% ✓
- Cap rate
- 10.12%
- Cash-on-cash
- 13.65%
- DSCR
- 1.61
- GRM
- 5.4
CMA / ARV
- ARV (on-the-fly)
- $845,826
- Comps found
- 1
Show comp detail 1 sale within ~0.75 mi
| Address | Dist | Beds/Ba | Sqft | Sold | Price | $/sf | Match |
|---|---|---|---|---|---|---|---|
| 56 Burdick Hill Rd | 0.26mi | 4/2.5 (+1) | 2,170 (-6%) | 3mo | $795,000 | $366 | 66 |
Match score weights: distance 35% · size 25% · config 20% · recency 20%. Top-matched comps best support the ARV.
Projected returns pro-forma
-3.0% appreciation · 5.22% rent growth · sell at horizon
- IRR
- 6.9%
- Equity multiple
- 1.28×
- Total profit
- $11,591
- Equity at exit
- $22,365
- IRR
- 18.5%
- Equity multiple
- 2.73×
- Total profit
- $72,678
- Equity at exit
- $12,969
Cash invested: $42,000 (down + closing). Projections, not guarantees.
Landlord ↔ Tenant lean methodology
- Overall (STATE)
- 15 Strongly Tenant-Friendly
- State New York
- 15 Strongly Tenant-Friendly · D+10
- County
- — inherits STATE
- City
- — inherits STATE
ZIP-level market 14850
- Rents YoY
- 5.2%
- Active inventory
- 327
- Price-to-rent
- 5.4×
Monthly cashflow live
- Estimated rent
- $2,295 medium interval (Pro) →
- Mortgage (P&I)
- −$787
- Tax from tax record
- −$486 /mo · $5,835/yr
- Insurance
- −$62
- HOA
- −$0
- Vacancy / Maint / Mgmt
- −$482
- Net cashflow
- $478
Break-even live
UW: 25.0% down · 7.5% · 30yr · 1.5% tax · 5.0% vac · 8.0% maint · 8.0% mgmt
Financing live
Cash to close
- Down payment
- $37,500
- Closing costs
- $4,500
- Reserves months
- —
- Total cash needed
- —
Loan-product check · same deal, 3 products live
Conventional
25% down · 7.5% · 30yr
- Down + closing
- —
- Monthly P&I
- —
- Monthly cashflow
- —
- DSCR
- —
- Eligible?
- —
Personal DTI + credit; lowest rate.
DSCR
20% down · 8.5% · 30yr
- Down + closing
- —
- Monthly P&I
- —
- Monthly cashflow
- —
- DSCR
- —
- Eligible?
- —
No personal income docs; deal must DSCR.
Hard money
10% down · 12.0% · 12mo
- Down + closing
- —
- Monthly P&I
- —
- Monthly cashflow
- —
- DSCR
- —
- Eligible?
- —
Short-term bridge; refi at stabilization.
Listing history 3 events
-
2026-05-14status Pending
-
2026-05-01$150,000 Active
-
1995-09-25soldstatus $72,500
ⓘ Source: listings_history table (triggers on properties + properties_extension) + one-shot
backfill from property_details.listing_events for pre-trigger history.
Tax reassessment forecast NY · Partial reset (capped growth)
- Current annual tax
- $5,835 · $486/mo
- Projected year-2 tax
- $5,835 · $486/mo
- Expected delta
- $0/yr ($0/mo · 0.0%)
ⓘ Screening estimate from a state-policy table — verify with the county assessor before closing.
Climate risk First Street
- Flood 5/10 Major FEMA zone X · 47% chance over 30 yrs
- Wildfire 1/10 Low
- Heat 2/10 Low 7 d/yr ≥93°F today · 15 d/yr by 30 yrs out
- Wind 2/10 Low 100% chance of damaging wind over 30 yrs
- Air quality 2/10 Low 0 unhealthy d/yr today · 1 by 30 yrs out
Nearby sold comps map
Loading sold comps map…
Walkable amenities ~0.75 mi
Loading nearby amenities…
Taxation est. · year 1
- Rental income
- $27,543
- − Mortgage interest
- −$8,402
- − Property taxes
- −$5,835
- − Insurance
- −$750
- − Repairs & maintenance
- −$2,203
- − Management
- −$2,203
- − Depreciation
- −$4,364
- Taxable income
- $3,786
- Est. tax owed @ 24.0%
- −$909
- After-tax cash flow
- $4,826/yr
For passive investors: Depreciation is non-cash, so a rental often shows a tax loss while cash-flowing — sheltering income. Rental losses are passive: they offset passive income freely, and up to $25,000/yr can offset ordinary (W-2) income if you actively participate and your MAGI is under $100k (phasing out to $0 by $150k); unused losses carry forward. On sale, claimed depreciation is recaptured at up to 25%, and gains may owe capital-gains tax (a 1031 exchange can defer both). Figures are a year-1 estimate at your 24.0% rate — not tax advice; consult a CPA.
Schools (NCES district)
- District
- Lansing Central School District
- NCES district ID
- 3616710
- Math proficiency
- 53% ▼ -9.00%
- Reading proficiency
- 62% ▲ 2.00%
- Median HH income
- $70,215
- Composite
- 50.9/100
- National rank
- #1788
- State rank
- #244 of 590 in NY
Livability — Lansing
- Score
- 83/100
- State rank
- #67
- US rank
- #1006
Category grades
Schools grade is shown separately in the Schools card above.
Census & demographics
- Census place
- Lansing, NY
- County
- Tompkins County · 68,610 people
- Metro
- Ithaca, NY
- Population (ZIP)
- 68,610
- Household income
- $71,445
- Rent vs Own
- Severe rent burden
- 5169.0
Population outlook (Tompkins County) Hauer SSP2
- Today (2025)
- 113,958 people
- By 2030
- 118,774 · +4.2%
- By 2040
- 125,927 · +10.5%
- By 2050
- 133,599 · +17.2%
- By 2075
- 156,759 · +37.6%
- By 2100
- 169,896 · +49.1%
Race, ethnicity, and origin ACS 2023
- Neighborhood character
- Predominantly White (68%)
- Race & ethnicity
- White 68% Asian 13% Hispanic / Latino 8% Two or more races 8% Black 4%
- Hispanic origin (detail)
- Mexican 2% Puerto Rican 2%
- Common ancestry
- Romanian 3% Italian 3% Scotch-Irish 2%
- Foreign-born
- 18% · China, Canada, South Korea
- Languages at home
- 79% English-only · Chinese 5% Spanish 4% Other Indo-European 4%
Political lean MEDSL · Tompkins
- 2024 margin
- Solid D (+50.6) · D 75.3% · R 24.7%
- 2008→2024 swing
- +8.6pp toward D · 2008: 42.1pp · 2024: 50.6pp
- All cycles
- 2024: D+50.6 2020: D+49.2 2016: D+42.1 2012: D+39.8 2008: D+42.1
Not yet ingested
- Civics
- —
Market trends
- HPI YoY
- ▼ -276.59%
- Current HPI
- 389.7215
- Rent YoY
- ▲ 5.22%
- Metro
- Ithaca, NY
- State GDP YoY
- ▲ 2.60%
- F500 in state
- 92
Industry mix (Fortune 500 HQ in NY)
| Industry | F500 HQs | Revenue |
|---|---|---|
| Financial Services | 10 | $950B |
|
||
| Consumer Goods | 9 | $162B |
|
||
| Insurance | 4 | $225B |
|
||
| Telecommunications | 2 | $144B |
|
||
| Pharmaceuticals | 2 | $112B |
|
||
| Media / Entertainment | 2 | $69B |
|
||
Price history
+106.9% since first listed3 events — show timeline
- 2026-05-14 Pending — IBRMLS
- 2026-05-01 Listed $150,000 IBRMLS
- 1995-09-25 Sold (Public Records) $72,500 Public Records
Property tax history
+7.0%/yrLatest (2025): $5,835 · +4.6% YoY. Source: county tax records.
Cash-flow waterfall
monthlySold comps — $/sqft
last 12 mo · ≤1 miLoading sold comps…