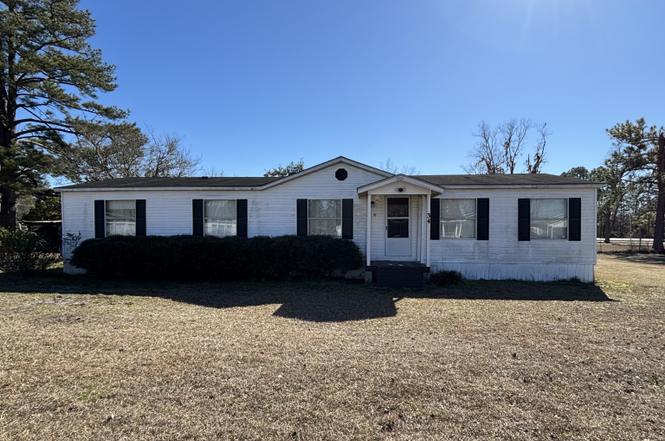
34 Kight St · Homerville, GA
Flood risk 1/10 · Minimal
- FEMA flood zone
- X (unshaded)
- Chance of flooding over 30 yrs
- 0.0%
- Est. flood insurance / yr
- $507 – $1,088
Fire risk 6/10 · Moderate
- Est. fire insurance / yr
- $963 – $1,789
Heat risk 8/10 · Major
- Hot days now (above 107°F)
- 7 days/yr
- Hot days in 30 yrs
- 20 days/yr
Wind risk 8/10 · Major
- Chance of severe wind over 30 yrs
- 99.0%
Air-quality risk 8/10 · Major
- Unhealthy air days now
- 17 days/yr
- Unhealthy air days in 30 yrs
- 21 days/yr
Risk factors via First Street. Map © Google.
Why this score? — see what drove the C grade
The composite is a weighted blend of 9 inputs, each scored 0–100. Each bar is that input's sub-score; the figure is the points it added to the 100-point composite (weight × sub-score).
- Cash flow +21.6/30.0
- ARV discount +7.5/15.0
- Appreciation +7.4/10.0
- DSCR +6.9/10.0
- 1% rule +4.3/10.0
- Livability +3.1/5.0
- Schools +2.6/10.0
- Rent growth +2.5/5.0
- Condition / age +2.5/5.0
$134,900
🖨 Deal sheet 📄 Offer letter ✓ Due diligence
Listing remarks MLS
This spacious 4 bed 2 bath mobile home sits on 0.72 acres in Homerville GA. There is 2 lots and one could be sold for Cash return or could be workspace built on it. Move In ready mobile Home is priced to sell at only $99,900. Sellers will leave some furniture, making the home "move in ready" for you and your family. This home has been took care of and loved by the sellers. This would be a great starter home or investment property for your portfolio. Call an agent today and don't let this home slip by you.
Key facts
- Fully fenced
- Laundry area
- Back porch
Tags
Property features AI
Finance
- HOA & community: No HOA; Near shopping
Exterior
- Parking: No designated parking listed
- Utilities: Public water; Public sewer (sewer connected)
- Home design: Mobile home (house structure); Single-story; Resale property; Corner city lot
- Construction: Built in 1990; Vinyl siding; Composition roof; 1792 square feet above-grade living area
- Exterior features: Front porch; Fenced yard; Workshop on the property
Interior
- Kitchen: Breakfast area; Microwave; Refrigerator; Stainless steel appliances
- Bedrooms: Four bedrooms on the main level
- Flooring: Laminate flooring
- Bathrooms: Two full bathrooms (both on the main level)
- Heating & cooling: Central heating; Central air conditioning
- Interior features: High ceilings; Den and family room
- Laundry & utility: Washer and dryer included; Laundry closet; Electric water heater
Neighborhood map
What this means for you Summary
Snapshot
- This is a 3-bed/2.0-bath manufactured listed at $135k.
Deal economics
- At list price, monthly cash flow is $204 ($2k/yr) — positive.
- The deal already cash-flows at list — no discount required.
- To meet the 1% rule (rent ≥ 1% of price), the offer needs to be $126k (6.8% below list).
- Recommended offer: $119k (12.0% below list) — sets the bar for market timing.
Location & tenants
- Location reads 62/100 on livability (#303 in GA) — a middle-class / working-renter tenant base. Strengths: crime A+, cost of living A+, housing A+; Watch: health & safety C-, schools F, amenities F.
- Clinch County (rural): math 34% / reading 30% proficiency, ranked #90 of 174 in GA (top 52%) — families likely to look elsewhere, expect single-tenant / working-renter base with shorter leases; 66% free/reduced lunch — lower-income household profile, screen leases tightly.
- Market conditions: 30 active listings in the ZIP.
Forward outlook
- In year one you build about $7k of equity ($933 loan paydown + $6k appreciation (4.8% local appreciation)).
- At projected returns (4.8% appreciation + 3.0% rent growth), your $38k cash investment doubles in ~4 years — after that, you're playing with house money.
- By year 5, paydown + projected appreciation supports a ~$32k cash-out refi (75% LTV) — recoverable capital for the next deal without selling this one.
Negotiation context
- It's been on market 121 days — a 12% lower offer ($119k) is reasonable based on typical stale-listing flexibility.
- 3 sale attempts since 3y ago with the ask held roughly flat each time — persistent listings suggest the price (not the market) is what's stuck; bring a comps-based counter.
- Current owner paid $85k; list at $135k implies a 59% gain — meaningful room to come down on a strong offer.
Risks & watch-outs
- Climate carrying-cost: severe wind risk, 99% chance of damaging wind over 30y; major wildfire risk; extreme-heat days projected 7→20/yr by 2055 (HVAC capex compounding) — expect insurance premiums to compound above CPI over the hold.
Questions for the listing agent
- It's been on market 121 days. Have you received any prior offers? Is the seller open to a 12% concession, seller financing, or rate buy-down credit?
- Why hasn't it sold? Are there any deal-killer items the seller is aware of (foundation, flood, title, zoning, code violations)?
- Is there a deadline driving the sale (1031 exchange, divorce, estate, relocation)? That informs how much negotiation room exists.
- Schools are F-rated, which usually means shorter tenancies and higher turnover. Who's the typical renter profile here, and what's been the actual vacancy rate?
- What's the average days-on-market for RENTAL listings here right now (not sales)? A rising rental-DOM trend means longer vacancies and softer asking-rent achievability than the comps imply.
- What's the recent tenant-quality profile in this submarket — average credit score on applications, eviction rate, late-payment / NSF rate, and stable-employment percentage? A property-management company in the area should have these aggregated.
- How much new for-sale + rental construction is in the pipeline within 1–3 miles? Heavy new supply typically softens prices + rents 12–24 months out; constrained supply supports both.
Investment metrics
- 1% rule
- 0.93% ✗
- Cap rate
- 8.11%
- Cash-on-cash
- 6.49%
- DSCR
- 1.29
- GRM
- 8.9
CMA / ARV
No comps found within radius.
Projected returns pro-forma
4.79% appreciation · 3.0% rent growth · sell at horizon
- IRR
- 17.9%
- Equity multiple
- 2.12×
- Total profit
- $42,421
- Equity at exit
- $74,739
- IRR
- 18.1%
- Equity multiple
- 4.12×
- Total profit
- $117,668
- Equity at exit
- $127,601
Cash invested: $37,772 (down + closing). Projections, not guarantees.
Landlord ↔ Tenant lean methodology
- Overall (STATE)
- 90 Strongly Landlord-Friendly
- State Georgia
- 90 Strongly Landlord-Friendly · R+3
- County
- — inherits STATE
- City
- — inherits STATE
ZIP-level market 31634
- Home prices YoY
- 2.9%
- Active inventory
- 30
- Price-to-rent
- 8.9×
Monthly cashflow live
- Estimated rent
- $1,257 medium interval (Pro) →
- Mortgage (P&I)
- −$707
- Tax from tax record
- −$25 /mo · $302/yr
- Insurance
- −$56
- HOA
- −$0
- Vacancy / Maint / Mgmt
- −$264
- Net cashflow
- $204
Break-even live
UW: 25.0% down · 7.5% · 30yr · 1.5% tax · 5.0% vac · 8.0% maint · 8.0% mgmt
Financing live
Cash to close
- Down payment
- $33,725
- Closing costs
- $4,047
- Reserves months
- —
- Total cash needed
- —
Loan-product check · same deal, 3 products live
Conventional
25% down · 7.5% · 30yr
- Down + closing
- —
- Monthly P&I
- —
- Monthly cashflow
- —
- DSCR
- —
- Eligible?
- —
Personal DTI + credit; lowest rate.
DSCR
20% down · 8.5% · 30yr
- Down + closing
- —
- Monthly P&I
- —
- Monthly cashflow
- —
- DSCR
- —
- Eligible?
- —
No personal income docs; deal must DSCR.
Hard money
10% down · 12.0% · 12mo
- Down + closing
- —
- Monthly P&I
- —
- Monthly cashflow
- —
- DSCR
- —
- Eligible?
- —
Short-term bridge; refi at stabilization.
Listing history 5 events
-
2026-06-18days on market $134,900 Active 121 DOM
-
2026-06-17statusdays on market $134,900 Active 120 DOM
-
2026-06-16days on market $134,900 Back On Market 119 DOM
-
2026-06-15remarks 699-char remark
-
2026-06-15$134,900 Back On Market 118 DOM
ⓘ Source: listings_history table (triggers on properties + properties_extension) + one-shot
backfill from property_details.listing_events for pre-trigger history.
Tax reassessment forecast GA · Resets to sale price
- Current annual tax
- $302 · $25/mo
- Projected year-2 tax
- $1,241 · $103/mo
- Expected delta
- +$939/yr (+$78/mo · 310.8%)
ⓘ Screening estimate from a state-policy table — verify with the county assessor before closing.
Climate risk First Street
- Flood 1/10 Low FEMA zone X (unshaded) · 0% chance over 30 yrs
- Wildfire 6/10 Major
- Heat 8/10 Severe 7 d/yr ≥107°F today · 20 d/yr by 30 yrs out
- Wind 8/10 Severe 99% chance of damaging wind over 30 yrs
- Air quality 8/10 Severe 17 unhealthy d/yr today · 21 by 30 yrs out
Nearby sold comps map
Loading sold comps map…
Walkable amenities ~0.75 mi
Loading nearby amenities…
Taxation est. · year 1
- Rental income
- $15,083
- − Mortgage interest
- −$7,556
- − Property taxes
- −$302
- − Insurance
- −$674
- − Repairs & maintenance
- −$1,207
- − Management
- −$1,207
- − Depreciation
- −$3,924
- Taxable income
- $212
- Est. tax owed @ 24.0%
- −$51
- After-tax cash flow
- $2,399/yr
For passive investors: Depreciation is non-cash, so a rental often shows a tax loss while cash-flowing — sheltering income. Rental losses are passive: they offset passive income freely, and up to $25,000/yr can offset ordinary (W-2) income if you actively participate and your MAGI is under $100k (phasing out to $0 by $150k); unused losses carry forward. On sale, claimed depreciation is recaptured at up to 25%, and gains may owe capital-gains tax (a 1031 exchange can defer both). Figures are a year-1 estimate at your 24.0% rate — not tax advice; consult a CPA.
Schools (NCES district)
- District
- Clinch County
- NCES district ID
- 1301260
- Math proficiency
- 34% ▲ 8.00%
- Reading proficiency
- 30% ▼ -2.00%
- Median HH income
- $31,048
- Composite
- 26.08/100
- National rank
- #7295
- State rank
- #90 of 174 in GA
Livability — Homerville
- Score
- 62/100
- State rank
- #303
- US rank
- #16493
Category grades
Schools grade is shown separately in the Schools card above.
Census & demographics
- Census place
- Homerville, GA
- Population (ZIP)
- 5,178
Population outlook (Clinch County) Hauer SSP2
- Today (2025)
- 7,052 people
- By 2030
- 7,091 · +0.6%
- By 2040
- 7,116 · +0.9%
- By 2050
- 7,170 · +1.7%
- By 2075
- 7,495 · +6.3%
- By 2100
- 7,828 · +11.0%
Race, ethnicity, and origin ACS 2023
- Neighborhood character
- Predominantly White (68%)
- Race & ethnicity
- White 68% Black 27% Two or more races 4%
- Common ancestry
- Serbian 1% Italian 1%
- Foreign-born
- 1% · Canada
- Languages at home
- 98% English-only · Spanish 2% Arabic 1%
Political lean MEDSL · Clinch
- 2024 margin
- Solid R (+51.5) · D 24.1% · R 75.7%
- 2008→2024 swing
- -26.0pp toward R · 2008: -25.6pp · 2024: -51.5pp
- All cycles
- 2024: R+51.5 2020: R+47.6 2016: R+42.5 2012: R+30.2 2008: R+25.6
Not yet ingested
- Civics
- —
Market trends
- HPI YoY
- ▲ 4.79%
- Current HPI
- 168.9842
- Rent YoY
- —
- Metro
- —
- State GDP YoY
- ▲ 2.66%
- F500 in state
- 28
Industry mix (Fortune 500 HQ in GA)
| Industry | F500 HQs | Revenue |
|---|---|---|
| Paper / Packaging | 2 | $29B |
|
||
| Retail | 1 | $160B |
|
||
| Transportation / Logistics | 1 | $91B |
|
||
| Airlines | 1 | $62B |
|
||
| Consumer Goods | 1 | $47B |
|
||
| Utilities | 1 | $25B |
|
||
Price history
+92.7% since first listed8 events — show timeline
- 2026-06-14 Relisted — GAMLS
- 2026-05-15 Delisted — GAMLS
- 2026-04-26 Contingent — GAMLS
- 2026-01-13 Listed $134,900 GAMLS
- 2023-06-15 Sold (Public Records) $85,000 Public Records
- 2023-06-08 Sold (MLS) $85,000 SEGAMLS
- 2023-02-02 Listed $99,900 SEGAMLS
- 2017-10-13 Sold (Public Records) $70,000 Public Records
Property tax history
-2.0%/yrLatest (2025): $302 · -13.4% YoY. Source: county tax records.
Cash-flow waterfall
monthlySold comps — $/sqft
last 12 mo · ≤1 miLoading sold comps…