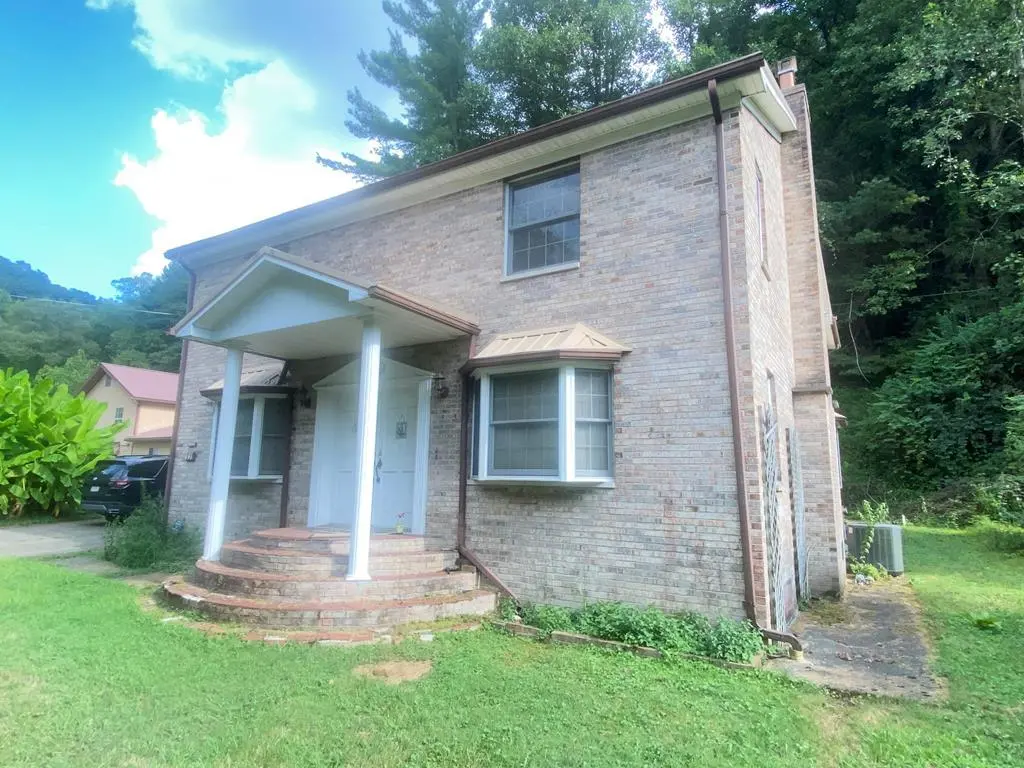
141-157 Happy Valley Rd · South Williamson, KY
Flood risk 10/10 · Severe
- FEMA flood zone
- X (unshaded)
- Chance of flooding over 30 yrs
- 0.99%
- Est. flood insurance / yr
- $473 – $860
Fire risk 6/10 · Moderate
- Est. fire insurance / yr
- $839 – $1,559
Heat risk 4/10 · Minor
- Hot days now (above 103°F)
- 7 days/yr
- Hot days in 30 yrs
- 20 days/yr
Wind risk 2/10 · Minimal
- Chance of severe wind over 30 yrs
- 1.0%
Air-quality risk 1/10 · Minimal
- Unhealthy air days now
- 0 days/yr
- Unhealthy air days in 30 yrs
- 0 days/yr
Risk factors via First Street. Map © Google.
Why this score? — see what drove the D grade
The composite is a weighted blend of 9 inputs, each scored 0–100. Each bar is that input's sub-score; the figure is the points it added to the 100-point composite (weight × sub-score).
- ARV discount +15.0/15.0
- Cash flow +7.9/30.0
- Appreciation +4.6/10.0
- Livability +3.4/5.0
- 1% rule +2.6/10.0
- Schools +2.6/10.0
- Rent growth +2.5/5.0
- Condition / age +2.5/5.0
- DSCR +1.9/10.0
$189,986
🖨 Deal sheet (PDF) 📄 Offer letter ✓ Due diligence
Listing remarks MLS
Spacious 5 Bedroom, 3 Bath Brick with a Separate 2 Bedroom Apartment situated on 3.383 Acres on Happy Valley Road in South Williamson, KY. This home is located just minutes from ARH Hospital and downtown Williamson, just 30 minutes from Pikeville and Logan. This fine home offers the perfect blend of space, comfort and convenience. It features a large living/ family area with a fireplace, formal dining room ideal for hosting gatherings, a modern kitchen ideal for preparing meals with style and ease. a bedroom and office space on the main level, upstairs are 4 more bedrooms and a study. A separate 2 Bedroom Apartment is also included.
Key facts
- 2 bedroom apartment
- Office space
- Study
Tags
Neighborhood map
What this means for you Summary
Snapshot
- This is a 5-bed/3.0-bath single-family listed at $190k.
Deal economics
- At list price, monthly cash flow is $-261 ($-3k/yr) — negative.
- To cash-flow at today's rent, offer at most $144k (24.2% below list).
- To meet the 1% rule (rent ≥ 1% of price), the offer needs to be $144k (24.3% below list).
- Recommended offer: $144k (24.3% below list) — sets the bar for 1% rule.
Location & tenants
- Location reads 68/100 on livability (#193 in KY) — a middle-class / working-renter tenant base. Strengths: crime A+, employment A+, cost of living A+; Watch: amenities F, commute F, health & safety F.
- Pike County (rural): math 24% / reading 40% proficiency, ranked #98 of 165 in KY (top 59%) — families likely to look elsewhere, expect single-tenant / working-renter base with shorter leases.
- Zoned schools: Belfry Middle School (math 27% / reading 44%, grade F, #94 of 217 statewide, top 44%, 349 students, 75% FRL) — zoned schools average 75% FRL vs 54% district-wide (21 pts higher); higher-poverty schools than district average — tighter screening recommended.
- Market conditions: 8 active listings in the ZIP; 4 units permitted in Pike County in 2024 (0 in 5+ unit buildings).
Forward outlook
- Local home prices are declining (-0.8%/yr); year-one equity from $1k of loan paydown is wiped out by about $2k of value loss. Plan a longer hold.
- Pike County population projected at -33% by 2050 — secular population decline; favor cash flow + early exit over multi-decade hold.
Negotiation context
- It's been on market 294 days — a 12% lower offer ($167k) is reasonable based on typical stale-listing flexibility.
- 2 sale attempts; this cycle's ask has dropped $35k (15%) from the opening price — seller is motivated, your offer sets the floor, not the list.
Risks & watch-outs
- Watch-outs: flood insurance adds $56/mo.
- Climate carrying-cost: severe flood risk; major wildfire risk — expect insurance premiums to compound above CPI over the hold.
Questions for the listing agent
- What do current leases actually rent for vs. the listed asking? Can we see a recent rent roll and the last 12 months of T-12 income?
- It's been on market 294 days. Have you received any prior offers? Is the seller open to a 24% concession, seller financing, or rate buy-down credit?
- What's the actual annual flood-insurance premium (NFIP or private), and is the property in a SFHA with mandatory coverage?
- Why hasn't it sold? Are there any deal-killer items the seller is aware of (foundation, flood, title, zoning, code violations)?
- Is there a deadline driving the sale (1031 exchange, divorce, estate, relocation)? That informs how much negotiation room exists.
- Schools are F-rated, which usually means shorter tenancies and higher turnover. Who's the typical renter profile here, and what's been the actual vacancy rate?
- The area grade is low — what's the realistic commute time and amenity access for the typical tenant pool here? Any planned neighborhood developments (good or bad) we should know about?
- What's the average days-on-market for RENTAL listings here right now (not sales)? A rising rental-DOM trend means longer vacancies and softer asking-rent achievability than the comps imply.
- What's the recent tenant-quality profile in this submarket — average credit score on applications, eviction rate, late-payment / NSF rate, and stable-employment percentage? A property-management company in the area should have these aggregated.
- How much new for-sale + rental construction is in the pipeline within 1–3 miles? Heavy new supply typically softens prices + rents 12–24 months out; constrained supply supports both.
Investment metrics
- 1% rule
- 0.76% ✗
- Cap rate
- 5.00%
- Cash-on-cash
- -4.63%
- DSCR
- 0.79
- GRM
- 11.0
CMA / ARV
- ARV (median comp)
- $275,898
- List price
- $189,986
- Delta
- -31.14%
- Verdict
- UNDERPRICED
- Comps
- 2 within 1.0 mi
Show comp detail 1 sale within ~0.75 mi
| Address | Dist | Beds/Ba | Sqft | Sold | Price | $/sf | Match |
|---|---|---|---|---|---|---|---|
| 524 Central Ave | 0.31mi | 4/2.0 (-1) | 3,007 (+0%) | 9mo | $345,000 | $115 | 68 |
Match score weights: distance 35% · size 25% · config 20% · recency 20%. Top-matched comps best support the ARV.
Projected returns pro-forma
-0.85% appreciation · 3.0% rent growth · sell at horizon
- IRR
- -12.8%
- Equity multiple
- 0.44×
- Total profit
- $-29,587
- Equity at exit
- $47,186
- IRR
- -6.1%
- Equity multiple
- 0.43×
- Total profit
- $-30,076
- Equity at exit
- $50,686
Cash invested: $53,196 (down + closing). Projections, not guarantees.
Landlord ↔ Tenant lean methodology
- Overall (STATE)
- 83 Strongly Landlord-Friendly
- State Kentucky
- 83 Strongly Landlord-Friendly · R+16
- County
- — inherits STATE
- City
- — inherits STATE
ZIP-level market 41503
- Home prices YoY
- -0.6%
- Active inventory
- 8
- Price-to-rent
- 11.0×
Monthly cashflow live
- Estimated rent
- $1,438 medium interval (Pro) →
- Mortgage (P&I)
- −$996
- Tax from tax record
- −$265 /mo · $3,184/yr
- Insurance
- −$79
- Flood insurance flood zone
- −$56 /mo · $666/yr
- HOA
- −$0
- Vacancy / Maint / Mgmt
- −$302
- Net cashflow
- $-261
Break-even live
Sensitivity live
| Price | -10% $-153 | -5% $-207 | +0% $-261 | +5% $-314 | +10% $-368 |
|---|---|---|---|---|---|
| Rent | -10% $-374 | -5% $-317 | +0% $-261 | +5% $-204 | +10% $-147 |
| Rate | -1.0pp $-165 | -0.5pp $-212 | base $-261 | +0.5pp $-310 | +1.0pp $-360 |
UW: 25.0% down · 7.5% · 30yr · 1.5% tax · 5.0% vac · 8.0% maint · 8.0% mgmt
Financing live
Cash to close
- Down payment
- $47,496
- Closing costs
- $5,700
- Reserves months
- —
- Total cash needed
- —
Loan-product check · same deal, 3 products live
Conventional
25% down · 7.5% · 30yr
- Down + closing
- —
- Monthly P&I
- —
- Monthly cashflow
- —
- DSCR
- —
- Eligible?
- —
Personal DTI + credit; lowest rate.
DSCR
20% down · 8.5% · 30yr
- Down + closing
- —
- Monthly P&I
- —
- Monthly cashflow
- —
- DSCR
- —
- Eligible?
- —
No personal income docs; deal must DSCR.
Hard money
10% down · 12.0% · 12mo
- Down + closing
- —
- Monthly P&I
- —
- Monthly cashflow
- —
- DSCR
- —
- Eligible?
- —
Short-term bridge; refi at stabilization.
Listing history 17 events
-
2026-06-21days on market $189,986 Active 294 DOM
-
2026-06-21days on market $189,986 Active 293 DOM
-
2026-06-18days on market $189,986 Active 291 DOM
-
2026-06-17days on market $189,986 Active 290 DOM
-
2026-06-16days on market $189,986 Active 289 DOM
-
2026-06-15days on market $189,986 Active 288 DOM
-
2026-06-13days on market $189,986 Active 286 DOM
-
2026-06-12days on market $189,986 Active 285 DOM
-
2026-06-09days on market $189,986 Active 282 DOM
-
2026-06-09price $189,986 Active 281 DOM
-
2026-06-08days on market $216,324 Active 281 DOM
-
2026-06-07days on market $216,324 Active 280 DOM
-
2026-06-07statusdays on market $216,324 Active 279 DOM
-
2025-10-07price $216,324 640-char remark
Show marketing remark (640 chars)
Spacious 5 Bedroom, 3 Bath Brick with a Separate 2 Bedroom Apartment situated on 3.383 Acres on Happy Valley Road in South Williamson, KY. This home is located just minutes from ARH Hospital and downtown Williamson, just 30 minutes from Pikeville and Logan. This fine home offers the perfect blend of space, comfort and convenience. It features a large living/ family area with a fireplace, formal dining room ideal for hosting gatherings, a modern kitchen ideal for preparing meals with style and ease. a bedroom and office space on the main level, upstairs are 4 more bedrooms and a study. A separate 2 Bedroom Apartment is also included.
-
2025-08-25$224,825 Active 640-char remark
Show marketing remark (640 chars)
Spacious 5 Bedroom, 3 Bath Brick with a Separate 2 Bedroom Apartment situated on 3.383 Acres on Happy Valley Road in South Williamson, KY. This home is located just minutes from ARH Hospital and downtown Williamson, just 30 minutes from Pikeville and Logan. This fine home offers the perfect blend of space, comfort and convenience. It features a large living/ family area with a fireplace, formal dining room ideal for hosting gatherings, a modern kitchen ideal for preparing meals with style and ease. a bedroom and office space on the main level, upstairs are 4 more bedrooms and a study. A separate 2 Bedroom Apartment is also included.
-
2025-07-22price $224,825
-
2025-02-14$283,775 Active
ⓘ Source: listings_history table (triggers on properties + properties_extension) + one-shot
backfill from property_details.listing_events for pre-trigger history.
Tax reassessment forecast KY · Resets to sale price
- Current annual tax
- $3,184 · $265/mo
- Projected year-2 tax
- $3,184 · $265/mo
- Expected delta
- $0/yr ($0/mo · 0.0%)
ⓘ Screening estimate from a state-policy table — verify with the county assessor before closing.
Climate risk First Street
- Flood 10/10 Extreme FEMA zone X (unshaded) · 99% chance over 30 yrs
- Wildfire 6/10 Major
- Heat 4/10 Moderate 7 d/yr ≥103°F today · 20 d/yr by 30 yrs out
- Wind 2/10 Low 100% chance of damaging wind over 30 yrs
- Air quality 1/10 Low 0 unhealthy d/yr today · 0 by 30 yrs out
Nearby sold comps map
Loading sold comps map…
Walkable amenities ~0.75 mi
Loading nearby amenities…
Taxation est. · year 1
- Rental income
- $17,251
- − Mortgage interest
- −$10,642
- − Property taxes
- −$3,184
- − Insurance
- −$1,616
- − Repairs & maintenance
- −$1,380
- − Management
- −$1,380
- − Depreciation
- −$5,527
- Taxable loss
- −$6,479
- Est. tax savings @ 24.0%
- +$1,555
- After-tax cash flow
- $-1,573/yr
For passive investors: Depreciation is non-cash, so a rental often shows a tax loss while cash-flowing — sheltering income. Rental losses are passive: they offset passive income freely, and up to $25,000/yr can offset ordinary (W-2) income if you actively participate and your MAGI is under $100k (phasing out to $0 by $150k); unused losses carry forward. On sale, claimed depreciation is recaptured at up to 25%, and gains may owe capital-gains tax (a 1031 exchange can defer both). Figures are a year-1 estimate at your 24.0% rate — not tax advice; consult a CPA.
Schools (NCES district)
- District
- Pike County
- NCES district ID
- 2104800
- Math proficiency
- 24% ▼ -24.00%
- Reading proficiency
- 40% ▼ -20.00%
- Median HH income
- $32,601
- Composite
- 26.14/100
- National rank
- #7276
- State rank
- #98 of 165 in KY
Livability — South Williamson
- Score
- 68/100
- State rank
- #193
- US rank
- #9670
Category grades
Schools grade is shown separately in the Schools card above.
Census & demographics
- Census place
- South Williamson, KY
- City population
- 301
- Population (ZIP)
- 301
Population outlook (Pike County) Hauer SSP2
- Today (2025)
- 55,108 people
- By 2030
- 51,235 · -7.0%
- By 2040
- 43,573 · -20.9%
- By 2050
- 36,797 · -33.2%
- By 2075
- 24,330 · -55.9%
- By 2100
- 15,611 · -71.7%
Race, ethnicity, and origin ACS 2023
- Neighborhood character
- Predominantly White (95%)
- Race & ethnicity
- White 95%
Political lean MEDSL · Pike
- 2024 margin
- Solid R (+65.4) · D 16.8% · R 82.2%
- 2008→2024 swing
- -51.6pp toward R · 2008: -13.8pp · 2024: -65.4pp
- All cycles
- 2024: R+65.4 2020: R+60.7 2016: R+62.8 2012: R+50.5 2008: R+13.8
Not yet ingested
- Civics
- —
Market trends
- HPI YoY
- ▼ -0.85%
- Current HPI
- 150.7112
- Rent YoY
- —
- Metro
- —
- State GDP YoY
- ▲ 1.81%
- F500 in state
- 4
Industry mix (Fortune 500 HQ in KY)
| Industry | F500 HQs | Revenue |
|---|---|---|
| Healthcare | 1 | $118B |
|
||
| Food / Beverage | 1 | $7B |
|
||
Price history
-23.8% since first listed4 events — show timeline
- 2025-10-07 Price Changed $216,324 EKAR
- 2025-08-25 Listed $224,825 EKAR
- 2025-07-22 Price Changed $224,825 AABOR
- 2025-02-14 Listed $283,775 AABOR
Property tax history
+5.1%/yrLatest (2025): $3,184 · +24.6% YoY. Source: county tax records.
Cash-flow waterfall
monthlySold comps — $/sqft
last 12 mo · ≤1 miLoading sold comps…