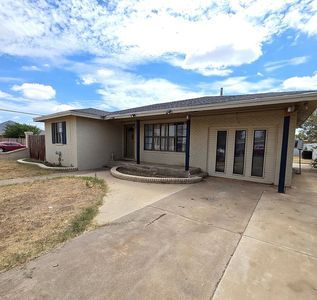
1120 E Pecan Ave · Midland, TX
Flood risk 3/10 · Minor
- FEMA flood zone
- X (shaded)
- Chance of flooding over 30 yrs
- 0.17%
- Est. flood insurance / yr
- $507 – $1,088
Fire risk 8/10 · Major
- Est. fire insurance / yr
- $1,222 – $2,270
Heat risk 6/10 · Moderate
- Hot days now (above 102°F)
- 7 days/yr
- Hot days in 30 yrs
- 22 days/yr
Wind risk 2/10 · Minimal
- Chance of severe wind over 30 yrs
- 4.0%
Air-quality risk 1/10 · Minimal
- Unhealthy air days now
- 0 days/yr
- Unhealthy air days in 30 yrs
- 0 days/yr
Risk factors via First Street. Map © Google.
Why this score? — see what drove the B- grade
The composite is a weighted blend of 9 inputs, each scored 0–100. Each bar is that input's sub-score; the figure is the points it added to the 100-point composite (weight × sub-score).
- Cash flow +30.0/30.0
- DSCR +10.0/10.0
- 1% rule +9.5/10.0
- ARV discount +7.5/15.0
- Livability +4.0/5.0
- Schools +3.2/10.0
- Rent growth +3.1/5.0
- Condition / age +2.5/5.0
- Appreciation +0.0/10.0
$135,000
🖨 Deal sheet 📄 Offer letter ✓ Due diligence
Listing remarks
NO OWNER TO OWNER FINANCING House for sell, 3 bed 1 bath. She& apos; s a diamond in the rough, definitely a fixer-upper but has alot of potential to be a great family home! Nice front and back yard. Both the House and the Garage have brand new roofs and New fence. Inside of garage ceiling needs a bit of work. Inside house needs touch ups Great neighborhood, a few schools around the area. SELLING HOUSE AS IS!
Key facts
- Front and back yard
- Brand new roofs
- New fence
Tags
Neighborhood map
What this means for you Summary
Snapshot
- This is a 3-bed/1.0-bath single-family listed at $135k.
Deal economics
- At list price, monthly cash flow is $652 ($8k/yr) — positive.
- The deal already cash-flows at list — no discount required.
- Meets the 1% rule at list price ($2k rent vs $135k).
- Cap rate 12.1% vs local median 4.7% in Midland — top-decile yield for the area; either an underpriced asset or a hidden risk that comps aren't pricing in. Stress-test before assuming the spread holds.
Location & tenants
- Location reads 79/100 on livability (#57 in TX, #2,192 nationally) — a middle-class / working-renter tenant base. Strengths: employment A+, housing A+, health & safety A+; Watch: schools C-, crime C-, commute D+.
- Midland ISD (urban): math 34% / reading 36% proficiency, ranked #477 of 826 in TX (top 58%) — families likely to look elsewhere, expect single-tenant / working-renter base with shorter leases.
- Market conditions: Rents rising (+2.6%/yr); 452 active listings in the ZIP; 20 comparable units currently listed for rent nearby; rentals at typical pace (median 21d on market — plan ~3-4 weeks tenant-placement turnaround); solid renter incomes; 1,504 units permitted in Midland County in 2024 (0 in 5+ unit buildings).
Forward outlook
- Local home prices are declining (-3.0%/yr); year-one equity from $933 of loan paydown is wiped out by about $4k of value loss. Plan a longer hold.
- Midland County population projected at +83% by 2050 — long-run rental-demand tailwind backs the buy-and-hold thesis.
- At projected returns (-3.0% appreciation + 2.6% rent growth), your $38k cash investment doubles in ~7 years — after that, you're playing with house money.
Negotiation context
- Only 1 days on market — expect competitive offers; lowballing is unlikely to land.
Risks & watch-outs
- Watch-outs: built in 1953 — expect roof / HVAC / electrical / plumbing capex.
- Climate carrying-cost: severe wildfire risk; extreme-heat days projected 7→22/yr by 2055 (HVAC capex compounding) — expect insurance premiums to compound above CPI over the hold.
Questions for the listing agent
- Built in 1953 — when were the roof, HVAC, electrical panel, plumbing, and water heater last replaced?
- Is there a deadline driving the sale (1031 exchange, divorce, estate, relocation)? That informs how much negotiation room exists.
- What's the average days-on-market for RENTAL listings here right now (not sales)? A rising rental-DOM trend means longer vacancies and softer asking-rent achievability than the comps imply.
- What's the recent tenant-quality profile in this submarket — average credit score on applications, eviction rate, late-payment / NSF rate, and stable-employment percentage? A property-management company in the area should have these aggregated.
- How much new for-sale + rental construction is in the pipeline within 1–3 miles? Heavy new supply typically softens prices + rents 12–24 months out; constrained supply supports both.
Investment metrics
- 1% rule
- 1.45% ✓
- Cap rate
- 12.09%
- Cash-on-cash
- 20.69%
- DSCR
- 1.92
- GRM
- 5.7
CMA / ARV
- ARV (on-the-fly)
- $71,980
- Comps found
- 1
Show comp detail 1 sale within ~0.75 mi
| Address | Dist | Beds/Ba | Sqft | Sold | Price | $/sf | Match |
|---|---|---|---|---|---|---|---|
| 201 E Pine Ave | 0.45mi | 3/1.0 | 1,071 (-9%) | 17mo | $65,000 | $61 | 49 |
Match score weights: distance 35% · size 25% · config 20% · recency 20%. Top-matched comps best support the ARV.
Projected returns pro-forma
-3.0% appreciation · 2.56% rent growth · sell at horizon
- IRR
- 12.5%
- Equity multiple
- 1.50×
- Total profit
- $18,769
- Equity at exit
- $20,129
- IRR
- 21.1%
- Equity multiple
- 2.75×
- Total profit
- $66,299
- Equity at exit
- $11,672
Cash invested: $37,800 (down + closing). Projections, not guarantees.
Landlord ↔ Tenant lean methodology
- Overall (STATE)
- 87 Strongly Landlord-Friendly
- State Texas
- 87 Strongly Landlord-Friendly · R+5
- County
- — inherits STATE
- City
- — inherits STATE
ZIP-level market 79705
- Rents YoY
- 2.6%
- Active inventory
- 452
- Price-to-rent
- 5.7×
Monthly cashflow live
- Estimated rent
- $1,958 high interval (Pro) →
- Mortgage (P&I)
- −$708
- Tax from tax record
- −$131 /mo · $1,568/yr
- Insurance
- −$56
- HOA
- −$0
- Vacancy / Maint / Mgmt
- −$411
- Net cashflow
- $652
Break-even live
UW: 25.0% down · 7.5% · 30yr · 1.5% tax · 5.0% vac · 8.0% maint · 8.0% mgmt
Financing live
Cash to close
- Down payment
- $33,750
- Closing costs
- $4,050
- Reserves months
- —
- Total cash needed
- —
Loan-product check · same deal, 3 products live
Conventional
25% down · 7.5% · 30yr
- Down + closing
- —
- Monthly P&I
- —
- Monthly cashflow
- —
- DSCR
- —
- Eligible?
- —
Personal DTI + credit; lowest rate.
DSCR
20% down · 8.5% · 30yr
- Down + closing
- —
- Monthly P&I
- —
- Monthly cashflow
- —
- DSCR
- —
- Eligible?
- —
No personal income docs; deal must DSCR.
Hard money
10% down · 12.0% · 12mo
- Down + closing
- —
- Monthly P&I
- —
- Monthly cashflow
- —
- DSCR
- —
- Eligible?
- —
Short-term bridge; refi at stabilization.
Rent comps 20 comps
| Address | Beds | Baths | Sqft | Rent | $/sqft | DOM | Units | Dist |
|---|---|---|---|---|---|---|---|---|
| 416 Maple Ave Midland, TX | 3.0 | 2.0 | 1107 | $1,750 | $1.58 | 20d | 1 | 0.23mi |
| 1212 E Wadley Ave Unit 1223 Midland, TX | 2.0 | 2.0 | 932 | $1,138 | $1.22 | 20d | 1 | 0.39mi |
| 3214 Carver St Midland, TX | 3.0 | 2.0 | 1286 | $2,300 | $1.79 | 43d | 1 | 0.42mi |
| 202 E Shandon Ave Midland, TX | 3.0 | 2.0 | 1231 | $2,400 | $1.95 | 20d | 1 | 0.55mi |
| 3600 Edwards St Midland, TX | 1.0–3.0 | 1.0–2.0 | 980 | $2,886 | $2.94 | 13d | 19 | 0.71mi |
| 1710 N Weatherford St Midland, TX | 3.0 | 1.0 | 1165 | $1,950 | $1.67 | 20d | 1 | 0.74mi |
| 407 W Spruce Ave Unit A-1 Midland, TX | 2.0 | 2.0 | 1078 | $1,600 | $1.48 | 20d | 1 | 0.78mi |
| 410 W Pine Ave Unit B Midland, TX | 2.0 | 1.0 | 1140 | $1,850 | $1.62 | 20d | 1 | 0.80mi |
| 405 Humble Ave Midland, TX | 2.0 | 1.0 | 876 | $1,250 | $1.43 | 43d | 1 | 0.85mi |
| 3700 N Edwards St Midland, TX | 1.0–2.0 | 1.0–2.0 | 957 | $1,911 | $2.00 | 13d | 18 | 0.86mi |
| 2301 N Pecos St Midland, TX | 2.0 | 1.0–2.0 | 1053 | $1,562 | $1.48 | 20d | 3 | 0.93mi |
| 2301 N Pecos St Midland, TX | 2.0 | 2.0 | 1082 | $1,612 | $1.49 | 43d | 2 | 0.93mi |
| 711 W Dormard Ave Midland, TX | 3.0 | 2.0 | 1427 | $2,150 | $1.51 | 43d | 1 | 1.02mi |
| 930 Edwards St Midland, TX | 3.0 | 2.0 | 1170 | $1,750 | $1.50 | 13d | 1 | 1.23mi |
| 1320 N Fairgrounds Rd #706 Midland, TX | 3.0 | 2.0 | 1360 | $3,500 | $2.57 | 13d | 1 | 1.23mi |
| 1320 N Fairgrounds Rd Midland, TX | 2.0 | 2.0 | 1152 | $2,800 | $2.43 | 13d | 1 | 1.23mi |
| 3700 N A St Midland, TX | 1.0–2.0 | 1.0–2.0 | 971 | $2,039 | $2.10 | 13d | 1 | 1.37mi |
| 1104 N Carrizo St Midland, TX | 2.0 | 1.0 | 810 | $1,400 | $1.73 | 43d | 1 | 1.38mi |
| 1102 N Carrizo St Midland, TX | 2.0 | 1.0 | 810 | $1,400 | $1.73 | 43d | 1 | 1.39mi |
| 1101 N Carrizo St Unit 6 Midland, TX | 2.0 | 1.0 | 915 | $1,500 | $1.64 | 13d | 1 | 1.45mi |
Listing history 2 events
-
2005-11-04soldstatus
-
2005-11-01soldstatus
ⓘ Source: listings_history table (triggers on properties + properties_extension) + one-shot
backfill from property_details.listing_events for pre-trigger history.
Tax reassessment forecast TX · Resets to sale price
- Current annual tax
- $1,568 · $131/mo
- Projected year-2 tax
- $2,470 · $206/mo
- Expected delta
- +$903/yr (+$75/mo · 57.6%)
ⓘ Screening estimate from a state-policy table — verify with the county assessor before closing.
Climate risk First Street
- Flood 3/10 Moderate FEMA zone X (shaded) · 17% chance over 30 yrs
- Wildfire 8/10 Severe
- Heat 6/10 Major 7 d/yr ≥102°F today · 22 d/yr by 30 yrs out
- Wind 2/10 Low 4% chance of damaging wind over 30 yrs
- Air quality 1/10 Low 0 unhealthy d/yr today · 0 by 30 yrs out
Nearby sold comps map
Loading sold comps map…
Walkable amenities ~0.75 mi
Loading nearby amenities…
Taxation est. · year 1
- Rental income
- $23,490
- − Mortgage interest
- −$7,562
- − Property taxes
- −$1,568
- − Insurance
- −$675
- − Repairs & maintenance
- −$1,879
- − Management
- −$1,879
- − Depreciation
- −$3,927
- Taxable income
- $6,000
- Est. tax owed @ 24.0%
- −$1,440
- After-tax cash flow
- $6,379/yr
For passive investors: Depreciation is non-cash, so a rental often shows a tax loss while cash-flowing — sheltering income. Rental losses are passive: they offset passive income freely, and up to $25,000/yr can offset ordinary (W-2) income if you actively participate and your MAGI is under $100k (phasing out to $0 by $150k); unused losses carry forward. On sale, claimed depreciation is recaptured at up to 25%, and gains may owe capital-gains tax (a 1031 exchange can defer both). Figures are a year-1 estimate at your 24.0% rate — not tax advice; consult a CPA.
Schools (NCES district)
- District
- Midland ISD
- NCES district ID
- 4830570
- Math proficiency
- 34% ▼ -7.00%
- Reading proficiency
- 36% ▬ 0.00%
- Median HH income
- $63,457
- Composite
- 31.63/100
- National rank
- #5938
- State rank
- #477 of 826 in TX
Livability — Midland
- Score
- 79/100
- State rank
- #57
- US rank
- #2192
Category grades
Schools grade is shown separately in the Schools card above.
Census & demographics
- Census place
- Midland, TX
- County
- Midland County · 168,494 people
- City population
- 168,494
- Metro
- Midland, TX
- Population (ZIP)
- 46,653
- Household income
- $105,310
- Rent vs Own
- Severe rent burden
- 1557.0
Population outlook (Midland County) Hauer SSP2
- Today (2025)
- 220,895 people
- By 2030
- 253,667 · +14.8%
- By 2040
- 325,498 · +47.4%
- By 2050
- 404,168 · +83.0%
- By 2075
- 609,802 · +176.1%
- By 2100
- 760,172 · +244.1%
Race, ethnicity, and origin ACS 2023
- Neighborhood character
- Diverse neighborhood (Simpson 0.60)
- Race & ethnicity
- White 46% Hispanic / Latino 43% Two or more races 20% Black 8%
- Hispanic origin (detail)
- Mexican 35%
- Common ancestry
- Slovak 1% Lithuanian 1% Serbian 1%
- Foreign-born
- 10% · Canada, Jamaica
- Languages at home
- 72% English-only · Spanish 24% Arabic 1%
Political lean MEDSL · Midland
- 2024 margin
- Solid R (+60.5) · D 19.3% · R 79.8%
- 2008→2024 swing
- -3.3pp toward R · 2008: -57.3pp · 2024: -60.5pp
- All cycles
- 2024: R+60.5 2020: R+56.6 2016: R+55.2 2012: R+61.5 2008: R+57.3
Not yet ingested
- Civics
- —
Market trends
- HPI YoY
- ▼ -300.44%
- Current HPI
- 207.2904
- Rent YoY
- ▲ 2.56%
- Metro
- Midland, TX
- State GDP YoY
- ▲ 3.95%
- F500 in state
- 110
Industry mix (Fortune 500 HQ in TX)
| Industry | F500 HQs | Revenue |
|---|---|---|
| Energy | 16 | $1,198B |
|
||
| Technology | 5 | $198B |
|
||
| Engineering / Construction | 4 | $72B |
|
||
| Energy Services | 3 | $60B |
|
||
| Utilities | 3 | $41B |
|
||
| Healthcare | 2 | $330B |
|
||
Property tax history
+6.2%/yrLatest (2025): $1,568 · -3.9% YoY. Source: county tax records.
Cash-flow waterfall
monthlySold comps — $/sqft
last 12 mo · ≤1 miLoading sold comps…