534 E 37th Avenue Rega Pt #49 · Lake Station, IN
Flood risk No data
- FEMA flood zone
- —
- Chance of flooding over 30 yrs
- —
- Est. flood insurance / yr
- —
Fire risk No data
- Est. fire insurance / yr
- —
Heat risk No data
- Hot days now (above threshold)
- —
- Hot days in 30 yrs
- —
Wind risk No data
- Chance of severe wind over 30 yrs
- —
Air-quality risk No data
- Unhealthy air days now
- —
- Unhealthy air days in 30 yrs
- —
Risk factors via First Street. Map © Google.
Why this score? — see what drove the D+ grade
The composite is a weighted blend of 9 inputs, each scored 0–100. Each bar is that input's sub-score; the figure is the points it added to the 100-point composite (weight × sub-score).
- Cash flow +15.0/30.0
- ARV discount +7.5/15.0
- 1% rule +5.0/10.0
- DSCR +5.0/10.0
- Rent growth +3.9/5.0
- Condition / age +3.8/5.0
- Livability +3.2/5.0
- Schools +2.0/10.0
- Appreciation +0.0/10.0
$22,500
🖨 Deal sheet 📄 Offer letter ✓ Due diligence
Listing remarks MLS
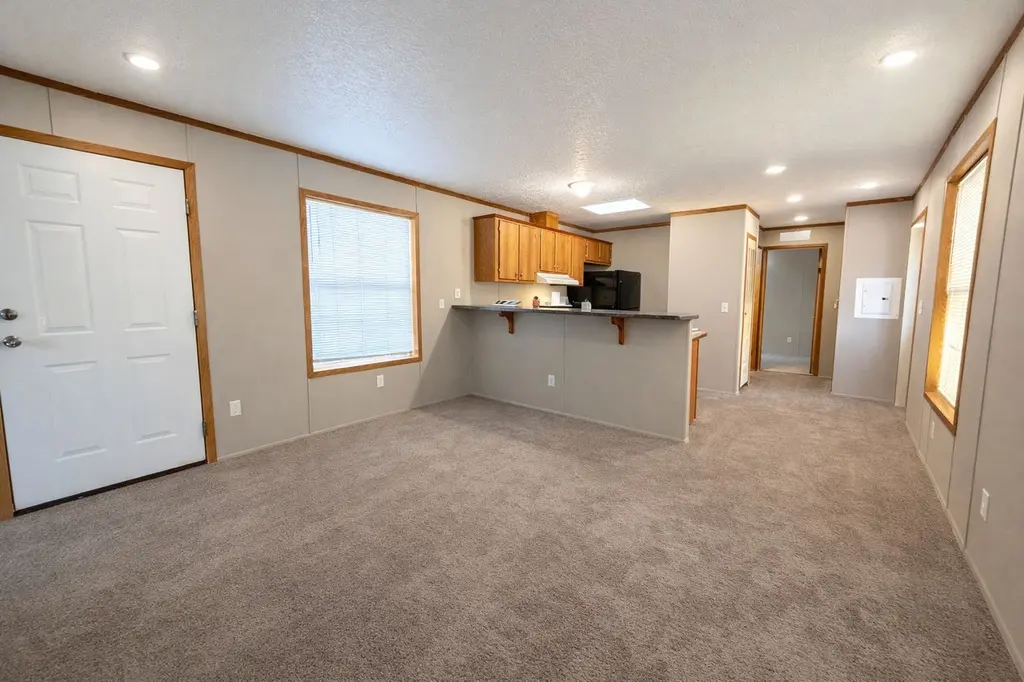
Welcome home to the perfect little slice of peace! This beautiful home at an even more amazing price is perfect. Walk into the large living room perfect for entertaining or having a nice relaxing time in your own home!! The breakfast bar adds extra flexibility and leads straight to the kitchen with a Brand New Stove! Plenty of counter space and cabinet space as well! Brand new carpet has been installed throughout the home! The primary bedroom is located in the rear of the home with plenty of open space and his and hers closet! The bathroom is located between the primary bedroom and the laundry area! The secondary bedroom is located on the opposite side of the home! Giving both rooms extra privacy, wall mounted lighting and beautiful light brown trim makes this whole house feel like a home! The land does not come with the home. The land is leased and owned by Ravinia Pines.
Key facts
- Large living room
- Brand new stove
- Brand new carpet
Tags
Neighborhood map
What this means for you Summary
Snapshot
- This is a 2-bed/1.0-bath manufactured listed at $22k. Condition is rated good.
Deal economics
- At list price, monthly cash flow is $196 ($2k/yr) — positive.
- The deal already cash-flows at list — no discount required.
- Meets the 1% rule at list price ($1k rent vs $22k).
- Recommended offer: $21k (6.0% below list) — sets the bar for market timing.
- Cap rate 16.8% vs local median 6.4% in Lake Station — top-decile yield for the area; either an underpriced asset or a hidden risk that comps aren't pricing in. Stress-test before assuming the spread holds.
Location & tenants
- Location reads 63/100 on livability (#411 in IN) — a middle-class / working-renter tenant base. Strengths: cost of living A+, housing A+; Watch: crime C-, schools F, amenities F.
- River Forest Community School Corporation (suburban): math 17% / reading 30% proficiency, ranked #268 of 301 in IN (top 89%) — low school quality limits family demand, transient renter base, plan for 1-2y turnover; 72% free/reduced lunch — lower-income household profile, screen leases tightly.
- Market conditions: Rents rising fast (+5.6%/yr); 255 active listings in the ZIP; 8 comparable units currently listed for rent nearby; rentals leasing fast (median 2d on market — plan ~1-2 weeks tenant-placement turnaround); solid renter incomes; 1,642 units permitted in Lake County in 2024 (14 in 5+ unit buildings).
Forward outlook
- Local home prices are declining (-3.0%/yr); year-one equity from $156 of loan paydown is wiped out by about $675 of value loss. Plan a longer hold.
- Lake County population projected to shrink 7% by 2050 — rents likely to lag national; underwrite the cash flow, not the appreciation.
- At projected returns (-3.0% appreciation + 5.6% rent growth), your $6k cash investment doubles in ~3 years — after that, you're playing with house money.
Negotiation context
- It's been on market 68 days — a 6% lower offer ($21k) is reasonable based on typical stale-listing flexibility.
Risks & watch-outs
- Watch-outs: HOA is 51% of rent.
Questions for the listing agent
- It's been on market 68 days. Have you received any prior offers? Is the seller open to a 6% concession, seller financing, or rate buy-down credit?
- What does the HOA fee cover, when was the last increase, and are there any pending special assessments or reserve-fund shortfalls?
- Why hasn't it sold? Are there any deal-killer items the seller is aware of (foundation, flood, title, zoning, code violations)?
- Is there a deadline driving the sale (1031 exchange, divorce, estate, relocation)? That informs how much negotiation room exists.
- Schools are F-rated, which usually means shorter tenancies and higher turnover. Who's the typical renter profile here, and what's been the actual vacancy rate?
- The area grade is low — what's the realistic commute time and amenity access for the typical tenant pool here? Any planned neighborhood developments (good or bad) we should know about?
- What's the average days-on-market for RENTAL listings here right now (not sales)? A rising rental-DOM trend means longer vacancies and softer asking-rent achievability than the comps imply.
- What's the recent tenant-quality profile in this submarket — average credit score on applications, eviction rate, late-payment / NSF rate, and stable-employment percentage? A property-management company in the area should have these aggregated.
- How much new for-sale + rental construction is in the pipeline within 1–3 miles? Heavy new supply typically softens prices + rents 12–24 months out; constrained supply supports both.
Investment metrics
- 1% rule
- 5.50% ✓
- Cap rate
- 16.76%
- Cash-on-cash
- 37.39%
- DSCR
- 2.66
- GRM
- 1.5
CMA / ARV
No comps found within radius.
Projected returns pro-forma
-3.0% appreciation · 5.63% rent growth · sell at horizon
- IRR
- 42.0%
- Equity multiple
- 3.00×
- Total profit
- $12,618
- Equity at exit
- $3,355
- IRR
- 51.3%
- Equity multiple
- 7.87×
- Total profit
- $43,267
- Equity at exit
- $1,945
Cash invested: $6,300 (down + closing). Projections, not guarantees.
Landlord ↔ Tenant lean methodology
- Overall (STATE)
- 90 Strongly Landlord-Friendly
- State Indiana
- 90 Strongly Landlord-Friendly · R+11
- County
- — inherits STATE
- City
- — inherits STATE
ZIP-level market 46342
- Rents YoY
- 5.6%
- Active inventory
- 255
- Price-to-rent
- 1.5×
Monthly cashflow live
- Estimated rent
- $1,236 high interval (Pro) →
- Mortgage (P&I)
- −$118
- Tax est. 1.5%
- −$28 /mo · $338/yr
- Insurance
- −$9
- HOA
- −$625
- Vacancy / Maint / Mgmt
- −$260
- Net cashflow
- $196
Break-even live
UW: 25.0% down · 7.5% · 30yr · 1.5% tax · 5.0% vac · 8.0% maint · 8.0% mgmt
Financing live
Cash to close
- Down payment
- $5,625
- Closing costs
- $675
- Reserves months
- —
- Total cash needed
- —
Loan-product check · same deal, 3 products live
Conventional
25% down · 7.5% · 30yr
- Down + closing
- —
- Monthly P&I
- —
- Monthly cashflow
- —
- DSCR
- —
- Eligible?
- —
Personal DTI + credit; lowest rate.
DSCR
20% down · 8.5% · 30yr
- Down + closing
- —
- Monthly P&I
- —
- Monthly cashflow
- —
- DSCR
- —
- Eligible?
- —
No personal income docs; deal must DSCR.
Hard money
10% down · 12.0% · 12mo
- Down + closing
- —
- Monthly P&I
- —
- Monthly cashflow
- —
- DSCR
- —
- Eligible?
- —
Short-term bridge; refi at stabilization.
Rent comps 8 comps
| Address | Beds | Baths | Sqft | Rent | $/sqft | DOM | Units | Dist |
|---|---|---|---|---|---|---|---|---|
| 905 W 37th Ave Unit 48 Hobart, IN | 2.0 | 1.0 | 1000 | $1,200 | $1.20 | 43d | 1 | 0.29mi |
| 3612 Michigan St Unit 2nd Fl Hobart, IN | 3.0 | 1.0 | 675 | $925 | $1.37 | 15d | 1 | 0.41mi |
| 416 Van Buren Ave Hobart, IN | 3.0 | 1.0 | 1085 | $1,395 | $1.29 | 1d | 1 | 0.59mi |
| 2955 DeKalb St Lake Station, IN | 2.0 | 1.0 | 784 | $1,100 | $1.40 | 2d | 1 | 0.85mi |
| 333 Neringa Ln Hobart, IN | 1.0–3.0 | 1.0–2.0 | 1009 | $1,470 | $1.46 | 1d | 11 | 0.86mi |
| 2830 Grand Blvd Lake Station, IN | 3.0 | 1.0 | 864 | $1,395 | $1.61 | 1d | 1 | 0.99mi |
| 2716 Huntington St Lake Station, IN | 3.0 | 1.0 | 832 | $1,500 | $1.80 | 1d | 1 | 1.10mi |
| 1421 High St Unit 2W Hobart, IN | 2.0 | 1.0 | 950 | $1,200 | $1.26 | 20d | 1 | 1.47mi |
HOA detail
- Monthly dues
- $625 · $7,500/yr
Listing history 15 events
-
2026-06-18days on market $22,500 Active 68 DOM
-
2026-06-17days on market $22,500 Active 67 DOM
-
2026-06-16days on market $22,500 Active 66 DOM
-
2026-06-15days on market $22,500 Active 65 DOM
-
2026-06-13days on market $22,500 Active 63 DOM
-
2026-06-13days on market $22,500 Active 62 DOM
-
2026-06-09days on market $22,500 Active 59 DOM
-
2026-06-08days on market $22,500 Active 58 DOM
-
2026-06-07days on market $22,500 Active 57 DOM
-
2026-06-04days on market $22,500 Active 54 DOM
-
2026-06-03days on market $22,500 Active 53 DOM
-
2026-06-02days on market $22,500 Active 52 DOM
-
2026-06-01days on market $22,500 Active 51 DOM
-
2026-05-31days on market $22,500 Active 50 DOM
-
2026-04-12$22,500 Active 893-char remark
Show marketing remark (893 chars)
Welcome home to the perfect little slice of peace! This beautiful home at an even more amazing price is perfect. Walk into the large living room perfect for entertaining or having a nice relaxing time in your own home!! The breakfast bar adds extra flexibility and leads straight to the kitchen with a Brand New Stove! Plenty of counter space and cabinet space as well! Brand new carpet has been installed throughout the home! The primary bedroom is located in the rear of the home with plenty of open space and his and hers closet! The bathroom is located between the primary bedroom and the laundry area! The secondary bedroom is located on the opposite side of the home! Giving both rooms extra privacy, wall mounted lighting and beautiful light brown trim makes this whole house feel like a home! The land does not come with the home. The land is leased and owned by Ravinia Pines.
ⓘ Source: listings_history table (triggers on properties + properties_extension) + one-shot
backfill from property_details.listing_events for pre-trigger history.
Nearby sold comps map
Loading sold comps map…
Walkable amenities ~0.75 mi
Loading nearby amenities…
Taxation est. · year 1
- Rental income
- $14,838
- − Mortgage interest
- −$1,260
- − Property taxes
- −$338
- − Insurance
- −$112
- − Repairs & maintenance
- −$1,187
- − Management
- −$1,187
- − HOA
- −$7,500
- − Depreciation
- −$655
- Taxable income
- $2,599
- Est. tax owed @ 24.0%
- −$624
- After-tax cash flow
- $1,732/yr
For passive investors: Depreciation is non-cash, so a rental often shows a tax loss while cash-flowing — sheltering income. Rental losses are passive: they offset passive income freely, and up to $25,000/yr can offset ordinary (W-2) income if you actively participate and your MAGI is under $100k (phasing out to $0 by $150k); unused losses carry forward. On sale, claimed depreciation is recaptured at up to 25%, and gains may owe capital-gains tax (a 1031 exchange can defer both). Figures are a year-1 estimate at your 24.0% rate — not tax advice; consult a CPA.
Condition & rehab AI · 10 photos
This manufactured home is in good condition with recent updates, making it a solid investment opportunity.
Value-add opportunities
- Both Paint exterior — Enhances curb appeal and value
- Both Replace countertops — Improves functionality and aesthetics
Renovation cost estimate screening
Value-add ROI direction
- Both Paint exterior — Enhances curb appeal and value ↑
- Both Replace countertops — Improves functionality and aesthetics ↑
ⓘ Cost ranges are severity-bucket heuristics (US national rule-of-thumb). Get contractor quotes + a written scope before underwriting a rehab budget.
Schools (NCES district)
- District
- River Forest Community School Corporation
- NCES district ID
- 1804620
- Math proficiency
- 17% ▼ -18.00%
- Reading proficiency
- 30% ▼ -6.00%
- Median HH income
- $38,317
- Composite
- 19.65/100
- National rank
- #8738
- State rank
- #268 of 301 in IN
Livability — Lake Station
- Score
- 63/100
- State rank
- #411
- US rank
- #14929
Category grades
Schools grade is shown separately in the Schools card above.
Census & demographics
- Census place
- Lake Station, IN
- County
- Lake County · 422,878 people
- City population
- 12,184
- Metro
- Chicago-Naperville-Elgin, IL-IN-WI
- Population (ZIP)
- 32,224
- Household income
- $75,521
- Rent vs Own
- Severe rent burden
- 1033.0
Population outlook (Lake County) Hauer SSP2
- Today (2025)
- 484,026 people
- By 2030
- 478,091 · -1.2%
- By 2040
- 462,974 · -4.3%
- By 2050
- 449,894 · -7.1%
- By 2075
- 436,169 · -9.9%
- By 2100
- 426,607 · -11.9%
Race, ethnicity, and origin ACS 2023
- Neighborhood character
- Predominantly White (66%)
- Race & ethnicity
- White 66% Hispanic / Latino 21% Two or more races 10% Black 10% Asian 1%
- Hispanic origin (detail)
- Mexican 15% Puerto Rican 5%
- Common ancestry
- Romanian 11% Iranian 2% Lithuanian 1%
- Foreign-born
- 5% · Canada, China
- Languages at home
- 87% English-only · Spanish 9% Russian/Polish/Slavic 2% Chinese 1%
Political lean MEDSL · Lake
- 2024 margin
- Lean D (+5.6) · D 52.1% · R 46.5% · Other 1.5%
- 2008→2024 swing
- -28.6pp toward R · 2008: 34.3pp · 2024: 5.6pp
- All cycles
- 2024: D+5.6 2020: D+15.1 2016: D+20.6 2012: D+31.0 2008: D+34.3
Not yet ingested
- Civics
- —
Market trends
- HPI YoY
- ▼ -167.01%
- Current HPI
- 260.2635
- Rent YoY
- ▲ 5.63%
- Metro
- Chicago-Naperville-Elgin, IL-IN-WI
- State GDP YoY
- ▲ 2.90%
- F500 in state
- 18
Industry mix (Fortune 500 HQ in IN)
| Industry | F500 HQs | Revenue |
|---|---|---|
| Industrial Machinery | 2 | $37B |
|
||
| Healthcare | 1 | $177B |
|
||
| Pharmaceuticals | 1 | $45B |
|
||
| Metals / Steel | 1 | $18B |
|
||
| Agriculture | 1 | $17B |
|
||
| Packaging | 1 | $12B |
|
||
Price history
1 event — show timeline
- 2026-04-12 Listed $22,500 Zillow
Cash-flow waterfall
monthlySold comps — $/sqft
last 12 mo · ≤1 miLoading sold comps…