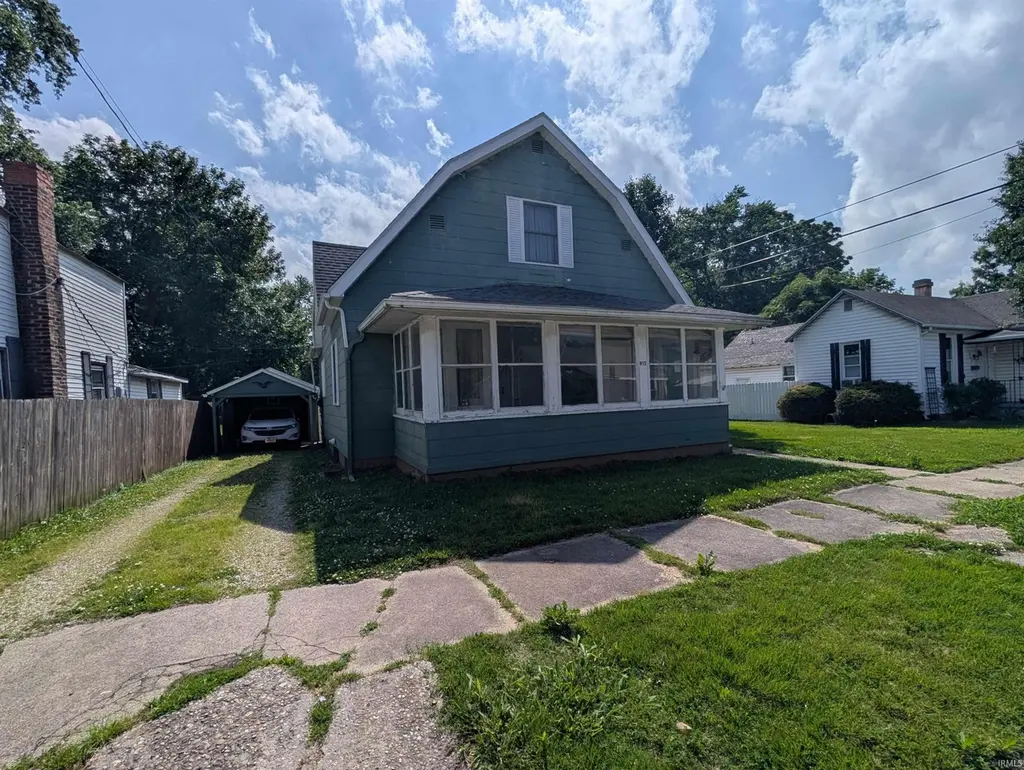
915 Prairie St · Vincennes, IN
Flood risk 4/10 · Minor
- FEMA flood zone
- —
- Chance of flooding over 30 yrs
- 0.22%
- Est. flood insurance / yr
- —
Fire risk 1/10 · Minimal
- Est. fire insurance / yr
- $717 – $1,331
Heat risk 5/10 · Moderate
- Hot days now (above 106°F)
- 7 days/yr
- Hot days in 30 yrs
- 19 days/yr
Wind risk 2/10 · Minimal
- Chance of severe wind over 30 yrs
- 3.0%
Air-quality risk 3/10 · Minor
- Unhealthy air days now
- 2 days/yr
- Unhealthy air days in 30 yrs
- 3 days/yr
Risk factors via First Street. Map © Google.
Why this score? — see what drove the B grade
The composite is a weighted blend of 9 inputs, each scored 0–100. Each bar is that input's sub-score; the figure is the points it added to the 100-point composite (weight × sub-score).
- Cash flow +29.6/30.0
- ARV discount +15.0/15.0
- DSCR +10.0/10.0
- 1% rule +8.3/10.0
- Livability +3.5/5.0
- Schools +3.0/10.0
- Rent growth +2.5/5.0
- Condition / age +2.5/5.0
- Appreciation +0.0/10.0
$99,900
🖨 Deal sheet 📄 Offer letter ✓ Due diligence
Listing remarks
This 3-bedroom, 2-bath home sits on a huge lot right down the street from Good Samaritan Hospital. The main floor features a great enclosed front porch, a massive living and dining room combo, and a kitchen with plenty of cabinet space. Up top, the house has a classic attic fan that cools the whole place down in the summer. Outside, you get a big backyard that is already fully fenced in, plus an attached 1-car garage for extra storage. It also has a basement for additional storage along with housing the mechanicals.
Key facts
- Big backyard
- Fully fenced
- Classic attic fan
Tags
Property features AI
Exterior
- Parking: Detached garage; Concrete parking; One garage space
- Utilities: Public water; Public sewer
- Home design: Single-family site-built home; One story
- Construction: Built with other construction materials; Block foundation; Asphalt shingle roof
- Exterior features: Enclosed porch; Chain link fencing; Level lot
Interior
- Kitchen: Dishwasher; Refrigerator; Electric range; Kitchen island; Laminate countertops
- Bedrooms: Bedrooms present (room-level details not provided)
- Flooring: Carpet; Vinyl
- Bathrooms: Two full bathrooms; One half bathroom; Two main-level bathrooms
- Heating & cooling: Natural gas forced-air heating; Central air conditioning; Ceiling fans
- Interior features: Walk-in closets; Ceiling fans; Kitchen island; Laminate countertops; Blinds; One fireplace (none specified as usable)
- Laundry & utility: Main-level laundry with gas dryer hookup
Neighborhood map
What this means for you Summary
Snapshot
- This is a 3-bed/1.0-bath single-family listed at $100k.
Deal economics
- At list price, monthly cash flow is $361 ($4k/yr) — positive.
- The deal already cash-flows at list — no discount required.
- Meets the 1% rule at list price ($1k rent vs $100k).
- Cap rate 10.6% vs local median 5.1% in Vincennes — top-decile yield for the area; either an underpriced asset or a hidden risk that comps aren't pricing in. Stress-test before assuming the spread holds.
Location & tenants
- Location reads 70/100 on livability (#148 in IN) — a middle-class / working-renter tenant base. Strengths: cost of living A+, housing A+, health & safety A+; Watch: amenities F, commute F, employment D-.
- Vincennes Community School Corporation (town): math 34% / reading 38% proficiency, ranked #193 of 301 in IN (top 64%) — families likely to look elsewhere, expect single-tenant / working-renter base with shorter leases.
- Zoned schools: Francis Vigo Elementary School (math 52% / reading 37%, grade F, #379 of 994 statewide, top 41%, 347 students, 62% FRL); George Rogers Clark School (math 27% / reading 34%, grade F, #203 of 330 statewide, top 63%, 609 students, 57% FRL); Lincoln High School (math 27% / reading 47%, grade F, #247 of 369 statewide, top 70%, 765 students, 55% FRL) — zoned schools at 58% FRL track the district average.
- Market conditions: 136 active listings in the ZIP; 36 units permitted in Knox County in 2024 (0 in 5+ unit buildings).
Forward outlook
- Local home prices are declining (-3.0%/yr); year-one equity from $691 of loan paydown is wiped out by about $3k of value loss. Plan a longer hold.
- Knox County population projected at -13% by 2050 — secular population decline; favor cash flow + early exit over multi-decade hold.
- At projected returns (-3.0% appreciation + 3.0% rent growth), your $28k cash investment doubles in ~8 years — after that, you're playing with house money.
Negotiation context
- Only 7 days on market — expect competitive offers; lowballing is unlikely to land.
Risks & watch-outs
- Watch-outs: built in 1890 — expect roof / HVAC / electrical / plumbing capex.
- Climate carrying-cost: extreme-heat days projected 7→19/yr by 2055 (HVAC capex compounding) — expect insurance premiums to compound above CPI over the hold.
Questions for the listing agent
- Built in 1890 — when were the roof, HVAC, electrical panel, plumbing, and water heater last replaced?
- Is there a deadline driving the sale (1031 exchange, divorce, estate, relocation)? That informs how much negotiation room exists.
- Schools are D-rated, which usually means shorter tenancies and higher turnover. Who's the typical renter profile here, and what's been the actual vacancy rate?
- What's the average days-on-market for RENTAL listings here right now (not sales)? A rising rental-DOM trend means longer vacancies and softer asking-rent achievability than the comps imply.
- What's the recent tenant-quality profile in this submarket — average credit score on applications, eviction rate, late-payment / NSF rate, and stable-employment percentage? A property-management company in the area should have these aggregated.
- How much new for-sale + rental construction is in the pipeline within 1–3 miles? Heavy new supply typically softens prices + rents 12–24 months out; constrained supply supports both.
Investment metrics
- 1% rule
- 1.33% ✓
- Cap rate
- 10.63%
- Cash-on-cash
- 15.48%
- DSCR
- 1.69
- GRM
- 6.3
CMA / ARV
- ARV (on-the-fly)
- $171,120
- Comps found
- 11
Show comp detail 11 sales within ~0.75 mi
| Address | Dist | Beds/Ba | Sqft | Sold | Price | $/sf | Match |
|---|---|---|---|---|---|---|---|
| 1001 Barnett St | 0.24mi | 3/2.0 | 1,914 (+3%) | 12mo | $175,000 | $91 | 70 |
| 217 S 9th St | 0.29mi | 3/2.0 | 1,778 (-4%) | 11mo | $175,000 | $98 | 66 |
| 1302 Busseron St | 0.61mi | 3/2.5 | 1,866 (+0%) | 4mo | $171,000 | $92 | 62 |
| 319 Bayou St | 0.43mi | 4/1.0 (+1) | 1,689 (-9%) | 0mo | $175,000 | $104 | 59 |
| 622 S 11th St | 0.13mi | 3/2.0 | 1,676 (-10%) | 19mo | $223,000 | $133 | 58 |
| 1303 Vigo St | 0.49mi | 3/2.0 | 1,960 (+5%) | 8mo | $174,900 | $89 | 57 |
| 718 Buntin St | 0.67mi | 3/1.0 | 2,027 (+9%) | 3mo | $170,000 | $84 | 52 |
| 416 Barnett St | 0.45mi | 4/2.0 (+1) | 1,704 (-8%) | 6mo | $173,000 | $102 | 51 |
| 702 Buntin St | 0.67mi | 4/2.0 (+1) | 1,782 (-4%) | 6mo | $30,000 | $17 | 47 |
| 1136 Broadway St | 0.63mi | 4/2.0 (+1) | 2,016 (+8%) | 9mo | $110,000 | $55 | 40 |
| 211 S 6th St | 0.40mi | 4/2.0 (+1) | 1,645 (-12%) | 21mo | $160,000 | $97 | 36 |
Match score weights: distance 35% · size 25% · config 20% · recency 20%. Top-matched comps best support the ARV.
Projected returns pro-forma
-3.0% appreciation · 3.0% rent growth · sell at horizon
- IRR
- 6.3%
- Equity multiple
- 1.24×
- Total profit
- $6,812
- Equity at exit
- $14,895
- IRR
- 15.6%
- Equity multiple
- 2.27×
- Total profit
- $35,603
- Equity at exit
- $8,638
Cash invested: $27,972 (down + closing). Projections, not guarantees.
Landlord ↔ Tenant lean methodology
- Overall (STATE)
- 90 Strongly Landlord-Friendly
- State Indiana
- 90 Strongly Landlord-Friendly · R+11
- County
- — inherits STATE
- City
- — inherits STATE
ZIP-level market 47591
- Home prices YoY
- -19.5%
- Active inventory
- 136
- Price-to-rent
- 6.3×
Monthly cashflow live
- Estimated rent
- $1,331 medium interval (Pro) →
- Mortgage (P&I)
- −$524
- Tax est. 1.5%
- −$125 /mo · $1,498/yr
- Insurance
- −$42
- HOA
- −$0
- Vacancy / Maint / Mgmt
- −$279
- Net cashflow
- $361
Break-even live
UW: 25.0% down · 7.5% · 30yr · 1.5% tax · 5.0% vac · 8.0% maint · 8.0% mgmt
Financing live
Cash to close
- Down payment
- $24,975
- Closing costs
- $2,997
- Reserves months
- —
- Total cash needed
- —
Loan-product check · same deal, 3 products live
Conventional
25% down · 7.5% · 30yr
- Down + closing
- —
- Monthly P&I
- —
- Monthly cashflow
- —
- DSCR
- —
- Eligible?
- —
Personal DTI + credit; lowest rate.
DSCR
20% down · 8.5% · 30yr
- Down + closing
- —
- Monthly P&I
- —
- Monthly cashflow
- —
- DSCR
- —
- Eligible?
- —
No personal income docs; deal must DSCR.
Hard money
10% down · 12.0% · 12mo
- Down + closing
- —
- Monthly P&I
- —
- Monthly cashflow
- —
- DSCR
- —
- Eligible?
- —
Short-term bridge; refi at stabilization.
Listing history 7 events
-
2026-06-18days on market $99,900 Active 7 DOM
-
2026-06-17days on market $99,900 Active 6 DOM
-
2026-06-16days on market $99,900 Active 5 DOM
-
2026-06-15days on market $99,900 Active 4 DOM
-
2026-06-13days on market $99,900 Active 2 DOM
-
2026-06-12remarks 521-char remark
-
2026-06-12$99,900 Active 1 DOM
ⓘ Source: listings_history table (triggers on properties + properties_extension) + one-shot
backfill from property_details.listing_events for pre-trigger history.
Climate risk First Street
- Flood 4/10 Moderate 22% chance over 30 yrs
- Wildfire 1/10 Low
- Heat 5/10 Major 7 d/yr ≥106°F today · 19 d/yr by 30 yrs out
- Wind 2/10 Low 3% chance of damaging wind over 30 yrs
- Air quality 3/10 Moderate 2 unhealthy d/yr today · 3 by 30 yrs out
Nearby sold comps map
Loading sold comps map…
Walkable amenities ~0.75 mi
Loading nearby amenities…
Taxation est. · year 1
- Rental income
- $15,967
- − Mortgage interest
- −$5,596
- − Property taxes
- −$1,498
- − Insurance
- −$500
- − Repairs & maintenance
- −$1,277
- − Management
- −$1,277
- − Depreciation
- −$2,906
- Taxable income
- $2,913
- Est. tax owed @ 24.0%
- −$699
- After-tax cash flow
- $3,631/yr
For passive investors: Depreciation is non-cash, so a rental often shows a tax loss while cash-flowing — sheltering income. Rental losses are passive: they offset passive income freely, and up to $25,000/yr can offset ordinary (W-2) income if you actively participate and your MAGI is under $100k (phasing out to $0 by $150k); unused losses carry forward. On sale, claimed depreciation is recaptured at up to 25%, and gains may owe capital-gains tax (a 1031 exchange can defer both). Figures are a year-1 estimate at your 24.0% rate — not tax advice; consult a CPA.
Schools (NCES district)
- District
- Vincennes Community School Corporation
- NCES district ID
- 1812120
- Math proficiency
- 34% ▼ -5.00%
- Reading proficiency
- 38% ▼ -4.00%
- Median HH income
- $38,359
- Composite
- 30.05/100
- National rank
- #6354
- State rank
- #193 of 301 in IN
Livability — Vincennes
- Score
- 70/100
- State rank
- #148
- US rank
- #7480
Category grades
Schools grade is shown separately in the Schools card above.
Census & demographics
- Census place
- Vincennes, IN
- Population (ZIP)
- 25,191
Population outlook (Knox County) Hauer SSP2
- Today (2025)
- 37,092 people
- By 2030
- 36,271 · -2.2%
- By 2040
- 34,196 · -7.8%
- By 2050
- 32,405 · -12.6%
- By 2075
- 28,754 · -22.5%
- By 2100
- 24,110 · -35.0%
Race, ethnicity, and origin ACS 2023
- Neighborhood character
- Predominantly White (88%)
- Race & ethnicity
- White 88% Two or more races 6% Hispanic / Latino 3% Black 2% Asian 1%
- Common ancestry
- Lithuanian 4% Romanian 2% Slovak 2%
- Foreign-born
- 3% · Canada, China
- Languages at home
- 95% English-only · Spanish 2% French/Haitian/Cajun 1% Chinese 1%
Political lean MEDSL · Knox
- 2024 margin
- Solid R (+50.4) · D 24.0% · R 74.4% · Other 1.6%
- 2008→2024 swing
- -43.9pp toward R · 2008: -6.5pp · 2024: -50.4pp
- All cycles
- 2024: R+50.4 2020: R+47.4 2016: R+47.2 2012: R+28.9 2008: R+6.5
Not yet ingested
- Civics
- —
Market trends
- HPI YoY
- ▼ -47.26%
- Current HPI
- 194.903
- Rent YoY
- —
- Metro
- —
- State GDP YoY
- ▲ 2.90%
- F500 in state
- 18
Industry mix (Fortune 500 HQ in IN)
| Industry | F500 HQs | Revenue |
|---|---|---|
| Industrial Machinery | 2 | $37B |
|
||
| Healthcare | 1 | $177B |
|
||
| Pharmaceuticals | 1 | $45B |
|
||
| Metals / Steel | 1 | $18B |
|
||
| Agriculture | 1 | $17B |
|
||
| Packaging | 1 | $12B |
|
||
Price history
1 event — show timeline
- 2026-06-11 Listed $99,900 IRMLS
Property tax history
+3.7%/yrLatest (2024): $20 · +33.3% YoY. Source: county tax records.
Cash-flow waterfall
monthlySold comps — $/sqft
last 12 mo · ≤1 miLoading sold comps…