504 Dorwood Park · Ransomville, NY
Flood risk 1/10 · Minimal
- FEMA flood zone
- X (unshaded)
- Chance of flooding over 30 yrs
- 0.0%
- Est. flood insurance / yr
- $507 – $1,088
Fire risk 1/10 · Minimal
- Est. fire insurance / yr
- $691 – $1,283
Heat risk 3/10 · Minor
- Hot days now (above 95°F)
- 7 days/yr
- Hot days in 30 yrs
- 14 days/yr
Wind risk 1/10 · Minimal
- Chance of severe wind over 30 yrs
- —
Air-quality risk 2/10 · Minimal
- Unhealthy air days now
- 1 days/yr
- Unhealthy air days in 30 yrs
- 2 days/yr
Risk factors via First Street. Map © Google.
Why this score? — see what drove the D+ grade
The composite is a weighted blend of 9 inputs, each scored 0–100. Each bar is that input's sub-score; the figure is the points it added to the 100-point composite (weight × sub-score).
- Cash flow +15.0/30.0
- Appreciation +10.0/10.0
- 1% rule +5.0/10.0
- DSCR +5.0/10.0
- Schools +4.6/10.0
- Condition / age +4.0/5.0
- Livability +3.4/5.0
- Rent growth +2.5/5.0
- ARV discount +0.0/15.0
$19,999
🖨 Deal sheet 📄 Offer letter ✓ Due diligence
Listing remarks
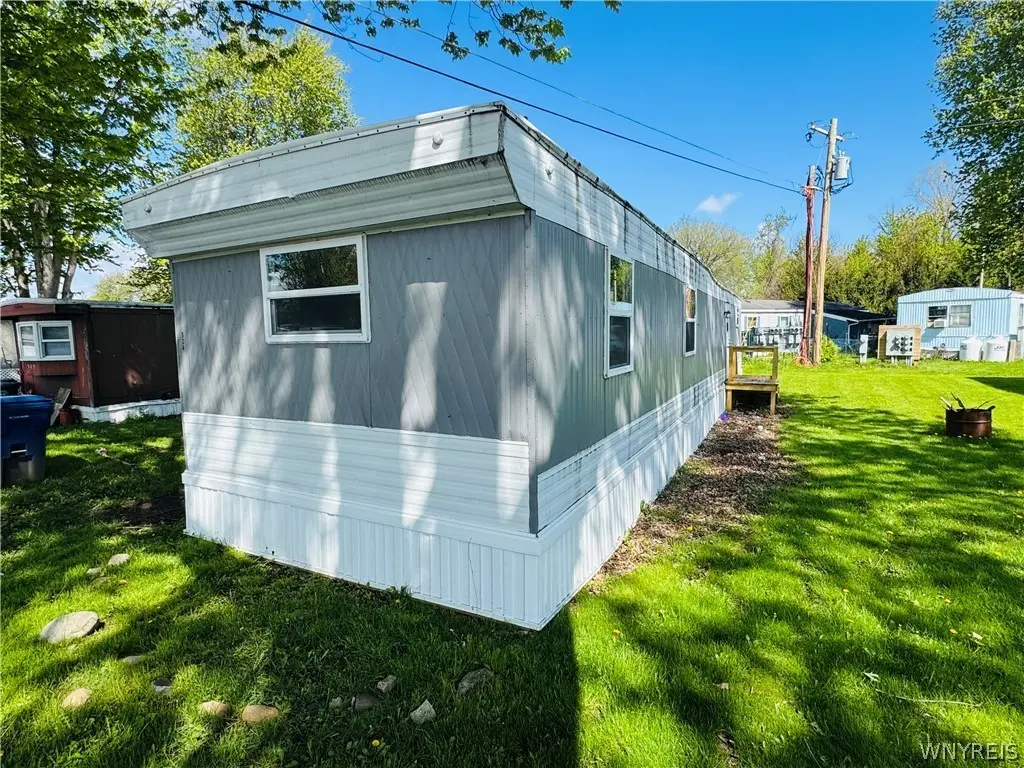
Welcome to Dorwood Mobile Home Community in Ransomville, NY! This beautifully renovated 2-bedroom, 1-bath mobile home offers a fresh, modern feel with extensive updates throughout. Major improvements include new electrical, new roof, new skirting, furnace, water heater, new windows, and a fully renovated kitchen and bathroom, giving buyers the benefit of a move-in ready home with many of the big-ticket items already completed. The bright, refreshed interior features clean finishes, functional living space, and a comfortable layout designed for easy everyday living. The kitchen is equipped with a brand-new propane stove and brand-new refrigerator, adding even more value and convenience. Off
Key facts
- New skirting
- New electrical
- New roof
Tags
Property features AI
Finance
- HOA & community: Has land lease ($600)
Exterior
- Parking: No garage
- Utilities: Electricity available and connected (circuit breakers); Water available (public; not connected); Septic tank
- Home design: Single-wide mobile home; Single story; Resale condition
- Construction: Aluminum siding; PEX plumbing; Rolled / hot mop roof; Pillar/post/pier foundation; Year built: existing/unknown
- Exterior features: Blacktop driveway; Leased propane tank; Shed(s) / outdoor storage; Rectangular lot; Private road frontage
Interior
- Kitchen: Gas oven; Gas range; Refrigerator
- Bedrooms: 2 main-level bedrooms
- Flooring: Carpet; Luxury vinyl; Varies
- Bathrooms: 1 full bathroom (main level)
- Heating & cooling: Propane forced-air heating
- Interior features: Thermal windows; Accessible doors; Eat-in kitchen; See remarks / other interior features
- Laundry & utility: Electric water heater
Neighborhood map
What this means for you Summary
Snapshot
- This is a 2-bed/1.0-bath manufactured listed at $20k. Condition is rated good.
Deal economics
- At list price, monthly cash flow is $574 ($7k/yr) — positive.
- The deal already cash-flows at list — no discount required.
- Meets the 1% rule at list price ($902 rent vs $20k).
- Recommended offer: $20k (1.5% below list) — sets the bar for market timing.
- Cap rate 40.8% vs local median 2.6% in Ransomville — top-decile yield for the area; either an underpriced asset or a hidden risk that comps aren't pricing in. Stress-test before assuming the spread holds.
Location & tenants
- Location reads 68/100 on livability (#548 in NY) — a middle-class / working-renter tenant base. Strengths: employment A+, housing A+, crime A; Watch: schools F, amenities F, commute F.
- Wilson Central School District (town): math 52% / reading 55% proficiency, ranked #319 of 590 in NY (top 54%) — acceptable for families but not a draw, mixed tenant base, ~2y average lease.
- Market conditions: 32 active listings in the ZIP; 167 units permitted in Niagara County in 2024 (0 in 5+ unit buildings).
Forward outlook
- In year one you build about $2k of equity ($138 loan paydown + $2k appreciation (10.0% local appreciation)).
- Niagara County population projected at -19% by 2050 — secular population decline; favor cash flow + early exit over multi-decade hold.
- At projected returns (10.0% appreciation + 3.0% rent growth), your $6k cash investment doubles in ~1 year — after that, you're playing with house money.
Negotiation context
- It's been on market 25 days — a 2% lower offer ($20k) is reasonable based on typical stale-listing flexibility.
- Current owner paid $17k; 18% above their basis — modest negotiation headroom, anchor on the comps not their cost.
Questions for the listing agent
- Built in 1976 — when were the roof, HVAC, electrical panel, plumbing, and water heater last replaced?
- Is there a deadline driving the sale (1031 exchange, divorce, estate, relocation)? That informs how much negotiation room exists.
- Schools are F-rated, which usually means shorter tenancies and higher turnover. Who's the typical renter profile here, and what's been the actual vacancy rate?
- The area grade is low — what's the realistic commute time and amenity access for the typical tenant pool here? Any planned neighborhood developments (good or bad) we should know about?
- What's the average days-on-market for RENTAL listings here right now (not sales)? A rising rental-DOM trend means longer vacancies and softer asking-rent achievability than the comps imply.
- What's the recent tenant-quality profile in this submarket — average credit score on applications, eviction rate, late-payment / NSF rate, and stable-employment percentage? A property-management company in the area should have these aggregated.
- How much new for-sale + rental construction is in the pipeline within 1–3 miles? Heavy new supply typically softens prices + rents 12–24 months out; constrained supply supports both.
Investment metrics
- 1% rule
- 4.51% ✓
- Cap rate
- 40.76%
- Cash-on-cash
- 123.11%
- DSCR
- 6.48
- GRM
- 1.8
CMA / ARV
- ARV (median comp)
- $17,000
- List price
- $19,999
- Delta
- 17.64%
- Verdict
- OVERPRICED
- Comps
- 1 within 2.0 mi
Show comp detail 1 sale within ~0.75 mi
| Address | Dist | Beds/Ba | Sqft | Sold | Price | $/sf | Match |
|---|---|---|---|---|---|---|---|
| 504 Dorwood Park | 0.00mi | 2/1.0 | 720 (0%) | 1mo | $17,000 | $24 | 100 |
Match score weights: distance 35% · size 25% · config 20% · recency 20%. Top-matched comps best support the ARV.
Projected returns pro-forma
10.0% appreciation · 3.0% rent growth · sell at horizon
- IRR
- —
- Equity multiple
- 9.48×
- Total profit
- $47,496
- Equity at exit
- $18,017
- IRR
- —
- Equity multiple
- 20.84×
- Total profit
- $111,120
- Equity at exit
- $38,854
Cash invested: $5,600 (down + closing). Projections, not guarantees.
Landlord ↔ Tenant lean methodology
- Overall (STATE)
- 15 Strongly Tenant-Friendly
- State New York
- 15 Strongly Tenant-Friendly · D+10
- County
- — inherits STATE
- City
- — inherits STATE
ZIP-level market 14131
- Home prices YoY
- 7.8%
- Active inventory
- 32
- Price-to-rent
- 1.8×
Monthly cashflow live
- Estimated rent
- $902 medium interval (Pro) →
- Mortgage (P&I)
- −$105
- Tax est. 1.5%
- −$25 /mo · $300/yr
- Insurance
- −$8
- HOA
- −$0
- Vacancy / Maint / Mgmt
- −$189
- Net cashflow
- $574
Break-even live
UW: 25.0% down · 7.5% · 30yr · 1.5% tax · 5.0% vac · 8.0% maint · 8.0% mgmt
Financing live
Cash to close
- Down payment
- $5,000
- Closing costs
- $600
- Reserves months
- —
- Total cash needed
- —
Loan-product check · same deal, 3 products live
Conventional
25% down · 7.5% · 30yr
- Down + closing
- —
- Monthly P&I
- —
- Monthly cashflow
- —
- DSCR
- —
- Eligible?
- —
Personal DTI + credit; lowest rate.
DSCR
20% down · 8.5% · 30yr
- Down + closing
- —
- Monthly P&I
- —
- Monthly cashflow
- —
- DSCR
- —
- Eligible?
- —
No personal income docs; deal must DSCR.
Hard money
10% down · 12.0% · 12mo
- Down + closing
- —
- Monthly P&I
- —
- Monthly cashflow
- —
- DSCR
- —
- Eligible?
- —
Short-term bridge; refi at stabilization.
Listing history 5 events
-
2026-06-03statusdays on market $19,999 Pending 25 DOM
-
2026-06-02days on market $19,999 Active 24 DOM
-
2026-06-01days on market $19,999 Active 23 DOM
-
2026-05-31days on market $19,999 Active 22 DOM
-
2026-05-08$19,999 Active 1014-char remark
ⓘ Source: listings_history table (triggers on properties + properties_extension) + one-shot
backfill from property_details.listing_events for pre-trigger history.
Climate risk First Street
- Flood 1/10 Low FEMA zone X (unshaded) · 0% chance over 30 yrs
- Wildfire 1/10 Low
- Heat 3/10 Moderate 7 d/yr ≥95°F today · 14 d/yr by 30 yrs out
- Wind 1/10 Low
- Air quality 2/10 Low 1 unhealthy d/yr today · 2 by 30 yrs out
Nearby sold comps map
Loading sold comps map…
Walkable amenities ~0.75 mi
Loading nearby amenities…
Taxation est. · year 1
- Rental income
- $10,826
- − Mortgage interest
- −$1,120
- − Property taxes
- −$300
- − Insurance
- −$100
- − Repairs & maintenance
- −$866
- − Management
- −$866
- − Depreciation
- −$582
- Taxable income
- $6,992
- Est. tax owed @ 24.0%
- −$1,678
- After-tax cash flow
- $5,216/yr
For passive investors: Depreciation is non-cash, so a rental often shows a tax loss while cash-flowing — sheltering income. Rental losses are passive: they offset passive income freely, and up to $25,000/yr can offset ordinary (W-2) income if you actively participate and your MAGI is under $100k (phasing out to $0 by $150k); unused losses carry forward. On sale, claimed depreciation is recaptured at up to 25%, and gains may owe capital-gains tax (a 1031 exchange can defer both). Figures are a year-1 estimate at your 24.0% rate — not tax advice; consult a CPA.
Condition & rehab AI · 2 photos
This beautifully renovated mobile home in Dorwood Park, Ransomville, NY, offers a fresh, modern feel with extensive updates, making it a move-in ready property with high resale and rental value.
Value-add opportunities
- Both Landscaping improvements — Enhances curb appeal and property value.
- Both Painting exterior and interior — Freshens up the home's appearance and value.
- Both Landscaping and curb appeal — Improves the home's curb appeal and rental value.
- Both Add a small patio or deck — Increases living space and enhances curb appeal.
- Both Install a smart thermostat — Improves energy efficiency and adds a modern touch.
Renovation cost estimate screening
Value-add ROI direction
- Both Landscaping improvements — Enhances curb appeal and property value. ↑
- Both Painting exterior and interior — Freshens up the home's appearance and value. ↑
- Both Landscaping and curb appeal — Improves the home's curb appeal and rental value. ↑
- Both Add a small patio or deck — Increases living space and enhances curb appeal. ↑
- Both Install a smart thermostat — Improves energy efficiency and adds a modern touch. ↑
ⓘ Cost ranges are severity-bucket heuristics (US national rule-of-thumb). Get contractor quotes + a written scope before underwriting a rehab budget.
Schools (NCES district)
- District
- Wilson Central School District
- NCES district ID
- 3631560
- Math proficiency
- 52% ▼ -7.00%
- Reading proficiency
- 55% ▲ 3.00%
- Median HH income
- $57,181
- Composite
- 46.37/100
- National rank
- #2462
- State rank
- #319 of 590 in NY
Livability — Ransomville
- Score
- 68/100
- State rank
- #548
- US rank
- #9859
Category grades
Schools grade is shown separately in the Schools card above.
Census & demographics
- City population
- 5,339
- Population (ZIP)
- 5,339
Population outlook (Niagara County) Hauer SSP2
- Today (2025)
- 204,149 people
- By 2030
- 197,900 · -3.1%
- By 2040
- 182,239 · -10.7%
- By 2050
- 165,198 · -19.1%
- By 2075
- 129,416 · -36.6%
- By 2100
- 96,222 · -52.9%
Race, ethnicity, and origin ACS 2023
- Neighborhood character
- Predominantly White (94%)
- Race & ethnicity
- White 94% Two or more races 4% Hispanic / Latino 3% Black 2%
- Common ancestry
- Romanian 14% Slovak 4% Lithuanian 2%
- Foreign-born
- 2% · Canada
- Languages at home
- 98% English-only · Spanish 1%
Political lean MEDSL · Niagara
- 2024 margin
- R (+14.9) · D 42.5% · R 57.5%
- 2008→2024 swing
- -15.9pp toward R · 2008: 1.0pp · 2024: -14.9pp
- All cycles
- 2024: R+14.9 2020: R+9.7 2016: R+19.0 2012: D+0.6 2008: D+1.0
Not yet ingested
- Civics
- —
Market trends
- HPI YoY
- ▲ 21.41%
- Current HPI
- 297.4314
- Rent YoY
- —
- Metro
- —
- State GDP YoY
- ▲ 2.60%
- F500 in state
- 92
Industry mix (Fortune 500 HQ in NY)
| Industry | F500 HQs | Revenue |
|---|---|---|
| Financial Services | 10 | $950B |
|
||
| Consumer Goods | 9 | $162B |
|
||
| Insurance | 4 | $225B |
|
||
| Telecommunications | 2 | $144B |
|
||
| Pharmaceuticals | 2 | $112B |
|
||
| Media / Entertainment | 2 | $69B |
|
||
Price history
-15.0% since first listed3 events — show timeline
- 2026-06-03 Pending — WNYREIS
- 2026-06-03 Sold (MLS) $17,000 WNYREIS
- 2026-05-08 Listed $19,999 WNYREIS
Cash-flow waterfall
monthlySold comps — $/sqft
last 12 mo · ≤1 miLoading sold comps…