 Multi-family
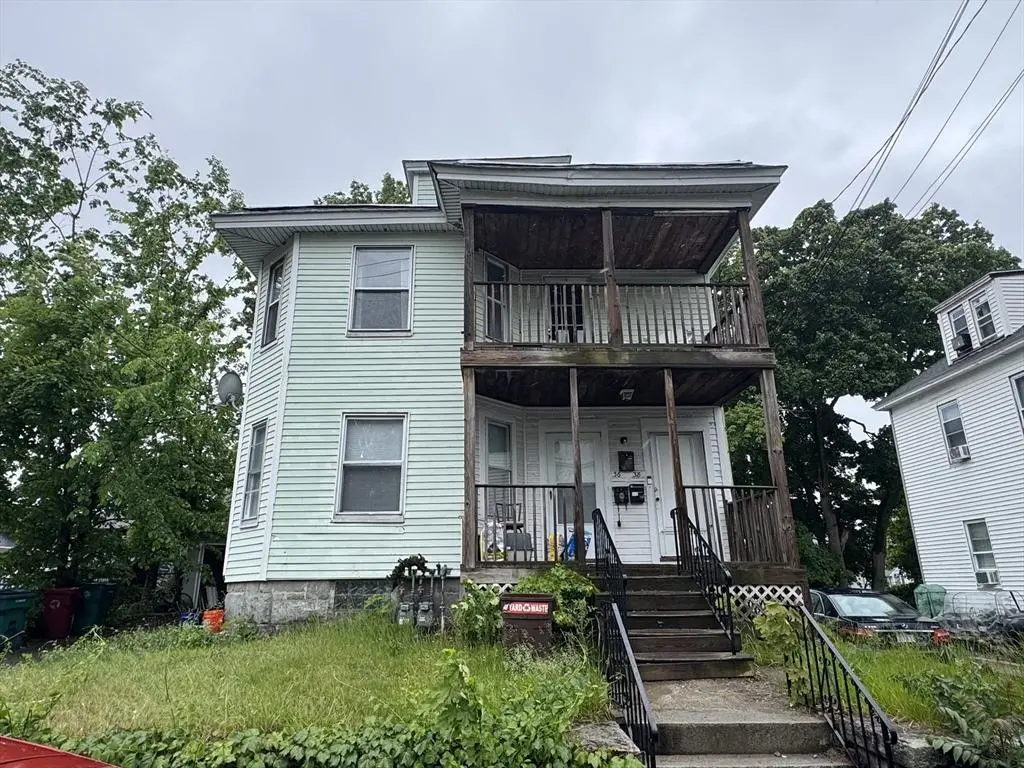
36 Plymouth St · Lowell, MA
Flood risk No data
- FEMA flood zone
- —
- Chance of flooding over 30 yrs
- —
- Est. flood insurance / yr
- —
Fire risk No data
- Est. fire insurance / yr
- —
Heat risk No data
- Hot days now (above threshold)
- —
- Hot days in 30 yrs
- —
Wind risk No data
- Chance of severe wind over 30 yrs
- —
Air-quality risk No data
- Unhealthy air days now
- —
- Unhealthy air days in 30 yrs
- —
Risk factors via First Street. Map © Google.
Why this score? — see what drove the C- grade
The composite is a weighted blend of 9 inputs, each scored 0–100. Each bar is that input's sub-score; the figure is the points it added to the 100-point composite (weight × sub-score).
- Cash flow +24.8/30.0
- DSCR +8.0/10.0
- 1% rule +5.9/10.0
- Livability +4.0/5.0
- Rent growth +2.9/5.0
- Condition / age +2.5/5.0
- Schools +2.1/10.0
- ARV discount +0.0/15.0
- Appreciation +0.0/10.0
$829,900
🖨 Deal sheet 📄 Offer letter ✓ Due diligence
Multi-family units
County records classify this as Multi-Family (2-4 Unit). Listing-text estimate: 1 unit. estimate disagrees with records
Listing remarks MLS
"Important"Make appointments through Showingtime app or call Showings to start on Wednesday September 7th, 2022 at noontime. Valid proof of funds or bank financing emailed to listing office prior to showing. Offers will be collected at the end of the week and reviewed Please do not approach occupants or go onto the property grounds. "Property is sold as is" home inspection is ok but for reference purposes only.
Key facts
- Off street parking
- 1 stall garage
- Turnkey condition
Tags
Property features AI
Finance
- HOA & community: Not a senior community
Exterior
- Parking: 1-car garage; 1 covered parking space; 2 open parking spaces; Paved drive and off-street parking (3 total parking spaces)
- Utilities: Public water; Public sewer; 100 Amp electric service; Gas service for range
- Home design: Multi-family property; 3 stories total; 3 levels in building
- Construction: Stone foundation; Shingle roof; Built (year from public records)
- Exterior features: Porch; River nearby; Within 0.3–0.5 mile to the beach
Interior
- Kitchen: Range; Refrigerator
- Bedrooms: Unit 1 is 1 level; Unit 2 is 2 levels
- Flooring: Wood; Tile; Hardwood
- Bathrooms: 2 full bathrooms
- Heating & cooling: Hot water heating; Steam heating; Natural gas heating
- Interior features: Insulated windows; Total of 15 rooms
Neighborhood map
What this means for you Summary
Snapshot
- This is a 6-bed/2.0-bath multifamily listed at $830k.
Deal economics
- At list price, monthly cash flow is $2k ($21k/yr) — positive.
- The deal already cash-flows at list — no discount required.
- Meets the 1% rule at list price ($9k rent vs $830k).
- Recommended offer: $817k (1.5% below list) — sets the bar for market timing.
- Cap rate 8.8% vs local median 3.1% in Lowell — top-decile yield for the area; either an underpriced asset or a hidden risk that comps aren't pricing in. Stress-test before assuming the spread holds.
Location & tenants
- Location reads 80/100 on livability (#36 in MA, #1,677 nationally) — a professional / high-income tenant draw. Strengths: amenities A+, commute A+, health & safety A+; Watch: schools C-, crime F, cost of living F.
- Lowell (suburban): math 20% / reading 28% proficiency, ranked #277 of 302 in MA (top 92%) — low school quality limits family demand, transient renter base, plan for 1-2y turnover; 64% free/reduced lunch — lower-income household profile, screen leases tightly.
- Market conditions: Rents rising (+1.5%/yr); 19 active listings in the ZIP; 2 comparable units currently listed for rent nearby; 3,670 units permitted in Middlesex County in 2024 (2,611 in 5+ unit buildings).
- At $9,069/mo this rent would consume 150% of the median local household income ($73k/yr) (locally 1612% of renters already pay >50% of income on rent) — very limited rent-growth headroom before tenants either downsize or default.
Forward outlook
- Local home prices are declining (-3.0%/yr); year-one equity from $6k of loan paydown is wiped out by about $25k of value loss. Plan a longer hold.
- Middlesex County population projected at +20% by 2050 — long-run rental-demand tailwind backs the buy-and-hold thesis.
Negotiation context
- It's been on market 16 days — a 2% lower offer ($817k) is reasonable based on typical stale-listing flexibility.
- 2 sale attempts since 4y ago with the ask held roughly flat each time — persistent listings suggest the price (not the market) is what's stuck; bring a comps-based counter.
- Current owner paid $650k; 28% above their basis — modest negotiation headroom, anchor on the comps not their cost.
Risks & watch-outs
- Watch-outs: built in 1930 — expect roof / HVAC / electrical / plumbing capex.
Questions for the listing agent
- Built in 1930 — when were the roof, HVAC, electrical panel, plumbing, and water heater last replaced?
- Is there a deadline driving the sale (1031 exchange, divorce, estate, relocation)? That informs how much negotiation room exists.
- Crime grade is F in this area — have there been break-ins, vandalism, or insurance claims at this property in the last 3 years? What carrier currently insures it and at what premium?
- What's the average days-on-market for RENTAL listings here right now (not sales)? A rising rental-DOM trend means longer vacancies and softer asking-rent achievability than the comps imply.
- What's the recent tenant-quality profile in this submarket — average credit score on applications, eviction rate, late-payment / NSF rate, and stable-employment percentage? A property-management company in the area should have these aggregated.
- How much new apartment / multifamily construction is in the pipeline within 1–3 miles? Heavy new supply (>2% of stock underway) typically softens rents 12–24 months out; light construction supports rent growth.
Investment metrics
- 1% rule
- 1.09% ✓
- Cap rate
- 8.81%
- Cash-on-cash
- 9.00%
- DSCR
- 1.40
- GRM
- 7.6
CMA / ARV
- ARV (on-the-fly)
- $711,942
- Comps found
- 12
Show comp detail 12 sales within ~0.75 mi
| Address | Dist | Beds/Ba | Sqft | Sold | Price | $/sf | Match |
|---|---|---|---|---|---|---|---|
| 15 Varney | 0.50mi | 6/2.0 | 3,131 (+2%) | 3mo | $770,000 | $246 | 72 |
| 101-103 Dracut St | 0.41mi | 6/2.0 | 2,920 (-5%) | 2mo | $725,000 | $248 | 71 |
| 151-153 Gershom Ave | 0.31mi | 6/2.0 | 3,325 (+8%) | 13mo | $720,000 | $217 | 62 |
| 41 Butterfield St | 0.55mi | 6/2.5 | 2,942 (-4%) | 5mo | $680,000 | $231 | 61 |
| 19 Oliver St | 0.49mi | 6/4.0 | 2,900 (-6%) | 0mo | $790,000 | $272 | 59 |
| 231 School St | 0.58mi | 6/2.0 | 3,073 (-0%) | 21mo | $570,000 | $185 | 56 |
| 51-53 Orchard St | 0.54mi | 6/2.0 | 3,333 (+8%) | 11mo | $790,000 | $237 | 52 |
| 85 Varney St | 0.52mi | 6/2.0 | 2,688 (-13%) | 9mo | $625,000 | $233 | 47 |
| 274 Fletcher St | 0.72mi | 5/3.0 (-1) | 3,017 (-2%) | 10mo | $675,000 | $224 | 46 |
| 47 Mount Vernon | 0.34mi | 6/3.5 | 3,497 (+14%) | 12mo | $750,000 | $214 | 46 |
| 61 Butterfield St | 0.55mi | 7/2.0 (+1) | 3,414 (+11%) | 9mo | $725,000 | $212 | 44 |
| 197 White St | 0.23mi | 6/4.0 | 3,454 (+12%) | 24mo | $705,000 | $204 | 41 |
Match score weights: distance 35% · size 25% · config 20% · recency 20%. Top-matched comps best support the ARV.
Projected returns pro-forma
-3.0% appreciation · 1.54% rent growth · sell at horizon
- IRR
- -4.3%
- Equity multiple
- 0.84×
- Total profit
- $-36,668
- Equity at exit
- $123,741
- IRR
- 3.7%
- Equity multiple
- 1.25×
- Total profit
- $58,447
- Equity at exit
- $71,755
Cash invested: $232,372 (down + closing). Projections, not guarantees.
Landlord ↔ Tenant lean methodology
- Overall (STATE)
- 20 Strongly Tenant-Friendly
- State Massachusetts
- 20 Strongly Tenant-Friendly · D+15
- County
- — inherits STATE
- City
- — inherits STATE
ZIP-level market 01854
- Home prices YoY
- -13.8%
- Rents YoY
- 1.5%
- Active inventory
- 19
- Price-to-rent
- 24.3×
Monthly cashflow live
- Estimated rent
- $9,069 high interval (Pro) →
- Mortgage (P&I)
- −$4,352
- Tax from tax record
- −$724 /mo · $8,686/yr
- Insurance
- −$346
- HOA
- −$0
- Vacancy / Maint / Mgmt
- −$1,904
- Net cashflow
- $1,743
Break-even live
3-unit breakdown (identical units grouped — click to expand)
| Units | Beds | Baths | Est. rent |
|---|---|---|---|
| 1× unit | 4 | 1 | $2,842 |
| 2× units | 5 | 1 | $6,226 |
| #2 | 5 | 1 | $3,113 |
| #3 | 5 | 1 | $3,113 |
| Total (3 units) | $9,069 | ||
UW: 25.0% down · 7.5% · 30yr · 1.5% tax · 5.0% vac · 8.0% maint · 8.0% mgmt
Financing live
Cash to close
- Down payment
- $207,475
- Closing costs
- $24,897
- Reserves months
- —
- Total cash needed
- —
Loan-product check · same deal, 3 products live
Conventional
25% down · 7.5% · 30yr
- Down + closing
- —
- Monthly P&I
- —
- Monthly cashflow
- —
- DSCR
- —
- Eligible?
- —
Personal DTI + credit; lowest rate.
DSCR
20% down · 8.5% · 30yr
- Down + closing
- —
- Monthly P&I
- —
- Monthly cashflow
- —
- DSCR
- —
- Eligible?
- —
No personal income docs; deal must DSCR.
Hard money
10% down · 12.0% · 12mo
- Down + closing
- —
- Monthly P&I
- —
- Monthly cashflow
- —
- DSCR
- —
- Eligible?
- —
Short-term bridge; refi at stabilization.
Rent comps 2 comps
| Address | Beds | Baths | Sqft | Rent | $/sqft | DOM | Units | Dist |
|---|---|---|---|---|---|---|---|---|
| 13 Phillips St Lowell, MA | 6.0 | 2.0 | 2500 | $3,500 | $1.40 | 43d | 1 | 0.59mi |
| 27 Burtt St Unit 1 Lowell, MA | 5.0 | 2.0 | 4266 | $3,600 | $0.84 | 16d | 1 | 1.34mi |
Listing history 12 events
-
2026-06-18days on market $829,900 Active 16 DOM
-
2026-06-17days on market $829,900 Active 15 DOM
-
2026-06-16days on market $829,900 Active 14 DOM
-
2026-06-15days on market $829,900 Active 13 DOM
-
2026-06-13days on market $829,900 Active 11 DOM
-
2026-06-13days on market $829,900 Active 10 DOM
-
2026-06-09days on market $829,900 Active 7 DOM
-
2026-06-08days on market $829,900 Active 6 DOM
-
2026-06-07statusdays on market $829,900 Active 5 DOM
-
2026-06-04days on market $829,900 New 2 DOM
-
2026-06-03remarks 479-char remark
-
2026-06-03$829,900 New 1 DOM
ⓘ Source: listings_history table (triggers on properties + properties_extension) + one-shot
backfill from property_details.listing_events for pre-trigger history.
Tax reassessment forecast MA · Partial reset (capped growth)
- Current annual tax
- $8,686 · $724/mo
- Projected year-2 tax
- $9,447 · $787/mo
- Expected delta
- +$761/yr (+$63/mo · 8.8%)
ⓘ Screening estimate from a state-policy table — verify with the county assessor before closing.
Nearby sold comps map
Loading sold comps map…
Walkable amenities ~0.75 mi
Loading nearby amenities…
Taxation est. · year 1
- Rental income
- $108,828
- − Mortgage interest
- −$46,487
- − Property taxes
- −$8,686
- − Insurance
- −$4,150
- − Repairs & maintenance
- −$8,706
- − Management
- −$8,706
- − Depreciation
- −$24,143
- Taxable income
- $7,950
- Est. tax owed @ 24.0%
- −$1,908
- After-tax cash flow
- $19,006/yr
For passive investors: Depreciation is non-cash, so a rental often shows a tax loss while cash-flowing — sheltering income. Rental losses are passive: they offset passive income freely, and up to $25,000/yr can offset ordinary (W-2) income if you actively participate and your MAGI is under $100k (phasing out to $0 by $150k); unused losses carry forward. On sale, claimed depreciation is recaptured at up to 25%, and gains may owe capital-gains tax (a 1031 exchange can defer both). Figures are a year-1 estimate at your 24.0% rate — not tax advice; consult a CPA.
Schools (NCES district)
- District
- Lowell
- NCES district ID
- 2507020
- Math proficiency
- 20% ▼ -18.00%
- Reading proficiency
- 28% ▼ -11.00%
- Median HH income
- $49,291
- Composite
- 21.14/100
- National rank
- #8430
- State rank
- #277 of 302 in MA
Livability — Lowell
- Score
- 80/100
- State rank
- #36
- US rank
- #1677
Category grades
Schools grade is shown separately in the Schools card above.
Census & demographics
- Census place
- Lowell, MA
- County
- Middlesex County · 1,437,704 people
- City population
- 100,628
- Metro
- Boston-Cambridge-Newton, MA-NH
- Population (ZIP)
- 30,081
- Household income
- $72,709
- Rent vs Own
- Severe rent burden
- 1612.0
Population outlook (Middlesex County) Hauer SSP2
- Today (2025)
- 1,740,269 people
- By 2030
- 1,817,187 · +4.4%
- By 2040
- 1,963,195 · +12.8%
- By 2050
- 2,087,461 · +20.0%
- By 2075
- 2,344,036 · +34.7%
- By 2100
- 2,383,776 · +37.0%
Race, ethnicity, and origin ACS 2023
- Neighborhood character
- Diverse neighborhood (Simpson 0.68)
- Race & ethnicity
- White 50% Hispanic / Latino 22% Asian 13% Black 12% Two or more races 10%
- Hispanic origin (detail)
- Puerto Rican 13% Dominican 3%
- Common ancestry
- Lithuanian 5% Romanian 4% Russian 2%
- Foreign-born
- 22% · Canada, Jamaica, China
- Languages at home
- 65% English-only · Spanish 14% Other Asian/Pacific 7% Other Indo-European 7%
Political lean MEDSL · Middlesex
- 2024 margin
- Solid D (+39.5) · D 68.5% · R 29.0% · Other 2.5%
- 2008→2024 swing
- +9.3pp toward D · 2008: 30.1pp · 2024: 39.5pp
- All cycles
- 2024: D+39.5 2020: D+45.2 2016: D+38.1 2012: D+26.9 2008: D+30.1
Not yet ingested
- Civics
- —
Market trends
- HPI YoY
- ▼ -61.56%
- Current HPI
- 384.5209
- Rent YoY
- ▲ 1.54%
- Metro
- Boston-Cambridge-Newton, MA-NH
- State GDP YoY
- ▲ 2.28%
- F500 in state
- 38
Industry mix (Fortune 500 HQ in MA)
| Industry | F500 HQs | Revenue |
|---|---|---|
| Technology | 3 | $17B |
|
||
| Insurance | 2 | $84B |
|
||
| Retail | 2 | $76B |
|
||
| Life Sciences | 1 | $43B |
|
||
| Energy Technology | 1 | $31B |
|
||
| Aerospace / Defense | 1 | $18B |
|
||
Price history
+924.6% since first listed7 events — show timeline
- 2026-06-02 Listed $829,900 MLS PIN
- 2022-12-04 Rental Removed — RENT.
- 2022-11-10 Sold (MLS) $650,000 MLS PIN
- 2022-10-07 Pending — MLS PIN
- 2022-09-23 Contingent — MLS PIN
- 2022-09-02 Listed $659,000 MLS PIN
- 1997-01-29 Sold (Public Records) $81,000 Public Records
Property tax history
+5.4%/yrLatest (2025): $8,686 · +9.5% YoY. Source: county tax records.
Cash-flow waterfall
monthlySold comps — $/sqft
last 12 mo · ≤1 miLoading sold comps…