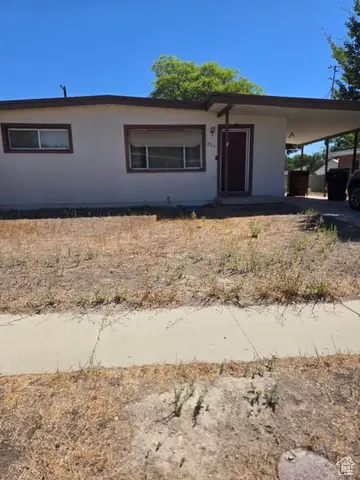
826 N 900 E · Price, UT
Flood risk 1/10 · Minimal
- FEMA flood zone
- X (unshaded)
- Chance of flooding over 30 yrs
- 0.0%
- Est. flood insurance / yr
- $473 – $860
Fire risk 5/10 · Moderate
- Est. fire insurance / yr
- $453 – $841
Heat risk 3/10 · Minor
- Hot days now (above 92°F)
- 4 days/yr
- Hot days in 30 yrs
- 10 days/yr
Wind risk 1/10 · Minimal
- Chance of severe wind over 30 yrs
- —
Air-quality risk 2/10 · Minimal
- Unhealthy air days now
- 1 days/yr
- Unhealthy air days in 30 yrs
- 2 days/yr
Risk factors via First Street. Map © Google.
Why this score? — see what drove the F grade
The composite is a weighted blend of 9 inputs, each scored 0–100. Each bar is that input's sub-score; the figure is the points it added to the 100-point composite (weight × sub-score).
- ARV discount +7.5/15.0
- Cash flow +5.9/30.0
- Livability +3.5/5.0
- Schools +3.4/10.0
- Rent growth +2.5/5.0
- Condition / age +2.5/5.0
- DSCR +0.3/10.0
- 1% rule +0.2/10.0
- Appreciation +0.0/10.0
$249,000
🖨 Deal sheet 📄 Offer letter ✓ Due diligence
Listing remarks MLS
Located on dead end street in North Price close to ballpark. Affordable Price on this nice home. Alleyway in the back for access to RV parking. 2 sheds 1 with electricity. New water heater-2024. 1/2 bath can have shower put in and walls to make it a full bath. Don't wait will not be on the market long. Showings start after August 25th.
Key facts
- Rv parking
- Electricity
- New water heater
Tags
Neighborhood map
What this means for you Summary
Snapshot
- This is a 4-bed/1.5-bath other listed at $249k.
Deal economics
- At list price, monthly cash flow is $-489 ($-6k/yr) — negative.
- To cash-flow at today's rent, offer at most $163k (34.7% below list).
- To meet the 1% rule (rent ≥ 1% of price), the offer needs to be $130k (47.9% below list).
- Recommended offer: $130k (47.9% below list) — sets the bar for 1% rule.
Location & tenants
- Location reads 69/100 on livability (#102 in UT) — a middle-class / working-renter tenant base. Strengths: cost of living A+, housing A+, crime A; Watch: schools C-, amenities F, commute F.
- Carbon District (town): math 36% / reading 43% proficiency, ranked #53 of 80 in UT (top 66%) — families likely to look elsewhere, expect single-tenant / working-renter base with shorter leases.
- Market conditions: 146 active listings in the ZIP; 196 units permitted in Carbon County in 2024 (168 in 5+ unit buildings).
Forward outlook
- Local home prices are declining (-3.0%/yr); year-one equity from $2k of loan paydown is wiped out by about $7k of value loss. Plan a longer hold.
- Carbon County population projected at -22% by 2050 — secular population decline; favor cash flow + early exit over multi-decade hold.
Negotiation context
- It's been on market 300 days — a 12% lower offer ($219k) is reasonable based on typical stale-listing flexibility.
- 6 sale attempts since 9y ago; this cycle's ask has dropped $26k (9%) from the opening price — seller is motivated, your offer sets the floor, not the list.
Risks & watch-outs
- Watch-outs: built in 1956 — expect roof / HVAC / electrical / plumbing capex.
- Climate carrying-cost: moderate wildfire risk — expect insurance premiums to compound above CPI over the hold.
Questions for the listing agent
- What do current leases actually rent for vs. the listed asking? Can we see a recent rent roll and the last 12 months of T-12 income?
- It's been on market 300 days. Have you received any prior offers? Is the seller open to a 48% concession, seller financing, or rate buy-down credit?
- Built in 1956 — when were the roof, HVAC, electrical panel, plumbing, and water heater last replaced?
- Why hasn't it sold? Are there any deal-killer items the seller is aware of (foundation, flood, title, zoning, code violations)?
- Is there a deadline driving the sale (1031 exchange, divorce, estate, relocation)? That informs how much negotiation room exists.
- The area grade is low — what's the realistic commute time and amenity access for the typical tenant pool here? Any planned neighborhood developments (good or bad) we should know about?
- What's the average days-on-market for RENTAL listings here right now (not sales)? A rising rental-DOM trend means longer vacancies and softer asking-rent achievability than the comps imply.
- What's the recent tenant-quality profile in this submarket — average credit score on applications, eviction rate, late-payment / NSF rate, and stable-employment percentage? A property-management company in the area should have these aggregated.
- How much new for-sale + rental construction is in the pipeline within 1–3 miles? Heavy new supply typically softens prices + rents 12–24 months out; constrained supply supports both.
Investment metrics
- 1% rule
- 0.52% ✗
- Cap rate
- 3.94%
- Cash-on-cash
- -8.41%
- DSCR
- 0.63
- GRM
- 16.0
CMA / ARV
No comps found within radius.
Projected returns pro-forma
-3.0% appreciation · 3.0% rent growth · sell at horizon
- IRR
- -31.2%
- Equity multiple
- -0.03×
- Total profit
- $-71,571
- Equity at exit
- $37,127
- IRR
- -34.9%
- Equity multiple
- -0.47×
- Total profit
- $-102,828
- Equity at exit
- $21,529
Cash invested: $69,720 (down + closing). Projections, not guarantees.
Landlord ↔ Tenant lean methodology
- Overall (STATE)
- 86 Strongly Landlord-Friendly
- State Utah
- 86 Strongly Landlord-Friendly · R+15
- County
- — inherits STATE
- City
- — inherits STATE
ZIP-level market 84501
- Active inventory
- 146
- Price-to-rent
- 16.0×
Monthly cashflow live
- Estimated rent
- $1,296 medium interval (Pro) →
- Mortgage (P&I)
- −$1,306
- Tax from tax record
- −$103 /mo · $1,234/yr
- Insurance
- −$104
- HOA
- −$0
- Vacancy / Maint / Mgmt
- −$272
- Net cashflow
- $-489
Break-even live
UW: 25.0% down · 7.5% · 30yr · 1.5% tax · 5.0% vac · 8.0% maint · 8.0% mgmt
Financing live
Cash to close
- Down payment
- $62,250
- Closing costs
- $7,470
- Reserves months
- —
- Total cash needed
- —
Loan-product check · same deal, 3 products live
Conventional
25% down · 7.5% · 30yr
- Down + closing
- —
- Monthly P&I
- —
- Monthly cashflow
- —
- DSCR
- —
- Eligible?
- —
Personal DTI + credit; lowest rate.
DSCR
20% down · 8.5% · 30yr
- Down + closing
- —
- Monthly P&I
- —
- Monthly cashflow
- —
- DSCR
- —
- Eligible?
- —
No personal income docs; deal must DSCR.
Hard money
10% down · 12.0% · 12mo
- Down + closing
- —
- Monthly P&I
- —
- Monthly cashflow
- —
- DSCR
- —
- Eligible?
- —
Short-term bridge; refi at stabilization.
Listing history 34 events
-
2026-06-18days on market $249,000 Active 300 DOM
-
2026-06-17days on market $249,000 Active 299 DOM
-
2026-06-16days on market $249,000 Active 298 DOM
-
2026-06-15days on market $249,000 Active 297 DOM
-
2026-06-14days on market $249,000 Active 295 DOM
-
2026-06-10days on market $249,000 Active 292 DOM
-
2026-06-09days on market $249,000 Active 291 DOM
-
2026-06-08days on market $249,000 Active 290 DOM
-
2026-06-07days on market $249,000 Active 289 DOM
-
2026-06-03days on market $249,000 Active 285 DOM
-
2026-06-02days on market $249,000 Active 284 DOM
-
2026-06-01days on market $249,000 Active 283 DOM
-
2026-05-31days on market $249,000 Active 282 DOM
-
2026-05-31days on market $249,000 Active 281 DOM
-
2026-05-14price $249,000 338-char remark
Show marketing remark (338 chars)
Located on dead end street in North Price close to ballpark. Affordable Price on this nice home. Alleyway in the back for access to RV parking. 2 sheds 1 with electricity. New water heater-2024. 1/2 bath can have shower put in and walls to make it a full bath. Don't wait will not be on the market long. Showings start after August 25th.
-
2026-03-29price $255,000 338-char remark
Show marketing remark (338 chars)
Located on dead end street in North Price close to ballpark. Affordable Price on this nice home. Alleyway in the back for access to RV parking. 2 sheds 1 with electricity. New water heater-2024. 1/2 bath can have shower put in and walls to make it a full bath. Don't wait will not be on the market long. Showings start after August 25th.
-
2026-01-20price $260,000 338-char remark
Show marketing remark (338 chars)
Located on dead end street in North Price close to ballpark. Affordable Price on this nice home. Alleyway in the back for access to RV parking. 2 sheds 1 with electricity. New water heater-2024. 1/2 bath can have shower put in and walls to make it a full bath. Don't wait will not be on the market long. Showings start after August 25th.
-
2025-08-22$275,000 Active 338-char remark
Show marketing remark (338 chars)
Located on dead end street in North Price close to ballpark. Affordable Price on this nice home. Alleyway in the back for access to RV parking. 2 sheds 1 with electricity. New water heater-2024. 1/2 bath can have shower put in and walls to make it a full bath. Don't wait will not be on the market long. Showings start after August 25th.
-
2020-05-14soldstatus Sold 31-char remark
Show marketing remark (31 chars)
There are no remarks available.
-
2020-05-14soldstatus
Show marketing remark (31 chars)
There are no remarks available.
-
2020-04-13status Under Contract 31-char remark
Show marketing remark (31 chars)
There are no remarks available.
-
2020-03-31$140,000 Active 31-char remark
Show marketing remark (31 chars)
There are no remarks available.
-
2019-06-23historical
-
2019-06-21soldstatus
-
2019-06-20soldstatus Sold
-
2019-04-29status Under Contract
-
2019-03-02$125,000 Active
-
2017-10-31historical
-
2017-08-07status Active
-
2017-08-02status Under Contract
-
2017-07-21price $122,900
-
2017-06-21status Active
-
2017-06-14status Under Contract
-
2017-04-19$124,900 Active
ⓘ Source: listings_history table (triggers on properties + properties_extension) + one-shot
backfill from property_details.listing_events for pre-trigger history.
Tax reassessment forecast UT · Resets to sale price
- Current annual tax
- $1,234 · $103/mo
- Projected year-2 tax
- $1,643 · $137/mo
- Expected delta
- +$409/yr (+$34/mo · 33.1%)
ⓘ Screening estimate from a state-policy table — verify with the county assessor before closing.
Climate risk First Street
- Flood 1/10 Low FEMA zone X (unshaded) · 0% chance over 30 yrs
- Wildfire 5/10 Major
- Heat 3/10 Moderate 4 d/yr ≥92°F today · 10 d/yr by 30 yrs out
- Wind 1/10 Low
- Air quality 2/10 Low 1 unhealthy d/yr today · 2 by 30 yrs out
Nearby sold comps map
Loading sold comps map…
Walkable amenities ~0.75 mi
Loading nearby amenities…
Taxation est. · year 1
- Rental income
- $15,553
- − Mortgage interest
- −$13,948
- − Property taxes
- −$1,234
- − Insurance
- −$1,245
- − Repairs & maintenance
- −$1,244
- − Management
- −$1,244
- − Depreciation
- −$7,244
- Taxable loss
- −$10,607
- Est. tax savings @ 24.0%
- +$2,546
- After-tax cash flow
- $-3,317/yr
For passive investors: Depreciation is non-cash, so a rental often shows a tax loss while cash-flowing — sheltering income. Rental losses are passive: they offset passive income freely, and up to $25,000/yr can offset ordinary (W-2) income if you actively participate and your MAGI is under $100k (phasing out to $0 by $150k); unused losses carry forward. On sale, claimed depreciation is recaptured at up to 25%, and gains may owe capital-gains tax (a 1031 exchange can defer both). Figures are a year-1 estimate at your 24.0% rate — not tax advice; consult a CPA.
Schools (NCES district)
- District
- Carbon District
- NCES district ID
- 4900150
- Math proficiency
- 36% ▼ -7.00%
- Reading proficiency
- 43% ▼ -4.00%
- Median HH income
- $45,189
- Composite
- 33.6/100
- National rank
- #5416
- State rank
- #53 of 80 in UT
Livability — Price
- Score
- 69/100
- State rank
- #102
- US rank
- #8877
Category grades
Schools grade is shown separately in the Schools card above.
Census & demographics
- Census place
- Price, UT
- Population (ZIP)
- 13,002
Population outlook (Carbon County) Hauer SSP2
- Today (2025)
- 18,972 people
- By 2030
- 18,081 · -4.7%
- By 2040
- 16,260 · -14.3%
- By 2050
- 14,895 · -21.5%
- By 2075
- 13,123 · -30.8%
- By 2100
- 13,066 · -31.1%
Race, ethnicity, and origin ACS 2023
- Neighborhood character
- Predominantly White (81%)
- Race & ethnicity
- White 81% Hispanic / Latino 14% Two or more races 7%
- Hispanic origin (detail)
- Mexican 12%
- Common ancestry
- Italian 3% Scottish 2% Slovak 2%
- Foreign-born
- 3% · Canada
- Languages at home
- 93% English-only · Spanish 6% Other Indo-European 1%
Political lean MEDSL · Carbon
- 2024 margin
- Solid R (+44.4) · D 26.7% · R 71.1% · Other 2.1%
- 2008→2024 swing
- -36.4pp toward R · 2008: -8.0pp · 2024: -44.4pp
- All cycles
- 2024: R+44.4 2020: R+45.9 2016: R+44.6 2012: R+36.4 2008: R+8.0
Not yet ingested
- Civics
- —
Market trends
- HPI YoY
- ▼ -119.96%
- Current HPI
- 222.2891
- Rent YoY
- —
- Metro
- —
- State GDP YoY
- ▲ 3.54%
- F500 in state
- 2
Industry mix (Fortune 500 HQ in UT)
| Industry | F500 HQs | Revenue |
|---|---|---|
| Financial Services | 1 | $3B |
|
||
Price history
+99.4% since first listed20 events — show timeline
- 2026-05-14 Price Changed $249,000 WFRMLS
- 2026-03-29 Price Changed $255,000 WFRMLS
- 2026-01-20 Price Changed $260,000 WFRMLS
- 2025-08-22 Listed $275,000 WFRMLS
- 2020-05-14 Sold (Public Records) — Public Records
- 2020-05-14 Sold (MLS) — WFRMLS
- 2020-04-13 Pending — WFRMLS
- 2020-03-31 Listed $140,000 WFRMLS
- 2019-06-23 Listing Removed — WFRMLS
- 2019-06-21 Sold (Public Records) — Public Records
- 2019-06-20 Sold (MLS) — WFRMLS
- 2019-04-29 Pending — WFRMLS
- 2019-03-02 Listed $125,000 WFRMLS
- 2017-10-31 Listing Removed — WFRMLS
- 2017-08-07 Relisted — WFRMLS
- 2017-08-02 Pending — WFRMLS
- 2017-07-21 Price Changed $122,900 WFRMLS
- 2017-06-21 Relisted — WFRMLS
- 2017-06-14 Pending — WFRMLS
- 2017-04-19 Listed $124,900 WFRMLS
Property tax history
+5.2%/yrLatest (2025): $1,234 · +14.1% YoY. Source: county tax records.
Cash-flow waterfall
monthlySold comps — $/sqft
last 12 mo · ≤1 miLoading sold comps…