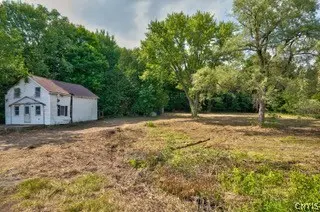
5009 Stokes Lee Center Rd St · Rome, NY
Flood risk No data
- FEMA flood zone
- —
- Chance of flooding over 30 yrs
- —
- Est. flood insurance / yr
- —
Fire risk No data
- Est. fire insurance / yr
- —
Heat risk No data
- Hot days now (above threshold)
- —
- Hot days in 30 yrs
- —
Wind risk No data
- Chance of severe wind over 30 yrs
- —
Air-quality risk No data
- Unhealthy air days now
- —
- Unhealthy air days in 30 yrs
- —
Risk factors via First Street. Map © Google.
Why this score? — see what drove the B- grade
The composite is a weighted blend of 9 inputs, each scored 0–100. Each bar is that input's sub-score; the figure is the points it added to the 100-point composite (weight × sub-score).
- Cash flow +30.0/30.0
- 1% rule +10.0/10.0
- DSCR +10.0/10.0
- ARV discount +7.5/15.0
- Schools +3.5/10.0
- Livability +3.2/5.0
- Rent growth +2.5/5.0
- Condition / age +2.5/5.0
- Appreciation +0.0/10.0
$39,999
🖨 Deal sheet (PDF) 📄 Offer letter ✓ Due diligence
Listing remarks MLS
PROPERTY IS BEING SOLD "AS IS". NEEDS TO BE COMPLETELY RENOVATED. THERE IS A WELL, SEPTIC AND FORCED AIR HEAT SYSTEM - BUT NOTHING WORKS. LISTING BROKER MUST BE AT ALL SHOWINGS. ALSO LISTED AS LAND UNDER MLS#S1547771
Key facts
- Forced air heat
- Completely renovated
- Septic system
Tags
Neighborhood map
What this means for you Summary
Snapshot
- This is a 3-bed/1.5-bath land listed at $40k.
Deal economics
- At list price, monthly cash flow is $1k ($12k/yr) — positive.
- The deal already cash-flows at list — no discount required.
- Meets the 1% rule at list price ($2k rent vs $40k).
- Recommended offer: $35k (12.0% below list) — sets the bar for market timing.
- Cap rate 37.1% vs local median 5.6% in Rome — top-decile yield for the area; either an underpriced asset or a hidden risk that comps aren't pricing in. Stress-test before assuming the spread holds.
Location & tenants
- Location reads 64/100 on livability (#722 in NY) — a middle-class / working-renter tenant base. Strengths: cost of living A+, housing A+; Watch: health & safety C-, schools F, amenities F.
- Rome City School District (town): math 35% / reading 46% proficiency, ranked #516 of 590 in NY (top 88%) — families likely to look elsewhere, expect single-tenant / working-renter base with shorter leases.
- Market conditions: 276 active listings in the ZIP; 5 comparable units currently listed for rent nearby; rentals lingering (median 44d on market — plan ~5-8 weeks vacancy on turnover, expect pricing pressure); 100% of comp listings sitting > 30 days — soft ceiling on asking rent; 204 units permitted in Oneida County in 2024 (68 in 5+ unit buildings).
Forward outlook
- Local home prices are declining (-3.0%/yr); year-one equity from $276 of loan paydown is wiped out by about $1k of value loss. Plan a longer hold.
- Oneida County population projected at -12% by 2050 — secular population decline; favor cash flow + early exit over multi-decade hold.
- At projected returns (-3.0% appreciation + 3.0% rent growth), your $11k cash investment doubles in ~1 year — after that, you're playing with house money.
Negotiation context
- It's been on market 180 days — a 12% lower offer ($35k) is reasonable based on typical stale-listing flexibility.
- 2 sale attempts since 2y ago with the ask held roughly flat each time — persistent listings suggest the price (not the market) is what's stuck; bring a comps-based counter.
Questions for the listing agent
- It's been on market 180 days. Have you received any prior offers? Is the seller open to a 12% concession, seller financing, or rate buy-down credit?
- Why hasn't it sold? Are there any deal-killer items the seller is aware of (foundation, flood, title, zoning, code violations)?
- Is there a deadline driving the sale (1031 exchange, divorce, estate, relocation)? That informs how much negotiation room exists.
- Schools are F-rated, which usually means shorter tenancies and higher turnover. Who's the typical renter profile here, and what's been the actual vacancy rate?
- What's the average days-on-market for RENTAL listings here right now (not sales)? A rising rental-DOM trend means longer vacancies and softer asking-rent achievability than the comps imply.
- What's the recent tenant-quality profile in this submarket — average credit score on applications, eviction rate, late-payment / NSF rate, and stable-employment percentage? A property-management company in the area should have these aggregated.
- How much new for-sale + rental construction is in the pipeline within 1–3 miles? Heavy new supply typically softens prices + rents 12–24 months out; constrained supply supports both.
Investment metrics
- 1% rule
- 4.12% ✓
- Cap rate
- 37.06%
- Cash-on-cash
- 109.88%
- DSCR
- 5.89
- GRM
- 2.0
CMA / ARV
- ARV (median comp)
- $182,920
- List price
- $39,999
- Delta
- -78.13%
- Verdict
- UNDERPRICED
- Comps
- 20 within 1.0 mi
Projected returns pro-forma
-3.0% appreciation · 3.0% rent growth · sell at horizon
- IRR
- —
- Equity multiple
- 6.26×
- Total profit
- $58,862
- Equity at exit
- $5,964
- IRR
- —
- Equity multiple
- 13.10×
- Total profit
- $135,465
- Equity at exit
- $3,458
Cash invested: $11,200 (down + closing). Projections, not guarantees.
Landlord ↔ Tenant lean methodology
- Overall (STATE)
- 15 Strongly Tenant-Friendly
- State New York
- 15 Strongly Tenant-Friendly · D+10
- County
- — inherits STATE
- City
- — inherits STATE
ZIP-level market 13440
- Home prices YoY
- -8.0%
- Active inventory
- 276
- Price-to-rent
- 2.0×
Monthly cashflow live
- Estimated rent
- $1,648 high interval (Pro) →
- Mortgage (P&I)
- −$210
- Tax est. 1.5%
- −$50 /mo · $600/yr
- Insurance
- −$17
- HOA
- −$0
- Vacancy / Maint / Mgmt
- −$346
- Net cashflow
- $1,026
Break-even live
Sensitivity live
| Price | -10% $1,053 | -5% $1,039 | +0% $1,026 | +5% $1,012 | +10% $998 |
|---|---|---|---|---|---|
| Rent | -10% $895 | -5% $960 | +0% $1,026 | +5% $1,091 | +10% $1,156 |
| Rate | -1.0pp $1,046 | -0.5pp $1,036 | base $1,026 | +0.5pp $1,015 | +1.0pp $1,005 |
UW: 25.0% down · 7.5% · 30yr · 1.5% tax · 5.0% vac · 8.0% maint · 8.0% mgmt
Financing live
Cash to close
- Down payment
- $10,000
- Closing costs
- $1,200
- Reserves months
- —
- Total cash needed
- —
Loan-product check · same deal, 3 products live
Conventional
25% down · 7.5% · 30yr
- Down + closing
- —
- Monthly P&I
- —
- Monthly cashflow
- —
- DSCR
- —
- Eligible?
- —
Personal DTI + credit; lowest rate.
DSCR
20% down · 8.5% · 30yr
- Down + closing
- —
- Monthly P&I
- —
- Monthly cashflow
- —
- DSCR
- —
- Eligible?
- —
No personal income docs; deal must DSCR.
Hard money
10% down · 12.0% · 12mo
- Down + closing
- —
- Monthly P&I
- —
- Monthly cashflow
- —
- DSCR
- —
- Eligible?
- —
Short-term bridge; refi at stabilization.
Rent comps 5 comps
| Address | Beds | Baths | Sqft | Rent | $/sqft | DOM | Units | Dist |
|---|---|---|---|---|---|---|---|---|
| 7805 Merrick Rd Unit 201 Rome, NY | 2.0 | 2.0 | 1200 | $2,000 | $1.67 | 44d | 1 | 0.84mi |
| 1611 Craig St Rome, NY | 3.0 | 1.0 | 1250 | $2,000 | $1.60 | 44d | 1 | 0.87mi |
| 1027 Elwood St Rome, NY | 3.0 | 2.0 | 1200 | $1,500 | $1.25 | 44d | 1 | 0.89mi |
| 183 W Dominick St Rome, NY | 1.0–2.0 | 1.0 | 845 | $904 | $1.07 | 44d | 1 | 1.19mi |
| 149 River St Unit 2 Rome, NY | 3.0 | 1.0 | 1160 | $1,500 | $1.29 | 45d | 1 | 1.32mi |
Listing history 18 events
-
2026-06-21days on market $39,999 Active 180 DOM
-
2026-06-18days on market $39,999 Active 178 DOM
-
2026-06-17days on market $39,999 Active 177 DOM
-
2026-06-16days on market $39,999 Active 176 DOM
-
2026-06-15days on market $39,999 Active 175 DOM
-
2026-06-13days on market $39,999 Active 173 DOM
-
2026-06-12days on market $39,999 Active 172 DOM
-
2026-06-09days on market $39,999 Active 169 DOM
-
2026-06-08days on market $39,999 Active 168 DOM
-
2026-06-07days on market $39,999 Active 167 DOM
-
2026-06-07days on market $39,999 Active 166 DOM
-
2026-06-04days on market $39,999 Active 163 DOM
-
2026-06-02days on market $39,999 Active 162 DOM
-
2026-06-01days on market $39,999 Active 161 DOM
-
2026-05-31days on market $39,999 Active 160 DOM
-
2026-04-16status Active 226-char remark
Show marketing remark (226 chars)
PROPERTY IS BEING SOLD "AS IS". NEEDS TO BE COMPLETELY RENOVATED. THERE IS A WELL, SEPTIC AND FORCED AIR HEAT SYSTEM - BUT NOTHING WORKS. LISTING BROKER MUST BE AT ALL SHOWINGS. ALSO LISTED AS LAND UNDER MLS#S1547771
-
2024-10-17historical 226-char remark
Show marketing remark (226 chars)
PROPERTY IS BEING SOLD "AS IS". NEEDS TO BE COMPLETELY RENOVATED. THERE IS A WELL, SEPTIC AND FORCED AIR HEAT SYSTEM - BUT NOTHING WORKS. LISTING BROKER MUST BE AT ALL SHOWINGS. ALSO LISTED AS LAND UNDER MLS#S1547771
-
2024-06-24$39,999 Active 226-char remark
Show marketing remark (226 chars)
PROPERTY IS BEING SOLD "AS IS". NEEDS TO BE COMPLETELY RENOVATED. THERE IS A WELL, SEPTIC AND FORCED AIR HEAT SYSTEM - BUT NOTHING WORKS. LISTING BROKER MUST BE AT ALL SHOWINGS. ALSO LISTED AS LAND UNDER MLS#S1547771
ⓘ Source: listings_history table (triggers on properties + properties_extension) + one-shot
backfill from property_details.listing_events for pre-trigger history.
Nearby sold comps map
Loading sold comps map…
Walkable amenities ~0.75 mi
Loading nearby amenities…
Taxation est. · year 1
- Rental income
- $19,777
- − Mortgage interest
- −$2,241
- − Property taxes
- −$600
- − Insurance
- −$200
- − Repairs & maintenance
- −$1,582
- − Management
- −$1,582
- − Depreciation
- −$1,164
- Taxable income
- $12,408
- Est. tax owed @ 24.0%
- −$2,978
- After-tax cash flow
- $9,329/yr
For passive investors: Depreciation is non-cash, so a rental often shows a tax loss while cash-flowing — sheltering income. Rental losses are passive: they offset passive income freely, and up to $25,000/yr can offset ordinary (W-2) income if you actively participate and your MAGI is under $100k (phasing out to $0 by $150k); unused losses carry forward. On sale, claimed depreciation is recaptured at up to 25%, and gains may owe capital-gains tax (a 1031 exchange can defer both). Figures are a year-1 estimate at your 24.0% rate — not tax advice; consult a CPA.
Schools (NCES district)
- District
- Rome City School District
- NCES district ID
- 3624900
- Math proficiency
- 35% ▼ -4.00%
- Reading proficiency
- 46% ▲ 10.00%
- Median HH income
- $46,406
- Composite
- 34.52/100
- National rank
- #5178
- State rank
- #516 of 590 in NY
Livability — Rome
- Score
- 64/100
- State rank
- #722
- US rank
- #13676
Category grades
Schools grade is shown separately in the Schools card above.
Census & demographics
- Census place
- Rome, NY
- City population
- 41,418
- Population (ZIP)
- 41,273
Population outlook (Oneida County) Hauer SSP2
- Today (2025)
- 225,223 people
- By 2030
- 220,384 · -2.1%
- By 2040
- 209,071 · -7.2%
- By 2050
- 197,920 · -12.1%
- By 2075
- 175,541 · -22.1%
- By 2100
- 148,491 · -34.1%
Race, ethnicity, and origin ACS 2023
- Neighborhood character
- Predominantly White (82%)
- Race & ethnicity
- White 82% Hispanic / Latino 7% Two or more races 6% Black 4% Asian 1%
- Hispanic origin (detail)
- Mexican 1% Puerto Rican 4%
- Common ancestry
- Romanian 9% Lithuanian 4% Slovak 1%
- Foreign-born
- 3% · Canada, China
- Languages at home
- 94% English-only · Spanish 3% Other Indo-European 1%
Political lean MEDSL · Oneida
- 2024 margin
- Strong R (+21.3) · D 39.4% · R 60.6%
- 2008→2024 swing
- -15.2pp toward R · 2008: -6.1pp · 2024: -21.3pp
- All cycles
- 2024: R+21.3 2020: R+15.5 2016: R+21.1 2012: R+5.3 2008: R+6.1
Not yet ingested
- Civics
- —
Market trends
- HPI YoY
- ▼ -29.58%
- Current HPI
- 339.3589
- Rent YoY
- —
- Metro
- —
- State GDP YoY
- ▲ 2.60%
- F500 in state
- 92
Industry mix (Fortune 500 HQ in NY)
| Industry | F500 HQs | Revenue |
|---|---|---|
| Financial Services | 10 | $950B |
|
||
| Consumer Goods | 9 | $162B |
|
||
| Insurance | 4 | $225B |
|
||
| Telecommunications | 2 | $144B |
|
||
| Pharmaceuticals | 2 | $112B |
|
||
| Media / Entertainment | 2 | $69B |
|
||
Price history
3 events — show timeline
- 2026-04-16 Relisted — CNYIS
- 2024-10-17 Listing Removed — CNYIS
- 2024-06-24 Listed $39,999 CNYIS
Cash-flow waterfall
monthlySold comps — $/sqft
last 12 mo · ≤1 miLoading sold comps…