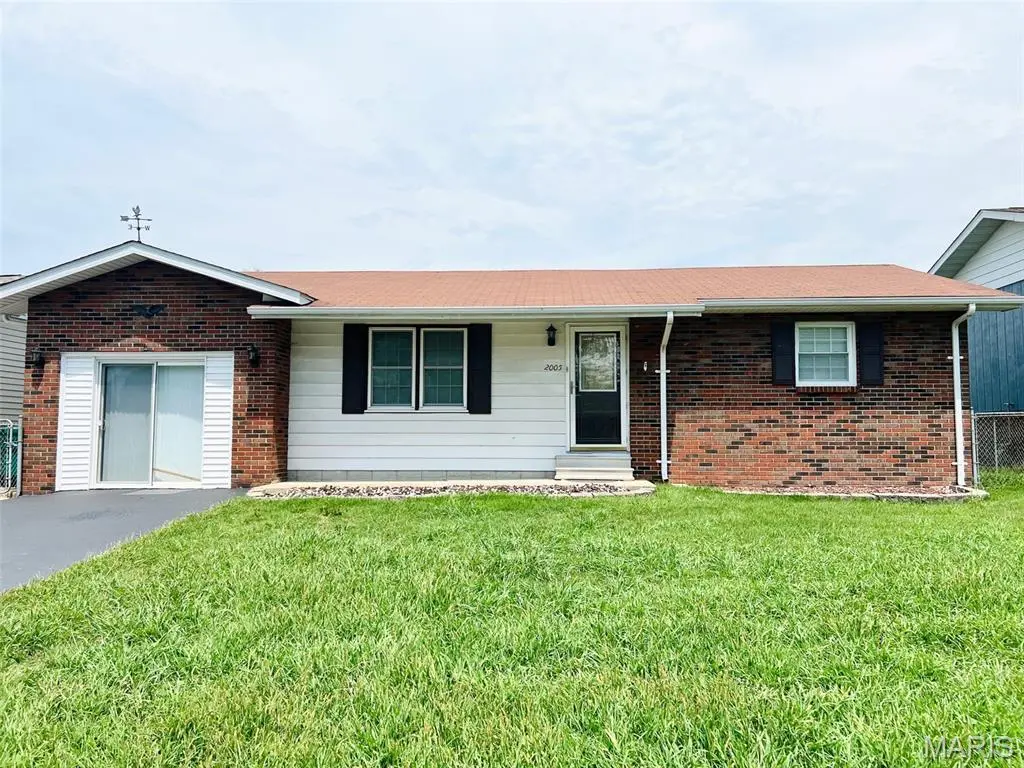
2005 Louise Ave · Cahokia Heights, IL
Flood risk 4/10 · Minor
- FEMA flood zone
- X (shaded)
- Chance of flooding over 30 yrs
- 0.22%
- Est. flood insurance / yr
- $507 – $1,088
Fire risk 1/10 · Minimal
- Est. fire insurance / yr
- $804 – $1,492
Heat risk 5/10 · Moderate
- Hot days now (above 107°F)
- 7 days/yr
- Hot days in 30 yrs
- 21 days/yr
Wind risk 2/10 · Minimal
- Chance of severe wind over 30 yrs
- 1.0%
Air-quality risk 3/10 · Minor
- Unhealthy air days now
- 3 days/yr
- Unhealthy air days in 30 yrs
- 4 days/yr
Risk factors via First Street. Map © Google.
Why this score? — see what drove the C- grade
The composite is a weighted blend of 9 inputs, each scored 0–100. Each bar is that input's sub-score; the figure is the points it added to the 100-point composite (weight × sub-score).
- Cash flow +26.9/30.0
- DSCR +9.3/10.0
- 1% rule +7.3/10.0
- Rent growth +2.5/5.0
- Livability +2.5/5.0
- Condition / age +2.5/5.0
- Schools +0.6/10.0
- ARV discount +0.0/15.0
- Appreciation +0.0/10.0
$114,000
🖨 Deal sheet 📄 Offer letter ✓ Due diligence
Listing remarks MLS
Welcome to this beautifully updated 3-bedroom, 1-bathroom plus a large bonus room single-family home located on a quiet street in Cahokia with approximately 1130 sq ft of livable space. This move-in ready home features fresh renovations throughout, including brand-new flooring in bonus room and laundry room, modern light fixtures, and a fresh coat of paint throughout. The large bonus room offers flexible space perfect for a family room, rec room, or home office. The home also offers generous outdoor space, with both a large front yard and a spacious backyard ideal for entertaining. Additional updates include a new hot water tank (March 2025) and a furnace that’s just 6 years old. This move-in ready home is a great opportunity for new homeowners or investors looking to generate additional income —schedule your showing today! Buyer and buyer's agent to verify all MLS data. Home is being sold "As Is". Buyer responsible for city occupancy. Seller to provide a 1-year home warranty if requested by the buyer.
Key facts
- 8,712 sq ft lot
- Built 1978
- Listed 127 days
Neighborhood map
What this means for you Summary
Snapshot
- This is a 3-bed/2.0-bath single-family listed at $114k.
Deal economics
- At list price, monthly cash flow is $316 ($4k/yr) — positive.
- The deal already cash-flows at list — no discount required.
- Meets the 1% rule at list price ($1k rent vs $114k).
- Recommended offer: $100k (12.0% below list) — sets the bar for market timing.
- Cap rate 9.6% vs local median 13.6% in Cahokia Heights — below-typical yield; the buyer is paying a premium for something (appreciation thesis, condition, location) that the cap rate doesn't capture.
Location & tenants
- Location reads: area grade C — affects rentability + tenant quality, not the cash-flow math above.
- Cahokia CUSD 187 (suburban): math 3% / reading 5% proficiency, ranked #864 of 919 in IL (top 94%) — low school quality limits family demand, transient renter base, plan for 1-2y turnover; 85% free/reduced lunch — lower-income household profile, screen leases tightly.
- Market conditions: 153 active listings in the ZIP; 34 comparable units currently listed for rent nearby; rentals at typical pace (median 22d on market — plan ~3-4 weeks tenant-placement turnaround); lower-income renter base — watch delinquency; 783 units permitted in St. Clair County in 2024 (378 in 5+ unit buildings).
- At $1,397/mo this rent would consume 50% of the median local household income ($34k/yr) (locally 729% of renters already pay >50% of income on rent) — very limited rent-growth headroom before tenants either downsize or default.
Forward outlook
- Local home prices are declining (-3.0%/yr); year-one equity from $788 of loan paydown is wiped out by about $3k of value loss. Plan a longer hold.
- St. Clair County population projected at -23% by 2050 — secular population decline; favor cash flow + early exit over multi-decade hold.
- At projected returns (-3.0% appreciation + 3.0% rent growth), your $32k cash investment doubles in ~10 years — after that, you're playing with house money.
Negotiation context
- It's been on market 128 days — a 12% lower offer ($100k) is reasonable based on typical stale-listing flexibility.
- 2 sale attempts with the ask held roughly flat each time — persistent listings suggest the price (not the market) is what's stuck; bring a comps-based counter.
- Current owner paid $55k; list at $114k implies a 107% gain — meaningful room to come down on a strong offer.
Risks & watch-outs
- Climate carrying-cost: extreme-heat days projected 7→21/yr by 2055 (HVAC capex compounding) — expect insurance premiums to compound above CPI over the hold.
Questions for the listing agent
- It's been on market 128 days. Have you received any prior offers? Is the seller open to a 12% concession, seller financing, or rate buy-down credit?
- Built in 1978 — when were the roof, HVAC, electrical panel, plumbing, and water heater last replaced?
- Why hasn't it sold? Are there any deal-killer items the seller is aware of (foundation, flood, title, zoning, code violations)?
- Is there a deadline driving the sale (1031 exchange, divorce, estate, relocation)? That informs how much negotiation room exists.
- What's the average days-on-market for RENTAL listings here right now (not sales)? A rising rental-DOM trend means longer vacancies and softer asking-rent achievability than the comps imply.
- What's the recent tenant-quality profile in this submarket — average credit score on applications, eviction rate, late-payment / NSF rate, and stable-employment percentage? A property-management company in the area should have these aggregated.
- How much new for-sale + rental construction is in the pipeline within 1–3 miles? Heavy new supply typically softens prices + rents 12–24 months out; constrained supply supports both.
Investment metrics
- 1% rule
- 1.23% ✓
- Cap rate
- 9.62%
- Cash-on-cash
- 11.87%
- DSCR
- 1.53
- GRM
- 6.8
CMA / ARV
- ARV (median comp)
- $87,318
- List price
- $114,000
- Delta
- 30.56%
- Verdict
- OVERPRICED
- Comps
- 20 within 1.0 mi
Show comp detail 12 sales within ~0.75 mi
| Address | Dist | Beds/Ba | Sqft | Sold | Price | $/sf | Match |
|---|---|---|---|---|---|---|---|
| 1700 Theodore Ln | 0.45mi | 3/1.0 | 1,216 (-1%) | 6mo | $50,000 | $41 | 68 |
| 1624 Doris Ave | 0.64mi | 3/2.0 | 1,272 (+4%) | 2mo | $105,000 | $83 | 62 |
| 2 Leonard Dr | 0.37mi | 4/1.5 (+1) | 1,286 (+5%) | 7mo | $110,000 | $86 | 62 |
| 1735 Parklane Dr | 0.51mi | 4/1.0 (+1) | 1,248 (+2%) | 6mo | $110,000 | $88 | 60 |
| 1710 Parklane Dr | 0.65mi | 4/1.0 (+1) | 1,225 (-0%) | 5mo | $110,000 | $90 | 56 |
| 1620 Doris Ave | 0.65mi | 3/1.0 | 1,282 (+5%) | 2mo | $105,000 | $82 | 56 |
| 1427 Williams St | 0.53mi | 4/1.0 (+1) | 1,300 (+6%) | 2mo | $59,500 | $46 | 54 |
| 1426 Williams St | 0.54mi | 4/1.0 (+1) | 1,300 (+6%) | 6mo | $110,000 | $85 | 50 |
| 109 Dorcas Dr | 0.61mi | 3/1.0 | 1,316 (+7%) | 6mo | $45,000 | $34 | 50 |
| 1711 Parklane Dr | 0.63mi | 4/1.0 (+1) | 1,315 (+7%) | 1mo | $110,000 | $84 | 49 |
| 1614 Parklane Dr | 0.70mi | 4/1.0 (+1) | 1,152 (-6%) | 5mo | $110,000 | $95 | 44 |
| 28 Fox Meadow Ln | 0.63mi | 4/2.5 (+1) | 1,056 (-14%) | 2mo | $180,000 | $170 | 38 |
Match score weights: distance 35% · size 25% · config 20% · recency 20%. Top-matched comps best support the ARV.
Projected returns pro-forma
-3.0% appreciation · 3.0% rent growth · sell at horizon
- IRR
- 1.4%
- Equity multiple
- 1.05×
- Total profit
- $1,652
- Equity at exit
- $16,998
- IRR
- 11.0%
- Equity multiple
- 1.86×
- Total profit
- $27,411
- Equity at exit
- $9,857
Cash invested: $31,920 (down + closing). Projections, not guarantees.
Landlord ↔ Tenant lean methodology
- Overall (STATE)
- 43 Moderately Tenant-Leaning
- State Illinois
- 43 Moderately Tenant-Leaning · D+7
- County
- — inherits STATE
- City
- — inherits STATE
ZIP-level market 62206
- Home prices YoY
- -20.2%
- Active inventory
- 153
- Price-to-rent
- 6.8×
Monthly cashflow live
- Estimated rent
- $1,397 high interval (Pro) →
- Mortgage (P&I)
- −$598
- Tax est. 1.5%
- −$142 /mo · $1,710/yr
- Insurance
- −$48
- HOA
- −$0
- Vacancy / Maint / Mgmt
- −$293
- Net cashflow
- $316
Break-even live
UW: 25.0% down · 7.5% · 30yr · 1.5% tax · 5.0% vac · 8.0% maint · 8.0% mgmt
Financing live
Cash to close
- Down payment
- $28,500
- Closing costs
- $3,420
- Reserves months
- —
- Total cash needed
- —
Loan-product check · same deal, 3 products live
Conventional
25% down · 7.5% · 30yr
- Down + closing
- —
- Monthly P&I
- —
- Monthly cashflow
- —
- DSCR
- —
- Eligible?
- —
Personal DTI + credit; lowest rate.
DSCR
20% down · 8.5% · 30yr
- Down + closing
- —
- Monthly P&I
- —
- Monthly cashflow
- —
- DSCR
- —
- Eligible?
- —
No personal income docs; deal must DSCR.
Hard money
10% down · 12.0% · 12mo
- Down + closing
- —
- Monthly P&I
- —
- Monthly cashflow
- —
- DSCR
- —
- Eligible?
- —
Short-term bridge; refi at stabilization.
Rent comps 34 comps
| Address | Beds | Baths | Sqft | Rent | $/sqft | DOM | Units | Dist |
|---|---|---|---|---|---|---|---|---|
| 2008 Delores St East Saint Louis, IL | 3.0 | 1.0 | 925 | $1,250 | $1.35 | 4d | 1 | 0.11mi |
| 2116 Doris Ave Cahokia Heights, IL | 3.0 | 1.0 | 880 | $1,400 | $1.59 | 21d | 1 | 0.26mi |
| 1808 Mullens Ave Cahokia Heights, IL | 3.0 | 1.0 | 992 | $1,500 | $1.51 | 2d | 1 | 0.44mi |
| 102 Melvin Dr Unit 34 Sauget, IL | 4.0 | 1.0 | 1352 | $1,700 | $1.26 | 7d | 1 | 0.55mi |
| 1421 Richard Dr East Saint Louis, IL | 3.0 | 1.0 | 936 | $1,100 | $1.18 | 1d | 1 | 0.56mi |
| 1420 Williams St East Saint Louis, IL | 4.0 | 1.0 | 1300 | $1,500 | $1.15 | 43d | 1 | 0.57mi |
| 1417 Richard Dr East Saint Louis, IL | 3.0 | 1.0 | 936 | $1,400 | $1.50 | 21d | 1 | 0.58mi |
| 1716 # E Unit Loretta Ave unit East St Louis, IL | 2.0 | 1.0 | 720 | $1,000 | $1.39 | 43d | 1 | 0.62mi |
| 1713 Loretta Ave East Saint Louis, IL | 3.0 | 1.0 | 944 | $1,095 | $1.16 | 43d | 1 | 0.64mi |
| 1405 Williams St Cahokia Heights, IL | 3.0 | 1.0 | 900 | $1,500 | $1.67 | 43d | 1 | 0.65mi |
| 1710 Parklane Dr East Saint Louis, IL | 4.0 | 1.0 | 1225 | $1,395 | $1.14 | 43d | 1 | 0.66mi |
| 2 E Adams Dr East Saint Louis, IL | 3.0 | 1.0 | 925 | $885 | $0.96 | 43d | 1 | 0.69mi |
| 1614 Parklane Dr East Saint Louis, IL | 4.0 | 1.0 | 1152 | $1,400 | $1.22 | 23d | 1 | 0.71mi |
| 1706 Andrews Dr East Saint Louis, IL | 4.0 | 1.0 | 925 | $1,320 | $1.43 | 23d | 1 | 0.72mi |
| 13 Drexel Dr East Saint Louis, IL | 3.0 | 1.0 | 925 | $995 | $1.08 | 12d | 1 | 0.77mi |
| 1308 Saint Stephens Dr Cahokia Heights, IL | 2.0 | 1.0 | 864 | $875 | $1.01 | 14d | 1 | 0.79mi |
| 1308 Saint Stephens Dr Cahokia Heights, IL | 2.0 | 1.0 | 864 | $875 | $1.01 | 16d | 1 | 0.79mi |
| 1312 Saint Raphael St East Saint Louis, IL | 3.0 | 1.0 | 1280 | $1,500 | $1.17 | 43d | 1 | 0.80mi |
| 32 Drexel Dr East Saint Louis, IL | 4.0 | 1.0 | 1362 | $1,675 | $1.23 | 16d | 1 | 0.83mi |
| 70 W Adams Dr East Saint Louis, IL | 3.0 | 1.0 | 925 | $1,200 | $1.30 | 43d | 1 | 0.87mi |
| 1220 Williams St East Saint Louis, IL | 3.0 | 1.0 | 876 | $1,500 | $1.71 | 14d | 1 | 0.90mi |
| 2231 Loren St Cahokia Heights, IL | 2.0 | 1.0 | 1000 | $1,195 | $1.20 | 44d | 1 | 0.92mi |
| 302 Saint Leonard Dr East Saint Louis, IL | 3.0 | 1.0 | 1155 | $1,300 | $1.13 | 43d | 1 | 0.97mi |
| 13 Marilyn Ln East Saint Louis, IL | 3.0 | 1.0 | 995 | $1,150 | $1.16 | 43d | 1 | 1.05mi |
| 818 La Salle Dr East Saint Louis, IL | 3.0 | 1.0 | 1106 | $1,300 | $1.18 | 23d | 1 | 1.13mi |
| 1109 Saint Helena Dr Cahokia Heights, IL | 3.0 | 1.0 | 825 | $1,400 | $1.70 | 2d | 1 | 1.18mi |
| 8 Louise Ln East Saint Louis, IL | 3.0 | 1.0 | 1150 | $1,275 | $1.11 | 17d | 1 | 1.19mi |
| 850 Saint Bartholomew Dr Cahokia, IL | 3.0 | 1.0 | 1050 | $1,285 | $1.22 | 16d | 1 | 1.23mi |
| 1162 Smith St East Saint Louis, IL | 3.0 | 1.0 | 988 | $1,295 | $1.31 | 21d | 1 | 1.24mi |
| 6 Delores Dr East Saint Louis, IL | 3.0 | 1.0 | 864 | $1,300 | $1.50 | 23d | 1 | 1.25mi |
| 6 Delores Dr East Saint Louis, IL | 3.0 | 1.0 | 864 | $1,300 | $1.50 | 12d | 1 | 1.25mi |
| 819 Mildred Ave East Saint Louis, IL | 3.0 | 1.0 | 936 | $1,250 | $1.34 | 21d | 1 | 1.27mi |
| 21 Agnes Dr Cahokia, IL | 3.0 | 1.0 | 864 | $1,050 | $1.22 | 21d | 1 | 1.29mi |
| 1150 Price St Cahokia, IL | 3.0 | 1.0 | 864 | $1,400 | $1.62 | 2d | 1 | 1.36mi |
Listing history 17 events
-
2026-06-18days on market $114,000 Active 128 DOM
-
2026-06-17days on market $114,000 Active 127 DOM
-
2026-06-16days on market $114,000 Active 126 DOM
-
2026-06-15days on market $114,000 Active 125 DOM
-
2026-06-13days on market $114,000 Active 123 DOM
-
2026-06-13days on market $114,000 Active 122 DOM
-
2026-06-09days on market $114,000 Active 119 DOM
-
2026-06-08days on market $114,000 Active 118 DOM
-
2026-06-07days on market $114,000 Active 117 DOM
-
2026-06-05days on market $114,000 Active 114 DOM
-
2026-06-03days on market $114,000 Active 113 DOM
-
2026-06-02days on market $114,000 Active 112 DOM
-
2026-06-01days on market $114,000 Active 111 DOM
-
2026-05-31days on market $114,000 Active 110 DOM
-
2026-02-11$114,000 Active 1039-char remark
Show marketing remark (1039 chars)
Welcome to this beautifully updated 3-bedroom, 1-bathroom plus a large bonus room single-family home located on a quiet street in Cahokia with approximately 1130 sq ft of livable space. This move-in ready home features fresh renovations throughout, including brand-new flooring in bonus room and laundry room, modern light fixtures, and a fresh coat of paint throughout. The large bonus room offers flexible space perfect for a family room, rec room, or home office. The home also offers generous outdoor space, with both a large front yard and a spacious backyard ideal for entertaining. Additional updates include a new hot water tank (March 2025) and a furnace that’s just 6 years old. This move-in ready home is a great opportunity for new homeowners or investors looking to generate additional income —schedule your showing today! Buyer and buyer's agent to verify all MLS data. Home is being sold "As Is". Buyer responsible for city occupancy. Seller to provide a 1-year home warranty if requested by the buyer.
-
2025-08-03$119,000 Active
-
2003-03-26soldstatus $55,000
ⓘ Source: listings_history table (triggers on properties + properties_extension) + one-shot
backfill from property_details.listing_events for pre-trigger history.
Climate risk First Street
- Flood 4/10 Moderate FEMA zone X (shaded) · 22% chance over 30 yrs
- Wildfire 1/10 Low
- Heat 5/10 Major 7 d/yr ≥107°F today · 21 d/yr by 30 yrs out
- Wind 2/10 Low 100% chance of damaging wind over 30 yrs
- Air quality 3/10 Moderate 3 unhealthy d/yr today · 4 by 30 yrs out
Nearby sold comps map
Loading sold comps map…
Walkable amenities ~0.75 mi
Loading nearby amenities…
Taxation est. · year 1
- Rental income
- $16,762
- − Mortgage interest
- −$6,386
- − Property taxes
- −$1,710
- − Insurance
- −$570
- − Repairs & maintenance
- −$1,341
- − Management
- −$1,341
- − Depreciation
- −$3,316
- Taxable income
- $2,098
- Est. tax owed @ 24.0%
- −$503
- After-tax cash flow
- $3,284/yr
For passive investors: Depreciation is non-cash, so a rental often shows a tax loss while cash-flowing — sheltering income. Rental losses are passive: they offset passive income freely, and up to $25,000/yr can offset ordinary (W-2) income if you actively participate and your MAGI is under $100k (phasing out to $0 by $150k); unused losses carry forward. On sale, claimed depreciation is recaptured at up to 25%, and gains may owe capital-gains tax (a 1031 exchange can defer both). Figures are a year-1 estimate at your 24.0% rate — not tax advice; consult a CPA.
Schools (NCES district)
- District
- Cahokia CUSD 187
- NCES district ID
- 1708040
- Math proficiency
- 3% ▼ -2.00%
- Reading proficiency
- 5% ▬ 0.00%
- Median HH income
- $28,028
- Composite
- 6.44/100
- National rank
- #14827
- State rank
- #864 of 919 in IL
Livability — Cahokia Heights
No livability data for this city. (Only ~50 U.S. cities are tracked.)
Census & demographics
- Census place
- Cahokia Heights, IL
- County
- Saint Clair County · 169,691 people
- City population
- 19,956
- Metro
- St. Louis, MO-IL
- Population (ZIP)
- 12,959
- Household income
- $33,838
- Rent vs Own
- Severe rent burden
- 729.0
Population outlook (St. Clair County) Hauer SSP2
- Today (2025)
- 250,366 people
- By 2030
- 240,511 · -3.9%
- By 2040
- 217,391 · -13.2%
- By 2050
- 192,699 · -23.0%
- By 2075
- 140,637 · -43.8%
- By 2100
- 100,499 · -59.9%
Race, ethnicity, and origin ACS 2023
- Neighborhood character
- Diverse neighborhood (Simpson 0.56)
- Race & ethnicity
- Black 59% White 29% Two or more races 6% Hispanic / Latino 3% Asian 2%
- Common ancestry
- Romanian 2% Lithuanian 1% Iranian 1%
- Foreign-born
- 2% · China
- Languages at home
- 95% English-only · Spanish 3% Other Indo-European 1% Chinese 1%
Political lean MEDSL · St. Clair
- 2024 margin
- Lean D (+7.9) · D 53.0% · R 45.1% · Other 1.8%
- 2008→2024 swing
- -14.6pp toward R · 2008: 22.4pp · 2024: 7.9pp
- All cycles
- 2024: D+7.9 2020: D+8.7 2016: D+5.6 2012: D+14.5 2008: D+22.4
Not yet ingested
- Civics
- —
Market trends
- HPI YoY
- ▼ -33.26%
- Current HPI
- 131.5144
- Rent YoY
- —
- Metro
- St. Louis, MO-IL
- State GDP YoY
- ▲ 1.59%
- F500 in state
- 60
Industry mix (Fortune 500 HQ in IL)
| Industry | F500 HQs | Revenue |
|---|---|---|
| Insurance | 4 | $201B |
|
||
| Consumer Goods | 4 | $87B |
|
||
| Industrial Machinery | 3 | $64B |
|
||
| Healthcare | 2 | $55B |
|
||
| Retail / Pharmacy | 1 | $148B |
|
||
| Agriculture / Food | 1 | $86B |
|
||
Price history
+107.3% since first listed3 events — show timeline
- 2026-02-11 Listed $114,000 MARIS as Distributed by MLS Grid
- 2025-08-03 Listed $119,000 MARIS as Distributed by MLS Grid
- 2003-03-26 Sold (Public Records) $55,000 Public Records
Property tax history
-19.0%/yrLatest (2024): $46 · -97.9% YoY. Source: county tax records.
Cash-flow waterfall
monthlySold comps — $/sqft
last 12 mo · ≤1 miLoading sold comps…