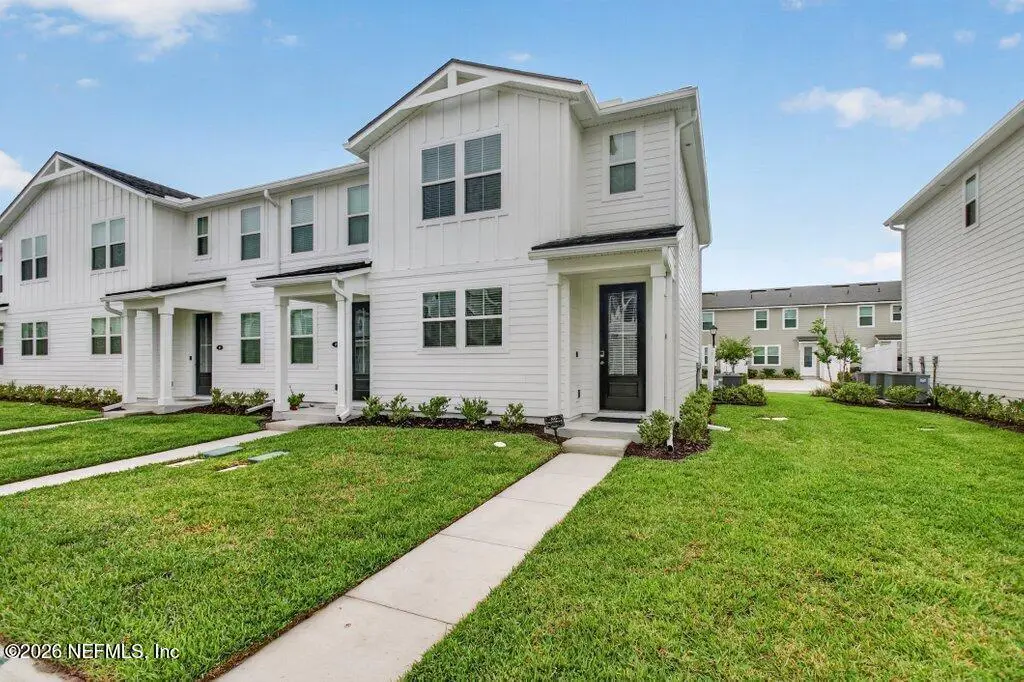
91 Cordelle St · Fruit Cove, FL
Flood risk No data
- FEMA flood zone
- —
- Chance of flooding over 30 yrs
- —
- Est. flood insurance / yr
- —
Fire risk No data
- Est. fire insurance / yr
- —
Heat risk No data
- Hot days now (above threshold)
- —
- Hot days in 30 yrs
- —
Wind risk No data
- Chance of severe wind over 30 yrs
- —
Air-quality risk No data
- Unhealthy air days now
- —
- Unhealthy air days in 30 yrs
- —
Risk factors via First Street. Map © Google.
Why this score? — see what drove the D grade
The composite is a weighted blend of 9 inputs, each scored 0–100. Each bar is that input's sub-score; the figure is the points it added to the 100-point composite (weight × sub-score).
- Cash flow +11.9/30.0
- Schools +6.4/10.0
- ARV discount +5.4/15.0
- 1% rule +4.4/10.0
- Condition / age +4.0/5.0
- DSCR +3.5/10.0
- Livability +3.5/5.0
- Rent growth +2.5/5.0
- Appreciation +0.0/10.0
$270,000
🖨 Deal sheet (PDF) 📄 Offer letter ✓ Due diligence
Listing remarks
Located in the prestigious RiverTown Meadows community within RiverTown, this beautifully designed end-unit townhome offers the perfect blend of modern style, comfort, and convenience. The sleek open-concept floorplan welcomes you directly into the heart of the home, where a spacious kitchen with a large island and breakfast bar overlooks the dining and living areas - creating a seamless flow ideal for entertaining guests or enjoying everyday family life. Thoughtfully designed for functionality, the first floor also features a convenient laundry room and half bath. Upstairs, the private owner's suite includes an ensuite bath and is thoughtfully positioned across from two additional bedrooms
Key facts
- End-unit townhome
- Spacious kitchen
- Large island
Tags
Property features AI
Finance
- HOA & community: Has association; Quarterly association fee of $514 covering maintenance of grounds; Community amenities include basketball court, boat dock, children’s pool, clubhouse, dog park, fitness center, jogging path, maintained grounds, park, pickleball, playground, and tennis courts; CDD fee applicable
Exterior
- Parking: Assigned parking
- Security: Fire alarm; Smoke detector(s)
- Utilities: Public sewer; Electricity connected; Sewer connected; Water connected
- Home design: Townhouse; Attached property; Faces southwest
- Construction: Shingle roof
- Exterior features: Community pool (not private); Sprinklers in front and rear; Asphalt road surface
Interior
- Kitchen: Dishwasher; Disposal; Electric cooktop; Electric oven; Freezer; Ice maker; Microwave; Refrigerator
- Bedrooms: 3 bedrooms
- Flooring: Carpet; Tile
- Bathrooms: 2 full bathrooms; 1 half bathroom
- Heating & cooling: Central heating (electric); Central air (electric)
- Interior features: Breakfast bar; Ceiling fan(s); Eat-in kitchen; Kitchen island; Open floorplan; Pantry; Walk-in closet(s)
Neighborhood map
What this means for you Summary
Snapshot
- This is a 3-bed/2.5-bath townhouse listed at $270k. Condition is rated good.
Deal economics
- At list price, monthly cash flow is $-71 ($-847/yr) — negative.
- To cash-flow at today's rent, offer at most $258k (4.6% below list).
- To meet the 1% rule (rent ≥ 1% of price), the offer needs to be $255k (5.6% below list).
- Recommended offer: $255k (5.6% below list) — sets the bar for 1% rule.
- Cap rate 6.0% vs local median 2.9% in Fruit Cove — top-decile yield for the area; either an underpriced asset or a hidden risk that comps aren't pricing in. Stress-test before assuming the spread holds.
Location & tenants
- Location reads 69/100 on livability (#469 in FL) — a middle-class / working-renter tenant base. Strengths: crime A+, employment A+, housing A+; Watch: amenities F, commute F, cost of living F.
- St. Johns (rural): math 75% / reading 73% proficiency, ranked #2 of 73 in FL (top 3%) — strong family-tenant draw, lease renewals of 3-5y typical; only 20% free/reduced lunch — higher-income household profile.
- Zoned schools: Hickory Creek Elementary School (math 84% / reading 80%, grade A+, #79 of 2,144 statewide, top 4%, 793 students, 11% FRL); Switzerland Point Middle School (math 80% / reading 72%, grade A, #34 of 571 statewide, top 6%, 1,430 students, 5% FRL); Bartram Trail High School (math 68% / reading 75%, grade B+, #49 of 667 statewide, top 8%, 2,493 students, 4% FRL).
- Market conditions: Rents flat; 766 active listings in the ZIP; 2 comparable units currently listed for rent nearby; high-income renter base; 5,575 units permitted in St. Johns County in 2024 (584 in 5+ unit buildings).
Forward outlook
- Local home prices are declining (-3.0%/yr); year-one equity from $2k of loan paydown is wiped out by about $8k of value loss. Plan a longer hold.
- St. Johns County population projected at +60% by 2050 — long-run rental-demand tailwind backs the buy-and-hold thesis.
Negotiation context
- It's been on market 37 days — a 3% lower offer ($262k) is reasonable based on typical stale-listing flexibility.
Questions for the listing agent
- What do current leases actually rent for vs. the listed asking? Can we see a recent rent roll and the last 12 months of T-12 income?
- It's been on market 37 days. Have you received any prior offers? Is the seller open to a 6% concession, seller financing, or rate buy-down credit?
- What does the HOA fee cover, when was the last increase, and are there any pending special assessments or reserve-fund shortfalls?
- Is there a deadline driving the sale (1031 exchange, divorce, estate, relocation)? That informs how much negotiation room exists.
- Schools are A-rated — typically a magnet for longer-tenancy family renters. What's the average tenant stay here, and is there a school-zone premium baked into asking?
- The area grade is low — what's the realistic commute time and amenity access for the typical tenant pool here? Any planned neighborhood developments (good or bad) we should know about?
- What's the average days-on-market for RENTAL listings here right now (not sales)? A rising rental-DOM trend means longer vacancies and softer asking-rent achievability than the comps imply.
- What's the recent tenant-quality profile in this submarket — average credit score on applications, eviction rate, late-payment / NSF rate, and stable-employment percentage? A property-management company in the area should have these aggregated.
- How much new for-sale + rental construction is in the pipeline within 1–3 miles? Heavy new supply typically softens prices + rents 12–24 months out; constrained supply supports both.
Investment metrics
- 1% rule
- 0.94% ✗
- Cap rate
- 5.98%
- Cash-on-cash
- -1.12%
- DSCR
- 0.95
- GRM
- 8.8
CMA / ARV
- ARV (median comp)
- $258,215
- List price
- $270,000
- Delta
- 4.56%
- Verdict
- FAIR
- Comps
- 20 within 1.0 mi
Show comp detail 12 sales within ~0.75 mi
| Address | Dist | Beds/Ba | Sqft | Sold | Price | $/sf | Match |
|---|---|---|---|---|---|---|---|
| 90 Cordelle St | 0.02mi | 3/2.5 | 1,289 (0%) | 1mo | $263,990 | $205 | 98 |
| 52 Cordelle St | 0.04mi | 3/2.5 | 1,288 (-0%) | 1mo | $234,000 | $182 | 97 |
| 59 Downing Dr | 0.05mi | 3/2.5 | 1,289 (0%) | 1mo | $264,000 | $205 | 97 |
| 159 Harrow Cv | 0.07mi | 3/2.5 | 1,288 (-0%) | 2mo | $251,490 | $195 | 95 |
| 39 Downing Dr | 0.06mi | 2/2.5 (-1) | 1,289 (0%) | 1mo | $270,000 | $209 | 91 |
| 86 Cordelle St | 0.02mi | 2/2.5 (-1) | 1,206 (-6%) | 1mo | $249,000 | $206 | 82 |
| 55 Downing Dr | 0.05mi | 2/2.5 (-1) | 1,206 (-6%) | 1mo | $258,500 | $214 | 81 |
| 48 Cordelle St | 0.05mi | 2/2.5 (-1) | 1,206 (-6%) | 2mo | $250,000 | $207 | 81 |
| 43 Downing Dr | 0.06mi | 2/2.5 (-1) | 1,206 (-6%) | 1mo | $254,500 | $211 | 81 |
| 60 Cordelle St | 0.04mi | 2/2.5 (-1) | 1,206 (-6%) | 3mo | $256,500 | $213 | 80 |
| 151 Harrow Cv | 0.07mi | 2/2.5 (-1) | 1,206 (-6%) | 3mo | $258,000 | $214 | 78 |
| 177 Fly Line Dr | 0.32mi | 2/2.0 (-1) | 1,430 (+11%) | 4mo | $355,000 | $248 | 57 |
Match score weights: distance 35% · size 25% · config 20% · recency 20%. Top-matched comps best support the ARV.
Projected returns pro-forma
-3.0% appreciation · 0.0% rent growth · sell at horizon
- IRR
- -21.9%
- Equity multiple
- 0.27×
- Total profit
- $-55,542
- Equity at exit
- $40,258
- IRR
- -27.1%
- Equity multiple
- -0.09×
- Total profit
- $-82,317
- Equity at exit
- $23,345
Cash invested: $75,600 (down + closing). Projections, not guarantees.
Landlord ↔ Tenant lean methodology
- Overall (STATE)
- 87 Strongly Landlord-Friendly
- State Florida
- 87 Strongly Landlord-Friendly · R+3
- County
- — inherits STATE
- City
- — inherits STATE
ZIP-level market 32259
- Home prices YoY
- -28.8%
- Rents YoY
- 0.0%
- Active inventory
- 766
- Price-to-rent
- 8.8×
Monthly cashflow live
- Estimated rent
- $2,549 medium interval (Pro) →
- Mortgage (P&I)
- −$1,416
- Tax from tax record
- −$385 /mo · $4,616/yr
- Insurance
- −$112
- HOA
- −$171
- Vacancy / Maint / Mgmt
- −$535
- Net cashflow
- $-71
Break-even live
Sensitivity live
| Price | -10% $82 | -5% $6 | +0% $-71 | +5% $-147 | +10% $-223 |
|---|---|---|---|---|---|
| Rent | -10% $-272 | -5% $-171 | +0% $-71 | +5% $30 | +10% $131 |
| Rate | -1.0pp $65 | -0.5pp $-2 | base $-71 | +0.5pp $-141 | +1.0pp $-212 |
UW: 25.0% down · 7.5% · 30yr · 1.5% tax · 5.0% vac · 8.0% maint · 8.0% mgmt
Financing live
Cash to close
- Down payment
- $67,500
- Closing costs
- $8,100
- Reserves months
- —
- Total cash needed
- —
Loan-product check · same deal, 3 products live
Conventional
25% down · 7.5% · 30yr
- Down + closing
- —
- Monthly P&I
- —
- Monthly cashflow
- —
- DSCR
- —
- Eligible?
- —
Personal DTI + credit; lowest rate.
DSCR
20% down · 8.5% · 30yr
- Down + closing
- —
- Monthly P&I
- —
- Monthly cashflow
- —
- DSCR
- —
- Eligible?
- —
No personal income docs; deal must DSCR.
Hard money
10% down · 12.0% · 12mo
- Down + closing
- —
- Monthly P&I
- —
- Monthly cashflow
- —
- DSCR
- —
- Eligible?
- —
Short-term bridge; refi at stabilization.
Rent comps 2 comps
| Address | Beds | Baths | Sqft | Rent | $/sqft | DOM | Units | Dist |
|---|---|---|---|---|---|---|---|---|
| 45 Vicksburg Dr Saint Johns, FL | 3.0 | 2.0 | 1620 | $2,600 | $1.60 | 25d | 1 | 1.16mi |
| 84 Vicksburg Dr Saint Johns, FL | 4.0 | 2.0 | 1630 | $2,396 | $1.47 | 25d | 1 | 1.20mi |
HOA detail
- Monthly dues
- $171 · $2,052/yr
Listing history 15 events
-
2026-06-21days on market $270,000 Active 37 DOM
-
2026-06-18days on market $270,000 Active 34 DOM
-
2026-06-17days on market $270,000 Active 33 DOM
-
2026-06-16days on market $270,000 Active 32 DOM
-
2026-06-15days on market $270,000 Active 31 DOM
-
2026-06-13days on market $270,000 Active 29 DOM
-
2026-06-13days on market $270,000 Active 28 DOM
-
2026-06-10days on market $270,000 Active 25 DOM
-
2026-06-08days on market $270,000 Active 24 DOM
-
2026-06-07days on market $270,000 Active 23 DOM
-
2026-06-03days on market $270,000 Active 19 DOM
-
2026-06-02days on market $270,000 Active 18 DOM
-
2026-06-01days on market $270,000 Active 17 DOM
-
2026-05-31days on market $270,000 Active 16 DOM
-
2026-05-14$270,000 Active 1306-char remark
ⓘ Source: listings_history table (triggers on properties + properties_extension) + one-shot
backfill from property_details.listing_events for pre-trigger history.
Tax reassessment forecast FL · Resets to sale price
- Current annual tax
- $4,616 · $385/mo
- Projected year-2 tax
- $4,616 · $385/mo
- Expected delta
- $0/yr ($0/mo · 0.0%)
ⓘ Screening estimate from a state-policy table — verify with the county assessor before closing.
Nearby sold comps map
Loading sold comps map…
Walkable amenities ~0.75 mi
Loading nearby amenities…
Taxation est. · year 1
- Rental income
- $30,585
- − Mortgage interest
- −$15,124
- − Property taxes
- −$4,616
- − Insurance
- −$1,350
- − Repairs & maintenance
- −$2,447
- − Management
- −$2,447
- − HOA
- −$2,052
- − Depreciation
- −$7,855
- Taxable loss
- −$5,305
- Est. tax savings @ 24.0%
- +$1,273
- After-tax cash flow
- $427/yr
For passive investors: Depreciation is non-cash, so a rental often shows a tax loss while cash-flowing — sheltering income. Rental losses are passive: they offset passive income freely, and up to $25,000/yr can offset ordinary (W-2) income if you actively participate and your MAGI is under $100k (phasing out to $0 by $150k); unused losses carry forward. On sale, claimed depreciation is recaptured at up to 25%, and gains may owe capital-gains tax (a 1031 exchange can defer both). Figures are a year-1 estimate at your 24.0% rate — not tax advice; consult a CPA.
Condition & rehab AI · 12 photos
This end-unit townhome in RiverTown Meadows is in excellent condition with a good condition score of 80. It offers a modern and functional floor plan with a good rehab level of 'none'. The property has a good potential for value increase with updates to the exterior, interior, and smart home features.
Value-add opportunities
- Both Painting the exterior and interior walls — Fresh paint can enhance curb appeal and interior aesthetics.
- Both Updating the flooring in the bathrooms — Modern flooring can improve the look and feel of the bathrooms.
- Both Upgrading the kitchen appliances — New appliances can make the kitchen more functional and appealing to potential buyers/renters.
- Both Adding smart home features — Smart home features can increase convenience and appeal to tech-savvy buyers/renters.
- Both Landscaping improvements — Enhanced landscaping can improve curb appeal and add value to the property.
Renovation cost estimate screening
Value-add ROI direction
- Both Painting the exterior and interior walls — Fresh paint can enhance curb appeal and interior aesthetics. ↑
- Both Updating the flooring in the bathrooms — Modern flooring can improve the look and feel of the bathrooms. ↑
- Both Upgrading the kitchen appliances — New appliances can make the kitchen more functional and appealing to potential buyers/renters. ↑
- Both Adding smart home features — Smart home features can increase convenience and appeal to tech-savvy buyers/renters. ↑
- Both Landscaping improvements — Enhanced landscaping can improve curb appeal and add value to the property. ↑
ⓘ Cost ranges are severity-bucket heuristics (US national rule-of-thumb). Get contractor quotes + a written scope before underwriting a rehab budget.
Schools (NCES district)
- District
- St. Johns
- NCES district ID
- 1201740
- Math proficiency
- 75% ▼ -5.00%
- Reading proficiency
- 73% ▼ -2.00%
- Median HH income
- $66,842
- Composite
- 64.31/100
- National rank
- #556
- State rank
- #2 of 73 in FL
Livability — Fruit Cove
- Score
- 69/100
- State rank
- #469
- US rank
- #8490
Category grades
Schools grade is shown separately in the Schools card above.
Census & demographics
- County
- Saint Johns County · 301,599 people
- Metro
- Jacksonville, FL
- Population (ZIP)
- 75,016
- Household income
- $150,736
- Rent vs Own
- Severe rent burden
- 727.0
Population outlook (St. Johns County) Hauer SSP2
- Today (2025)
- 303,941 people
- By 2030
- 342,590 · +12.7%
- By 2040
- 417,328 · +37.3%
- By 2050
- 487,011 · +60.2%
- By 2075
- 635,395 · +109.1%
- By 2100
- 717,469 · +136.1%
Race, ethnicity, and origin ACS 2023
- Neighborhood character
- Predominantly White (73%)
- Race & ethnicity
- White 73% Two or more races 11% Hispanic / Latino 9% Black 6% Asian 6%
- Hispanic origin (detail)
- Puerto Rican 2% Cuban 1%
- Common ancestry
- Romanian 2% Lithuanian 2% Slovak 2%
- Foreign-born
- 13% · Canada, Jamaica, China
- Languages at home
- 86% English-only · Spanish 5% Other Indo-European 4% Other Asian/Pacific 2%
Political lean MEDSL · St. Johns
- 2024 margin
- Solid R (+31.4) · D 33.9% · R 65.2%
- 2008→2024 swing
- +0.2pp no change · 2008: -31.6pp · 2024: -31.4pp
- All cycles
- 2024: R+31.4 2020: R+26.7 2016: R+33.4 2012: R+37.8 2008: R+31.6
Not yet ingested
- Civics
- —
Market trends
- HPI YoY
- ▼ -105.54%
- Current HPI
- 261.2552
- Rent YoY
- ▬ 0.00%
- Metro
- Jacksonville, FL
- State GDP YoY
- ▲ 3.28%
- F500 in state
- 36
Industry mix (Fortune 500 HQ in FL)
| Industry | F500 HQs | Revenue |
|---|---|---|
| Industrial Technology | 2 | $29B |
|
||
| Insurance | 2 | $17B |
|
||
| Retail | 1 | $60B |
|
||
| Technology Distribution | 1 | $58B |
|
||
| Homebuilding | 1 | $35B |
|
||
| Technology Manufacturing | 1 | $35B |
|
||
Price history
1 event — show timeline
- 2026-05-14 Listed $270,000 realMLS
Property tax history
+86.6%/yrLatest (2025): $4,616 · +86.6% YoY. Source: county tax records.
Cash-flow waterfall
monthlySold comps — $/sqft
last 12 mo · ≤1 miLoading sold comps…