 🌊 Lakefront
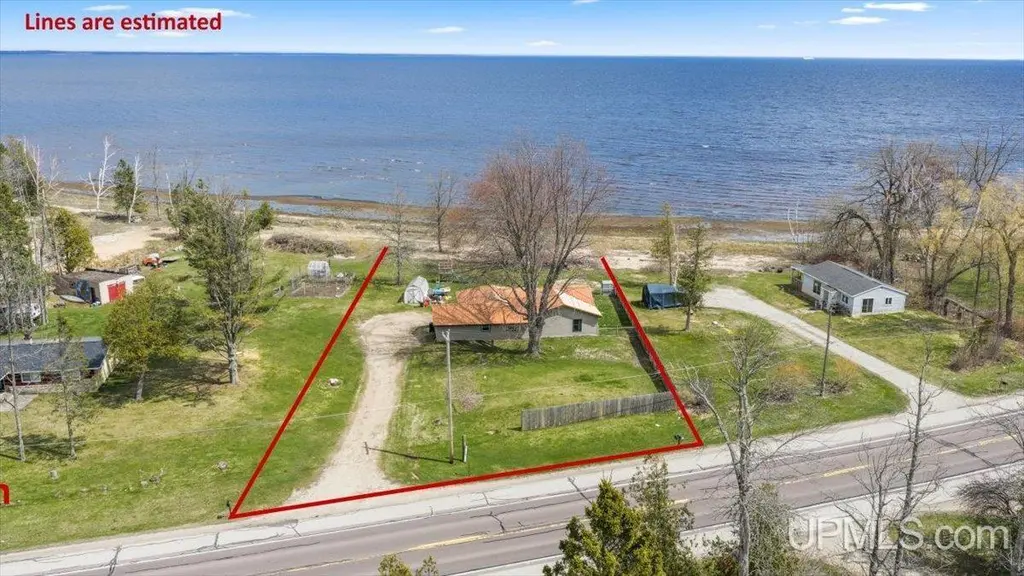
4160 M35 State Hwy · Ford River, MI
Flood risk 6/10 · Moderate
- FEMA flood zone
- X (unshaded)
- Chance of flooding over 30 yrs
- 0.73%
- Est. flood insurance / yr
- $473 – $860
Fire risk 1/10 · Minimal
- Est. fire insurance / yr
- $784 – $1,456
Heat risk 1/10 · Minimal
- Hot days now (above 88°F)
- 7 days/yr
- Hot days in 30 yrs
- 13 days/yr
Wind risk 1/10 · Minimal
- Chance of severe wind over 30 yrs
- —
Air-quality risk 2/10 · Minimal
- Unhealthy air days now
- 1 days/yr
- Unhealthy air days in 30 yrs
- 1 days/yr
Risk factors via First Street. Map © Google.
Why this score? — see what drove the C- grade
The composite is a weighted blend of 9 inputs, each scored 0–100. Each bar is that input's sub-score; the figure is the points it added to the 100-point composite (weight × sub-score).
- Cash flow +20.7/30.0
- ARV discount +7.5/15.0
- DSCR +6.6/10.0
- 1% rule +4.6/10.0
- Schools +3.2/10.0
- Rent growth +2.5/5.0
- Livability +2.5/5.0
- Condition / age +2.5/5.0
- Appreciation +0.0/10.0
$147,000
🖨 Deal sheet 📄 Offer letter ✓ Due diligence
Listing remarks MLS
Lakefront Opportunity! This property offers breathtaking water views and 75 feet of Lake Michigan sandy beachfront with direct access-perfect for enjoying all that lake life has to offer. Please note: this property is in need of extensive structural repairs beyond cosmetic updates. Known issues include a broken floor joists and areas of the foundation that will require replacement. This is an ideal opportunity for investors, contractors, or buyers looking for a prime waterfront location. Bring your vision and make this lakefront property your own! Home will not pass most financing options. Cash, construction loan, or in house only. Appointment with pre-approval or proof of funds is required for a viewing.
Key facts
- 0.52 acre lot
- Built 1950
- Listed 44 days
Property features AI
Exterior
- Utilities: Private well water; Mound septic system; Electricity connected; Natural gas available; Electric water heater
- Home design: One-story residential home; Built in 1950; Waterfront property with lake frontage
- Construction: Vinyl siding exterior; Crawl and slab foundation; Built in 1950
- Exterior features: Vinyl siding; Owned fence; Shed; Lake view; Sand and vegetation shoreline; All-sports lake frontage (Lake Michigan)
Interior
- Kitchen: Range/Oven; Refrigerator
- Bedrooms: Main floor bedroom — 17 x 12; Main floor bedroom — 10 x 13; Main floor bedroom — 12 (width listed as W=12)
- Flooring: Hardwood floors
- Bathrooms: Two full bathrooms (both on the main floor)
- Heating & cooling: Boiler heating; Radiant heat; In-floor supplemental heat; No cooling system listed
- Interior features: Hardwood floors; Living room fireplace (1 fireplace)
- Laundry & utility: Washer; Dryer
Neighborhood map
What this means for you Summary
Snapshot
- This is a 3-bed/2.0-bath single-family listed at $147k.
Deal economics
- At list price, monthly cash flow is $200 ($2k/yr) — positive.
- The deal already cash-flows at list — no discount required.
- To meet the 1% rule (rent ≥ 1% of price), the offer needs to be $140k (4.4% below list).
- Recommended offer: $140k (4.4% below list) — sets the bar for 1% rule.
Location & tenants
- Location reads: area grade C — affects rentability + tenant quality, not the cash-flow math above.
- Escanaba Area Public Schools (town): math 31% / reading 46% proficiency, ranked #243 of 540 in MI (top 45%) — families likely to look elsewhere, expect single-tenant / working-renter base with shorter leases.
- Market conditions: 63 active listings in the ZIP; 38 units permitted in Delta County in 2024 (0 in 5+ unit buildings).
Forward outlook
- Local home prices are declining (-3.0%/yr); year-one equity from $1k of loan paydown is wiped out by about $4k of value loss. Plan a longer hold.
- Delta County population projected at -22% by 2050 — secular population decline; favor cash flow + early exit over multi-decade hold.
Negotiation context
- It's been on market 44 days — a 3% lower offer ($143k) is reasonable based on typical stale-listing flexibility.
- 6 sale attempts since 12y ago with the ask held roughly flat each time — persistent listings suggest the price (not the market) is what's stuck; bring a comps-based counter.
Risks & watch-outs
- Watch-outs: built in 1950 — expect roof / HVAC / electrical / plumbing capex.
- Climate carrying-cost: major flood risk — expect insurance premiums to compound above CPI over the hold.
Questions for the listing agent
- It's been on market 44 days. Have you received any prior offers? Is the seller open to a 4% concession, seller financing, or rate buy-down credit?
- Built in 1950 — when were the roof, HVAC, electrical panel, plumbing, and water heater last replaced?
- Is there a deadline driving the sale (1031 exchange, divorce, estate, relocation)? That informs how much negotiation room exists.
- This sits on a lake — are riparian / water-frontage rights deeded with the parcel? Any dock permits, shoreline easements, or HOA water-use restrictions?
- What's the documented flood / surge / shoreline-erosion history here (FEMA AND non-FEMA — e.g., storm surge, creek backup, septic-field saturation)?
- Any water-quality or seasonal algae-bloom issues that affect tenant satisfaction or short-term-rental demand?
- What's the average days-on-market for RENTAL listings here right now (not sales)? A rising rental-DOM trend means longer vacancies and softer asking-rent achievability than the comps imply.
- What's the recent tenant-quality profile in this submarket — average credit score on applications, eviction rate, late-payment / NSF rate, and stable-employment percentage? A property-management company in the area should have these aggregated.
- How much new for-sale + rental construction is in the pipeline within 1–3 miles? Heavy new supply typically softens prices + rents 12–24 months out; constrained supply supports both.
Investment metrics
- 1% rule
- 0.96% ✗
- Cap rate
- 7.92%
- Cash-on-cash
- 5.82%
- DSCR
- 1.26
- GRM
- 8.7
CMA / ARV
- ARV (median comp)
- $303,044
- List price
- $147,000
- Delta
- -51.49%
- Verdict
- UNDERPRICED
- Comps
- 5 within 1.0 mi
Projected returns pro-forma
-3.0% appreciation · 3.0% rent growth · sell at horizon
- IRR
- -7.3%
- Equity multiple
- 0.73×
- Total profit
- $-11,154
- Equity at exit
- $21,918
- IRR
- 2.2%
- Equity multiple
- 1.16×
- Total profit
- $6,475
- Equity at exit
- $12,710
Cash invested: $41,160 (down + closing). Projections, not guarantees.
Landlord ↔ Tenant lean methodology
- Overall (STATE)
- 62 Landlord-Friendly
- State Michigan
- 62 Landlord-Friendly · EVEN
- County
- — inherits STATE
- City
- — inherits STATE
ZIP-level market 49829
- Home prices YoY
- -25.6%
- Active inventory
- 63
- Price-to-rent
- 8.7×
Monthly cashflow live
- Estimated rent
- $1,405 medium interval (Pro) →
- Mortgage (P&I)
- −$771
- Tax from tax record
- −$78 /mo · $938/yr
- Insurance
- −$61
- HOA
- −$0
- Vacancy / Maint / Mgmt
- −$295
- Net cashflow
- $200
Break-even live
UW: 25.0% down · 7.5% · 30yr · 1.5% tax · 5.0% vac · 8.0% maint · 8.0% mgmt
Financing live
Cash to close
- Down payment
- $36,750
- Closing costs
- $4,410
- Reserves months
- —
- Total cash needed
- —
Loan-product check · same deal, 3 products live
Conventional
25% down · 7.5% · 30yr
- Down + closing
- —
- Monthly P&I
- —
- Monthly cashflow
- —
- DSCR
- —
- Eligible?
- —
Personal DTI + credit; lowest rate.
DSCR
20% down · 8.5% · 30yr
- Down + closing
- —
- Monthly P&I
- —
- Monthly cashflow
- —
- DSCR
- —
- Eligible?
- —
No personal income docs; deal must DSCR.
Hard money
10% down · 12.0% · 12mo
- Down + closing
- —
- Monthly P&I
- —
- Monthly cashflow
- —
- DSCR
- —
- Eligible?
- —
Short-term bridge; refi at stabilization.
Listing history 32 events
-
2026-06-18days on market $147,000 Active 44 DOM
-
2026-06-17days on market $147,000 Active 43 DOM
-
2026-06-16days on market $147,000 Active 42 DOM
-
2026-06-15days on market $147,000 Active 41 DOM
-
2026-06-13days on market $147,000 Active 39 DOM
-
2026-06-12remarks 699-char remark
-
2026-06-12days on market $147,000 Active 38 DOM
-
2026-06-09days on market $147,000 Active 35 DOM
-
2026-06-08days on market $147,000 Active 34 DOM
-
2026-06-07days on market $147,000 Active 33 DOM
-
2026-06-07days on market $147,000 Active 32 DOM
-
2026-06-04days on market $147,000 Active 29 DOM
-
2026-06-02days on market $147,000 Active 28 DOM
-
2026-06-01days on market $147,000 Active 27 DOM
-
2026-05-31days on market $147,000 Active 26 DOM
-
2026-05-31days on market $147,000 Active 25 DOM
-
2026-05-05$147,000 Active 628-char remark
Show marketing remark (714 chars)
Lakefront Opportunity! This property offers breathtaking water views and 75 feet of Lake Michigan sandy beachfront with direct access-perfect for enjoying all that lake life has to offer. Please note: this property is in need of extensive structural repairs beyond cosmetic updates. Known issues include a broken floor joists and areas of the foundation that will require replacement. This is an ideal opportunity for investors, contractors, or buyers looking for a prime waterfront location. Bring your vision and make this lakefront property your own! Home will not pass most financing options. Cash, construction loan, or in house only. Appointment with pre-approval or proof of funds is required for a viewing.
-
2025-12-11historical
-
2025-08-30price $223,500
-
2025-08-30price $223,500
-
2025-07-28price $228,500
-
2025-07-28price $228,500
-
2025-07-22price $234,500
-
2025-07-21price $234,500
-
2025-07-02$240,000 Active
-
2016-05-04historical
-
2015-11-30$103,244
-
2015-09-26historical
-
2015-03-25$115,000
-
2014-06-04historical
-
2014-04-08$129,900
ⓘ Source: listings_history table (triggers on properties + properties_extension) + one-shot
backfill from property_details.listing_events for pre-trigger history.
Tax reassessment forecast MI · Partial reset (capped growth)
- Current annual tax
- $938 · $78/mo
- Projected year-2 tax
- $1,601 · $133/mo
- Expected delta
- +$663/yr (+$55/mo · 70.7%)
ⓘ Screening estimate from a state-policy table — verify with the county assessor before closing.
Climate risk First Street
- Flood 6/10 Major FEMA zone X (unshaded) · 73% chance over 30 yrs
- Wildfire 1/10 Low
- Heat 1/10 Low 7 d/yr ≥88°F today · 13 d/yr by 30 yrs out
- Wind 1/10 Low
- Air quality 2/10 Low 1 unhealthy d/yr today · 1 by 30 yrs out
Nearby sold comps map
Loading sold comps map…
Walkable amenities ~0.75 mi
Loading nearby amenities…
Taxation est. · year 1
- Rental income
- $16,858
- − Mortgage interest
- −$8,234
- − Property taxes
- −$938
- − Insurance
- −$735
- − Repairs & maintenance
- −$1,349
- − Management
- −$1,349
- − Depreciation
- −$4,276
- Taxable loss
- −$23
- Est. tax savings @ 24.0%
- +$5
- After-tax cash flow
- $2,400/yr
For passive investors: Depreciation is non-cash, so a rental often shows a tax loss while cash-flowing — sheltering income. Rental losses are passive: they offset passive income freely, and up to $25,000/yr can offset ordinary (W-2) income if you actively participate and your MAGI is under $100k (phasing out to $0 by $150k); unused losses carry forward. On sale, claimed depreciation is recaptured at up to 25%, and gains may owe capital-gains tax (a 1031 exchange can defer both). Figures are a year-1 estimate at your 24.0% rate — not tax advice; consult a CPA.
Schools (NCES district)
- District
- Escanaba Area Public Schools
- NCES district ID
- 2613500
- Math proficiency
- 31% ▼ -8.00%
- Reading proficiency
- 46% ▼ -1.00%
- Median HH income
- $37,187
- Composite
- 31.97/100
- National rank
- #5841
- State rank
- #243 of 540 in MI
Livability — Ford River
No livability data for this city. (Only ~50 U.S. cities are tracked.)
Census & demographics
- Population (ZIP)
- 16,859
Population outlook (Delta County) Hauer SSP2
- Today (2025)
- 34,431 people
- By 2030
- 33,003 · -4.1%
- By 2040
- 29,748 · -13.6%
- By 2050
- 26,753 · -22.3%
- By 2075
- 20,962 · -39.1%
- By 2100
- 15,616 · -54.6%
Race, ethnicity, and origin ACS 2023
- Neighborhood character
- Predominantly White (88%)
- Race & ethnicity
- White 88% Two or more races 9% Hispanic / Latino 2% Native American 2%
- Common ancestry
- Lithuanian 14% Italian 4% Romanian 4%
- Foreign-born
- 1% · Canada
Political lean MEDSL · Delta
- 2024 margin
- Solid R (+30.4) · D 34.1% · R 64.5% · Other 1.4%
- 2008→2024 swing
- -36.7pp toward R · 2008: 6.3pp · 2024: -30.4pp
- All cycles
- 2024: R+30.4 2020: R+26.5 2016: R+25.4 2012: R+6.7 2008: D+6.3
Not yet ingested
- Civics
- —
Market trends
- HPI YoY
- ▼ -85.16%
- Current HPI
- 247.9676
- Rent YoY
- —
- Metro
- —
- State GDP YoY
- ▲ 1.37%
- F500 in state
- 28
Industry mix (Fortune 500 HQ in MI)
| Industry | F500 HQs | Revenue |
|---|---|---|
| Automotive Parts | 3 | $48B |
|
||
| Automotive | 2 | $372B |
|
||
| Chemicals | 1 | $45B |
|
||
| Automotive Retail | 1 | $29B |
|
||
| Healthcare / Medical Devices | 1 | $23B |
|
||
| Automotive Technology | 1 | $20B |
|
||
Price history
+13.2% since first listed16 events — show timeline
- 2026-05-05 Listed $147,000 MiRealSource-MiMLS
- 2026-05-05 Listed $147,000 UPAR
- 2025-12-11 Listing Removed — MiRealSource-MiMLS
- 2025-08-30 Price Changed $223,500 MiRealSource-MiMLS
- 2025-08-30 Price Changed $223,500 UPAR
- 2025-07-28 Price Changed $228,500 MiRealSource-MiMLS
- 2025-07-28 Price Changed $228,500 UPAR
- 2025-07-22 Price Changed $234,500 MiRealSource-MiMLS
- 2025-07-21 Price Changed $234,500 UPAR
- 2025-07-02 Listed $240,000 MiRealSource-MiMLS
- 2016-05-04 Listing Removed — MiRealSource-MiMLS
- 2015-11-30 Listed $103,244 MiRealSource-MiMLS
- 2015-09-26 Listing Removed — MiRealSource-MiMLS
- 2015-03-25 Listed $115,000 MiRealSource-MiMLS
- 2014-06-04 Listing Removed — MiRealSource-MiMLS
- 2014-04-08 Listed $129,900 MiRealSource-MiMLS
Property tax history
-1.2%/yrLatest (2025): $938 · -54.3% YoY. Source: county tax records.
Cash-flow waterfall
monthlySold comps — $/sqft
last 12 mo · ≤1 miLoading sold comps…