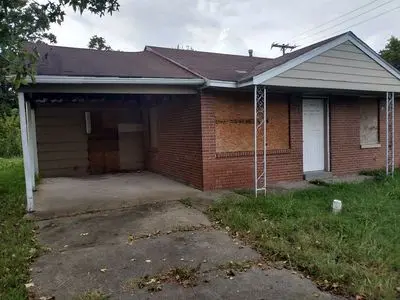
712 Stuart Ave · West Memphis, AR
Flood risk No data
- FEMA flood zone
- —
- Chance of flooding over 30 yrs
- —
- Est. flood insurance / yr
- —
Fire risk No data
- Est. fire insurance / yr
- —
Heat risk No data
- Hot days now (above threshold)
- —
- Hot days in 30 yrs
- —
Wind risk No data
- Chance of severe wind over 30 yrs
- —
Air-quality risk No data
- Unhealthy air days now
- —
- Unhealthy air days in 30 yrs
- —
Risk factors via First Street. Map © Google.
Why this score? — see what drove the C grade
The composite is a weighted blend of 9 inputs, each scored 0–100. Each bar is that input's sub-score; the figure is the points it added to the 100-point composite (weight × sub-score).
- Cash flow +21.7/30.0
- ARV discount +14.2/15.0
- DSCR +6.9/10.0
- 1% rule +5.0/10.0
- Livability +2.8/5.0
- Rent growth +2.5/5.0
- Condition / age +2.5/5.0
- Schools +1.2/10.0
- Appreciation +0.0/10.0
$78,000
🖨 Deal sheet (PDF) 📄 Offer letter ✓ Due diligence
Listing remarks
This is located right beside the highway 3 minutes away from 6 different nice/new hotels. It is 5 minutes away from a Chick-Fil-A, McDonalds, Walgreens, Hospital, Krogers, Walmart and Elementary School. It is also 20 minutes away from the center of Memphis TN. The structure is good, but the entire projects needs to be remodeled.
Key facts
- Built 1956
- Listed 26 days
Neighborhood map
What this means for you Summary
Snapshot
- This is a 3-bed/1.0-bath single-family listed at $78k.
Deal economics
- At list price, monthly cash flow is $120 ($1k/yr) — positive.
- The deal already cash-flows at list — no discount required.
- Meets the 1% rule at list price ($780 rent vs $78k).
- Recommended offer: $77k (1.5% below list) — sets the bar for market timing.
Location & tenants
- Location reads 55/100 on livability (#413 in AR) — a working-class tenant base; expect higher turnover. Strengths: cost of living A+, housing A; Watch: crime F, amenities F, commute F.
- West Memphis School District (suburban): math 16% / reading 15% proficiency, ranked #224 of 238 in AR (top 94%) — low school quality limits family demand, transient renter base, plan for 1-2y turnover; 96% free/reduced lunch — lower-income household profile, screen leases tightly.
- Zoned schools: Maddux Elementary School (math 12% / reading 9%, grade F, #425 of 454 statewide, top 94%, 443 students, 100% FRL); East Junior High School (math 5% / reading 12%, grade F, #197 of 201 statewide, top 98%, 263 students, 100% FRL); The Academies of West Memphis Charter School (math 7% / reading 22%, grade F, #265 of 292 statewide, top 91%, 952 students, 100% FRL, charter) — zoned schools at 100% FRL track the district average.
- Market conditions: 136 active listings in the ZIP; 4 comparable units currently listed for rent nearby; rentals lingering (median 45d on market — plan ~5-8 weeks vacancy on turnover, expect pricing pressure); 50% of comp listings sitting > 30 days — soft ceiling on asking rent; 69 units permitted in Crittenden County in 2024 (0 in 5+ unit buildings).
Forward outlook
- Local home prices are declining (-3.0%/yr); year-one equity from $539 of loan paydown is wiped out by about $2k of value loss. Plan a longer hold.
- Crittenden County population projected at -26% by 2050 — secular population decline; favor cash flow + early exit over multi-decade hold.
Negotiation context
- It's been on market 26 days — a 2% lower offer ($77k) is reasonable based on typical stale-listing flexibility.
- Current owner paid $29k; list at $78k implies a 169% gain — meaningful room to come down on a strong offer.
Risks & watch-outs
- Watch-outs: built in 1956 — expect roof / HVAC / electrical / plumbing capex.
Questions for the listing agent
- Built in 1956 — when were the roof, HVAC, electrical panel, plumbing, and water heater last replaced?
- Is there a deadline driving the sale (1031 exchange, divorce, estate, relocation)? That informs how much negotiation room exists.
- Schools are D-rated, which usually means shorter tenancies and higher turnover. Who's the typical renter profile here, and what's been the actual vacancy rate?
- Crime grade is F in this area — have there been break-ins, vandalism, or insurance claims at this property in the last 3 years? What carrier currently insures it and at what premium?
- What's the average days-on-market for RENTAL listings here right now (not sales)? A rising rental-DOM trend means longer vacancies and softer asking-rent achievability than the comps imply.
- What's the recent tenant-quality profile in this submarket — average credit score on applications, eviction rate, late-payment / NSF rate, and stable-employment percentage? A property-management company in the area should have these aggregated.
- How much new for-sale + rental construction is in the pipeline within 1–3 miles? Heavy new supply typically softens prices + rents 12–24 months out; constrained supply supports both.
Investment metrics
- 1% rule
- 1.00% ✓
- Cap rate
- 8.13%
- Cash-on-cash
- 6.57%
- DSCR
- 1.29
- GRM
- 8.3
CMA / ARV
- ARV (on-the-fly)
- $91,744
- Comps found
- 12
Show comp detail 12 sales within ~0.75 mi
| Address | Dist | Beds/Ba | Sqft | Sold | Price | $/sf | Match |
|---|---|---|---|---|---|---|---|
| 601 N 28th St | 0.18mi | 3/1.0 | 951 (-3%) | 4mo | $125,000 | $131 | 84 |
| 516 N 28th St | 0.20mi | 3/1.0 | 1,014 (+4%) | 12mo | $39,000 | $38 | 75 |
| 2904 Beatty St | 0.35mi | 3/1.5 | 1,000 (+2%) | 6mo | $136,000 | $136 | 73 |
| 2692 Beatty St | 0.27mi | 3/1.0 | 1,053 (+8%) | 3mo | $137,000 | $130 | 72 |
| 2919 Beatty St | 0.45mi | 3/1.0 | 936 (-4%) | 5mo | $16,000 | $17 | 68 |
| 2413 Gathings Dr | 0.42mi | 3/1.0 | 1,040 (+7%) | 4mo | $27,000 | $26 | 66 |
| 721 E Mcauley | 0.45mi | 3/1.0 | 846 (-13%) | 3mo | $41,000 | $48 | 55 |
| 3306 Church St | 0.55mi | 3/1.0 | 1,040 (+7%) | 15mo | $105,000 | $101 | 51 |
| 2009 Goodwin Ave | 0.43mi | 2/1.0 (-1) | 850 (-13%) | 6mo | $110,000 | $129 | 49 |
| 2501 S Woodlawn St | 0.30mi | 3/1.0 | 1,122 (+15%) | 16mo | $105,000 | $94 | 48 |
| 3407 Beatty St | 0.70mi | 3/1.0 | 1,040 (+7%) | 15mo | $80,000 | $77 | 44 |
| 525 N 18th St | 0.65mi | 2/1.0 (-1) | 875 (-10%) | 20mo | $22,700 | $26 | 31 |
Match score weights: distance 35% · size 25% · config 20% · recency 20%. Top-matched comps best support the ARV.
Projected returns pro-forma
-3.0% appreciation · 3.0% rent growth · sell at horizon
- IRR
- -6.2%
- Equity multiple
- 0.77×
- Total profit
- $-5,032
- Equity at exit
- $11,630
- IRR
- 3.4%
- Equity multiple
- 1.25×
- Total profit
- $5,374
- Equity at exit
- $6,744
Cash invested: $21,840 (down + closing). Projections, not guarantees.
Landlord ↔ Tenant lean methodology
- Overall (STATE)
- 92 Strongly Landlord-Friendly
- State Arkansas
- 92 Strongly Landlord-Friendly · R+14
- County
- — inherits STATE
- City
- — inherits STATE
ZIP-level market 72301
- Active inventory
- 136
- Price-to-rent
- 8.3×
Monthly cashflow live
- Estimated rent
- $780 medium interval (Pro) →
- Mortgage (P&I)
- −$409
- Tax from tax record
- −$55 /mo · $665/yr
- Insurance
- −$32
- HOA
- −$0
- Vacancy / Maint / Mgmt
- −$164
- Net cashflow
- $120
Break-even live
Sensitivity live
| Price | -10% $164 | -5% $142 | +0% $120 | +5% $98 | +10% $76 |
|---|---|---|---|---|---|
| Rent | -10% $58 | -5% $89 | +0% $120 | +5% $150 | +10% $181 |
| Rate | -1.0pp $159 | -0.5pp $139 | base $120 | +0.5pp $99 | +1.0pp $79 |
UW: 25.0% down · 7.5% · 30yr · 1.5% tax · 5.0% vac · 8.0% maint · 8.0% mgmt
Financing live
Cash to close
- Down payment
- $19,500
- Closing costs
- $2,340
- Reserves months
- —
- Total cash needed
- —
Loan-product check · same deal, 3 products live
Conventional
25% down · 7.5% · 30yr
- Down + closing
- —
- Monthly P&I
- —
- Monthly cashflow
- —
- DSCR
- —
- Eligible?
- —
Personal DTI + credit; lowest rate.
DSCR
20% down · 8.5% · 30yr
- Down + closing
- —
- Monthly P&I
- —
- Monthly cashflow
- —
- DSCR
- —
- Eligible?
- —
No personal income docs; deal must DSCR.
Hard money
10% down · 12.0% · 12mo
- Down + closing
- —
- Monthly P&I
- —
- Monthly cashflow
- —
- DSCR
- —
- Eligible?
- —
Short-term bridge; refi at stabilization.
Rent comps 4 comps
| Address | Beds | Baths | Sqft | Rent | $/sqft | DOM | Units | Dist |
|---|---|---|---|---|---|---|---|---|
| 2400 Goodwin Ave West Memphis, AR | 2.0 | 1.5 | 1100 | $775 | $0.70 | 45d | 1 | 0.19mi |
| 2401 Wheeler Ave West Memphis, AR | 2.0 | 1.0 | 1000 | $750 | $0.75 | 45d | 1 | 0.19mi |
| 2416 Thompson Ave West Memphis, AR | 2.0 | 1.0 | 550 | $738 | $1.34 | 3d | 3 | 0.53mi |
| 741 N 18th St West Memphis, AR | 2.0 | 1.0 | 814 | $940 | $1.15 | 5d | 1 | 0.59mi |
Listing history 16 events
-
2026-06-21days on market $78,000 Active 26 DOM
-
2026-06-18days on market $78,000 Active 23 DOM
-
2026-06-17days on market $78,000 Active 22 DOM
-
2026-06-16days on market $78,000 Active 21 DOM
-
2026-06-15days on market $78,000 Active 20 DOM
-
2026-06-13days on market $78,000 Active 18 DOM
-
2026-06-10days on market $78,000 Active 15 DOM
-
2026-06-09days on market $78,000 Active 14 DOM
-
2026-06-08days on market $78,000 Active 13 DOM
-
2026-06-07days on market $78,000 Active 12 DOM
-
2026-06-03days on market $78,000 Active 8 DOM
-
2026-06-02days on market $78,000 Active 7 DOM
-
2026-06-01days on market $78,000 Active 6 DOM
-
2026-05-31days on market $78,000 Active 5 DOM
-
2026-05-26$78,000 Active
-
1996-06-10soldstatus $29,000
ⓘ Source: listings_history table (triggers on properties + properties_extension) + one-shot
backfill from property_details.listing_events for pre-trigger history.
Tax reassessment forecast AR · Resets to sale price
- Current annual tax
- $665 · $55/mo
- Projected year-2 tax
- $665 · $55/mo
- Expected delta
- $0/yr ($0/mo · 0.0%)
ⓘ Screening estimate from a state-policy table — verify with the county assessor before closing.
Nearby sold comps map
Loading sold comps map…
Walkable amenities ~0.75 mi
Loading nearby amenities…
Taxation est. · year 1
- Rental income
- $9,366
- − Mortgage interest
- −$4,369
- − Property taxes
- −$665
- − Insurance
- −$390
- − Repairs & maintenance
- −$749
- − Management
- −$749
- − Depreciation
- −$2,269
- Taxable income
- $174
- Est. tax owed @ 24.0%
- −$42
- After-tax cash flow
- $1,394/yr
For passive investors: Depreciation is non-cash, so a rental often shows a tax loss while cash-flowing — sheltering income. Rental losses are passive: they offset passive income freely, and up to $25,000/yr can offset ordinary (W-2) income if you actively participate and your MAGI is under $100k (phasing out to $0 by $150k); unused losses carry forward. On sale, claimed depreciation is recaptured at up to 25%, and gains may owe capital-gains tax (a 1031 exchange can defer both). Figures are a year-1 estimate at your 24.0% rate — not tax advice; consult a CPA.
Schools (NCES district)
- District
- West Memphis School District
- NCES district ID
- 0508040
- Math proficiency
- 16% ▼ -14.00%
- Reading proficiency
- 15% ▼ -14.00%
- Median HH income
- $29,382
- Composite
- 12.22/100
- National rank
- #9647
- State rank
- #224 of 238 in AR
Livability — West Memphis
- Score
- 55/100
- State rank
- #413
- US rank
- #23638
Category grades
Schools grade is shown separately in the Schools card above.
Census & demographics
- Census place
- West Memphis, AR
- City population
- 24,182
- Population (ZIP)
- 24,182
Population outlook (Crittenden County) Hauer SSP2
- Today (2025)
- 45,254 people
- By 2030
- 42,953 · -5.1%
- By 2040
- 38,235 · -15.5%
- By 2050
- 33,670 · -25.6%
- By 2075
- 24,315 · -46.3%
- By 2100
- 17,173 · -62.1%
Race, ethnicity, and origin ACS 2023
- Neighborhood character
- Majority Black (64%)
- Race & ethnicity
- Black 64% White 29% Two or more races 6% Hispanic / Latino 2%
- Common ancestry
- Serbian 1%
- Foreign-born
- 1% · Canada
- Languages at home
- 98% English-only · Spanish 1%
Political lean MEDSL · Crittenden
- 2024 margin
- Toss-up / Even · D 50.1% · R 47.9% · Other 2.0%
- 2008→2024 swing
- -12.4pp toward R · 2008: 14.7pp · 2024: 2.3pp
- All cycles
- 2024: D+2.3 2020: D+7.2 2016: D+9.0 2012: D+18.7 2008: D+14.7
Not yet ingested
- Civics
- —
Market trends
- HPI YoY
- ▼ -143.63%
- Current HPI
- 182.7665
- Rent YoY
- —
- Metro
- —
- State GDP YoY
- ▲ 3.80%
- F500 in state
- 10
Industry mix (Fortune 500 HQ in AR)
| Industry | F500 HQs | Revenue |
|---|---|---|
| Retail | 1 | $681B |
|
||
| Food / Agriculture | 1 | $53B |
|
||
| Retail / Energy | 1 | $22B |
|
||
| Transportation / Logistics | 1 | $12B |
|
||
| Energy | 1 | $4B |
|
||
Price history
+169.0% since first listed2 events — show timeline
- 2026-05-26 Listed $78,000 FSBO.com
- 1996-06-10 Sold (Public Records) $29,000 Public Records
Property tax history
+5.7%/yrLatest (2025): $665 · +76.2% YoY. Source: county tax records.
Cash-flow waterfall
monthlySold comps — $/sqft
last 12 mo · ≤1 miLoading sold comps…