315796 Cabbage Rd · Portage, MI
Flood risk 9/10 · Severe
- FEMA flood zone
- —
- Chance of flooding over 30 yrs
- 0.99%
- Est. flood insurance / yr
- —
Fire risk 2/10 · Minimal
- Est. fire insurance / yr
- $784 – $1,456
Heat risk 1/10 · Minimal
- Hot days now (above 93°F)
- 7 days/yr
- Hot days in 30 yrs
- 12 days/yr
Wind risk 1/10 · Minimal
- Chance of severe wind over 30 yrs
- —
Air-quality risk 1/10 · Minimal
- Unhealthy air days now
- 0 days/yr
- Unhealthy air days in 30 yrs
- 0 days/yr
Risk factors via First Street. Map © Google.
Why this score? — see what drove the C+ grade
The composite is a weighted blend of 9 inputs, each scored 0–100. Each bar is that input's sub-score; the figure is the points it added to the 100-point composite (weight × sub-score).
- Cash flow +24.5/30.0
- ARV discount +15.0/15.0
- DSCR +7.9/10.0
- 1% rule +6.3/10.0
- Livability +4.0/5.0
- Rent growth +2.5/5.0
- Schools +2.4/10.0
- Condition / age +1.0/5.0
- Appreciation +0.0/10.0
$129,900
🖨 Deal sheet 📄 Offer letter ✓ Due diligence
Listing remarks MLS
ONLY SELLING 1/3 INTEREST 200 ACRES HOUGHTON COUNTY FRONTAGE ON CABBAGE ROAD POWER AT ROAD NOT TO CAMP. FRONTAGE ON OTTER RIVER.
Key facts
- 200 acre lot
- Built 1950
- Listed 63 days
Neighborhood map
What this means for you Summary
Snapshot
- This is a 2-bed/0.5-bath single-family listed at $130k. Condition is rated poor.
Deal economics
- At list price, monthly cash flow is $266 ($3k/yr) — positive.
- The deal already cash-flows at list — no discount required.
- Meets the 1% rule at list price ($1k rent vs $130k).
- Recommended offer: $122k (6.0% below list) — sets the bar for market timing.
- Cap rate 8.7% vs local median 3.3% in Portage — top-decile yield for the area; either an underpriced asset or a hidden risk that comps aren't pricing in. Stress-test before assuming the spread holds.
Location & tenants
- Location reads 79/100 on livability (#90 in MI, #2,044 nationally) — a middle-class / working-renter tenant base. Strengths: cost of living A+, housing A+, health & safety A+; Watch: crime D+, amenities D-, commute F.
- Baraga Area Schools (rural): math 15% / reading 35% proficiency, ranked #603 of 760 in MI (top 79%) — low school quality limits family demand, transient renter base, plan for 1-2y turnover.
- Market conditions: 50 active listings in the ZIP; 111 units permitted in Houghton County in 2024 (0 in 5+ unit buildings).
Forward outlook
- Local home prices are declining (-3.0%/yr); year-one equity from $898 of loan paydown is wiped out by about $4k of value loss. Plan a longer hold.
- Houghton County population projected to shrink 10% by 2050 — rents likely to lag national; underwrite the cash flow, not the appreciation.
Negotiation context
- It's been on market 64 days — a 6% lower offer ($122k) is reasonable based on typical stale-listing flexibility.
- 2 sale attempts with the ask held roughly flat each time — persistent listings suggest the price (not the market) is what's stuck; bring a comps-based counter.
Risks & watch-outs
- Watch-outs: built in 1950 — expect roof / HVAC / electrical / plumbing capex.
- Climate carrying-cost: severe flood risk — expect insurance premiums to compound above CPI over the hold.
Questions for the listing agent
- It's been on market 64 days. Have you received any prior offers? Is the seller open to a 6% concession, seller financing, or rate buy-down credit?
- Have any recent inspections been done? Can we get a copy of the seller's disclosures and any deferred-maintenance estimates?
- Built in 1950 — when were the roof, HVAC, electrical panel, plumbing, and water heater last replaced?
- Why hasn't it sold? Are there any deal-killer items the seller is aware of (foundation, flood, title, zoning, code violations)?
- Is there a deadline driving the sale (1031 exchange, divorce, estate, relocation)? That informs how much negotiation room exists.
- Schools are A-rated — typically a magnet for longer-tenancy family renters. What's the average tenant stay here, and is there a school-zone premium baked into asking?
- Crime grade is D in this area — have there been break-ins, vandalism, or insurance claims at this property in the last 3 years? What carrier currently insures it and at what premium?
- What's the average days-on-market for RENTAL listings here right now (not sales)? A rising rental-DOM trend means longer vacancies and softer asking-rent achievability than the comps imply.
- What's the recent tenant-quality profile in this submarket — average credit score on applications, eviction rate, late-payment / NSF rate, and stable-employment percentage? A property-management company in the area should have these aggregated.
- How much new for-sale + rental construction is in the pipeline within 1–3 miles? Heavy new supply typically softens prices + rents 12–24 months out; constrained supply supports both.
Investment metrics
- 1% rule
- 1.13% ✓
- Cap rate
- 8.75%
- Cash-on-cash
- 8.76%
- DSCR
- 1.39
- GRM
- 7.4
CMA / ARV
- ARV (median comp)
- $161,967
- List price
- $129,900
- Delta
- -19.80%
- Verdict
- UNDERPRICED
- Comps
- 2 within 1.0 mi
Show comp detail 1 sale within ~0.75 mi
| Address | Dist | Beds/Ba | Sqft | Sold | Price | $/sf | Match |
|---|---|---|---|---|---|---|---|
| 31284 Cabbage Rd | 0.34mi | 3/1.0 (+1) | 1,405 (+8%) | 22mo | $210,000 | $149 | 45 |
Match score weights: distance 35% · size 25% · config 20% · recency 20%. Top-matched comps best support the ARV.
Projected returns pro-forma
-3.0% appreciation · 3.0% rent growth · sell at horizon
- IRR
- -3.0%
- Equity multiple
- 0.89×
- Total profit
- $-4,109
- Equity at exit
- $19,369
- IRR
- 6.7%
- Equity multiple
- 1.50×
- Total profit
- $18,298
- Equity at exit
- $11,231
Cash invested: $36,372 (down + closing). Projections, not guarantees.
Landlord ↔ Tenant lean methodology
- Overall (STATE)
- 62 Landlord-Friendly
- State Michigan
- 62 Landlord-Friendly · EVEN
- County
- — inherits STATE
- City
- — inherits STATE
ZIP-level market 49931
- Active inventory
- 50
- Price-to-rent
- 7.4×
Monthly cashflow live
- Estimated rent
- $1,473 medium interval (Pro) →
- Mortgage (P&I)
- −$681
- Tax est. 1.5%
- −$162 /mo · $1,948/yr
- Insurance
- −$54
- HOA
- −$0
- Vacancy / Maint / Mgmt
- −$309
- Net cashflow
- $266
Break-even live
UW: 25.0% down · 7.5% · 30yr · 1.5% tax · 5.0% vac · 8.0% maint · 8.0% mgmt
Financing live
Cash to close
- Down payment
- $32,475
- Closing costs
- $3,897
- Reserves months
- —
- Total cash needed
- —
Loan-product check · same deal, 3 products live
Conventional
25% down · 7.5% · 30yr
- Down + closing
- —
- Monthly P&I
- —
- Monthly cashflow
- —
- DSCR
- —
- Eligible?
- —
Personal DTI + credit; lowest rate.
DSCR
20% down · 8.5% · 30yr
- Down + closing
- —
- Monthly P&I
- —
- Monthly cashflow
- —
- DSCR
- —
- Eligible?
- —
No personal income docs; deal must DSCR.
Hard money
10% down · 12.0% · 12mo
- Down + closing
- —
- Monthly P&I
- —
- Monthly cashflow
- —
- DSCR
- —
- Eligible?
- —
Short-term bridge; refi at stabilization.
Listing history 17 events
-
2026-06-18days on market $129,900 Active 64 DOM
-
2026-06-17days on market $129,900 Active 63 DOM
-
2026-06-16days on market $129,900 Active 62 DOM
-
2026-06-15days on market $129,900 Active 61 DOM
-
2026-06-13days on market $129,900 Active 59 DOM
-
2026-06-12days on market $129,900 Active 58 DOM
-
2026-06-09days on market $129,900 Active 55 DOM
-
2026-06-08days on market $129,900 Active 54 DOM
-
2026-06-07days on market $129,900 Active 53 DOM
-
2026-06-07days on market $129,900 Active 52 DOM
-
2026-06-04days on market $129,900 Active 49 DOM
-
2026-06-02days on market $129,900 Active 48 DOM
-
2026-06-01days on market $129,900 Active 47 DOM
-
2026-05-31days on market $129,900 Active 46 DOM
-
2026-05-31days on market $129,900 Active 45 DOM
-
2026-04-15$129,900 Active 137-char remark
Show marketing remark (137 chars)
ONLY SELLING 1/3 INTEREST 200 ACRES HOUGHTON COUNTY FRONTAGE ON CABBAGE ROAD POWER AT ROAD NOT TO CAMP. FRONTAGE ON OTTER RIVER.
-
2026-04-15$129,900 Active 137-char remark
Show marketing remark (137 chars)
ONLY SELLING 1/3 INTEREST 200 ACRES HOUGHTON COUNTY FRONTAGE ON CABBAGE ROAD POWER AT ROAD NOT TO CAMP. FRONTAGE ON OTTER RIVER.
ⓘ Source: listings_history table (triggers on properties + properties_extension) + one-shot
backfill from property_details.listing_events for pre-trigger history.
Climate risk First Street
- Flood 9/10 Extreme 99% chance over 30 yrs
- Wildfire 2/10 Low
- Heat 1/10 Low 7 d/yr ≥93°F today · 12 d/yr by 30 yrs out
- Wind 1/10 Low
- Air quality 1/10 Low 0 unhealthy d/yr today · 0 by 30 yrs out
Nearby sold comps map
Loading sold comps map…
Walkable amenities ~0.75 mi
Loading nearby amenities…
Taxation est. · year 1
- Rental income
- $17,671
- − Mortgage interest
- −$7,276
- − Property taxes
- −$1,948
- − Insurance
- −$650
- − Repairs & maintenance
- −$1,414
- − Management
- −$1,414
- − Depreciation
- −$3,779
- Taxable income
- $1,190
- Est. tax owed @ 24.0%
- −$286
- After-tax cash flow
- $2,902/yr
For passive investors: Depreciation is non-cash, so a rental often shows a tax loss while cash-flowing — sheltering income. Rental losses are passive: they offset passive income freely, and up to $25,000/yr can offset ordinary (W-2) income if you actively participate and your MAGI is under $100k (phasing out to $0 by $150k); unused losses carry forward. On sale, claimed depreciation is recaptured at up to 25%, and gains may owe capital-gains tax (a 1031 exchange can defer both). Figures are a year-1 estimate at your 24.0% rate — not tax advice; consult a CPA.
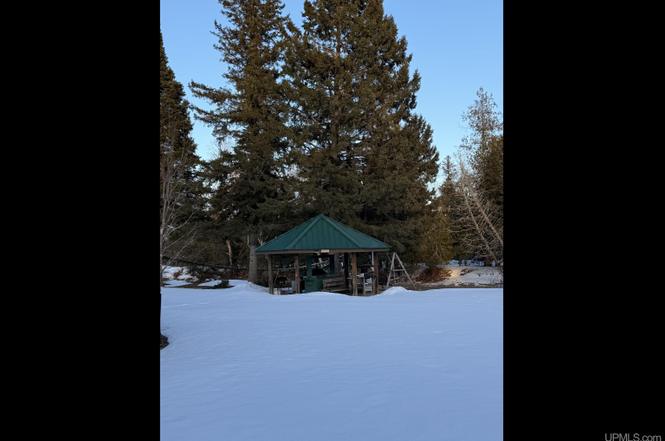
Condition & rehab AI · 1 photo
The property is in poor condition with extensive repairs and maintenance needed, including roof replacement and exterior repairs. Landscaping and curb appeal improvements would significantly enhance its value.
Repairs flagged
- Major roof — No visible roof in the satellite image.
- Major exterior — No visible exterior in the satellite image.
- Major flooring — No visible interior or exterior flooring in the satellite image.
- Major interior walls/paint — No visible interior walls or paint in the satellite image.
- Major systems — No visible systems in the satellite image.
Value-add opportunities
- Both landscaping and curb appeal — Improving the landscaping and curb appeal would enhance the property's visual appeal and potentially increase its value.
- Both roof replacement — Replacing the roof would improve the property's structural integrity and increase its value.
- Both exterior and interior repairs — Repairing the exterior and interior would make the property move-in ready and increase its value.
- Both HVAC and mechanical systems — Upgrading the HVAC and mechanical systems would improve the property's comfort and energy efficiency, increasing its value.
- Both landscaping and curb appeal — Improving the landscaping and curb appeal would enhance the property's visual appeal and potentially increase its value.
Renovation cost estimate screening
| Repair item | Severity | Est. cost |
|---|---|---|
| roof · No visible roof in the satellite image. | Major | $15,000–50,000 |
| exterior · No visible exterior in the satellite image. | Major | $15,000–50,000 |
| flooring · No visible interior or exterior flooring in the satellite image. | Major | $15,000–50,000 |
| interior walls/paint · No visible interior walls or paint in the satellite image. | Major | $15,000–50,000 |
| systems · No visible systems in the satellite image. | Major | $15,000–50,000 |
| Total estimated repair cost · 5 items | $75,000–250,000 |
Value-add ROI direction
- Both landscaping and curb appeal — Improving the landscaping and curb appeal would enhance the property's visual appeal and potentially increase its value. ↑
- Both roof replacement — Replacing the roof would improve the property's structural integrity and increase its value. ↑
- Both exterior and interior repairs — Repairing the exterior and interior would make the property move-in ready and increase its value. ↑
- Both HVAC and mechanical systems — Upgrading the HVAC and mechanical systems would improve the property's comfort and energy efficiency, increasing its value. ↑
- Both landscaping and curb appeal — Improving the landscaping and curb appeal would enhance the property's visual appeal and potentially increase its value. ↑
ⓘ Cost ranges are severity-bucket heuristics (US national rule-of-thumb). Get contractor quotes + a written scope before underwriting a rehab budget.
Schools (NCES district)
- District
- Baraga Area Schools
- NCES district ID
- 2603990
- Math proficiency
- 15% ▬ 0.00%
- Reading proficiency
- 35% ▲ 5.00%
- Median HH income
- $40,094
- Composite
- 24.11/100
- National rank
- #13159
- State rank
- #603 of 760 in MI
Livability — Portage
- Score
- 79/100
- State rank
- #90
- US rank
- #2044
Category grades
Schools grade is shown separately in the Schools card above.
Census & demographics
- City population
- 50,560
- Population (ZIP)
- 10,229
Population outlook (Houghton County) Hauer SSP2
- Today (2025)
- 35,073 people
- By 2030
- 34,645 · -1.2%
- By 2040
- 33,248 · -5.2%
- By 2050
- 31,625 · -9.8%
- By 2075
- 28,105 · -19.9%
- By 2100
- 23,274 · -33.6%
Race, ethnicity, and origin ACS 2023
- Neighborhood character
- Predominantly White (82%)
- Race & ethnicity
- White 82% Asian 7% Two or more races 3% Hispanic / Latino 3% Black 2% Native American 1%
- Common ancestry
- Italian 10% Romanian 8% Lithuanian 3%
- Foreign-born
- 13% · China, Canada
- Languages at home
- 85% English-only · Other Indo-European 5% Other Asian/Pacific 2% Chinese 2%
Political lean MEDSL · Houghton
- 2024 margin
- R (+17.0) · D 40.7% · R 57.7% · Other 1.6%
- 2008→2024 swing
- -13.1pp toward R · 2008: -3.9pp · 2024: -17.0pp
- All cycles
- 2024: R+17.0 2020: R+14.2 2016: R+15.7 2012: R+10.2 2008: R+3.9
Not yet ingested
- Civics
- —
Market trends
- HPI YoY
- ▼ -176.44%
- Current HPI
- 173.951
- Rent YoY
- —
- Metro
- —
- State GDP YoY
- ▲ 1.37%
- F500 in state
- 28
Industry mix (Fortune 500 HQ in MI)
| Industry | F500 HQs | Revenue |
|---|---|---|
| Automotive Parts | 3 | $48B |
|
||
| Automotive | 2 | $372B |
|
||
| Chemicals | 1 | $45B |
|
||
| Automotive Retail | 1 | $29B |
|
||
| Healthcare / Medical Devices | 1 | $23B |
|
||
| Automotive Technology | 1 | $20B |
|
||
Price history
+0.0% since first listed2 events — show timeline
- 2026-04-15 Listed $129,900 UPAR
- 2026-04-15 Listed $129,900 MiRealSource-MiMLS
Cash-flow waterfall
monthlySold comps — $/sqft
last 12 mo · ≤1 miLoading sold comps…