1980 Pedregal Dr · Bolivar Peninsula, TX
Flood risk No data
- FEMA flood zone
- —
- Chance of flooding over 30 yrs
- —
- Est. flood insurance / yr
- —
Fire risk No data
- Est. fire insurance / yr
- —
Heat risk No data
- Hot days now (above threshold)
- —
- Hot days in 30 yrs
- —
Wind risk No data
- Chance of severe wind over 30 yrs
- —
Air-quality risk No data
- Unhealthy air days now
- —
- Unhealthy air days in 30 yrs
- —
Risk factors via First Street. Map © Google.
Why this score? — see what drove the D+ grade
The composite is a weighted blend of 9 inputs, each scored 0–100. Each bar is that input's sub-score; the figure is the points it added to the 100-point composite (weight × sub-score).
- Cash flow +15.4/30.0
- ARV discount +8.5/15.0
- DSCR +4.7/10.0
- 1% rule +3.6/10.0
- Livability +3.2/5.0
- Schools +3.0/10.0
- Appreciation +2.7/10.0
- Rent growth +2.5/5.0
- Condition / age +2.5/5.0
$404,000
🖨 Deal sheet (PDF) 📄 Offer letter ✓ Due diligence
Listing remarks MLS
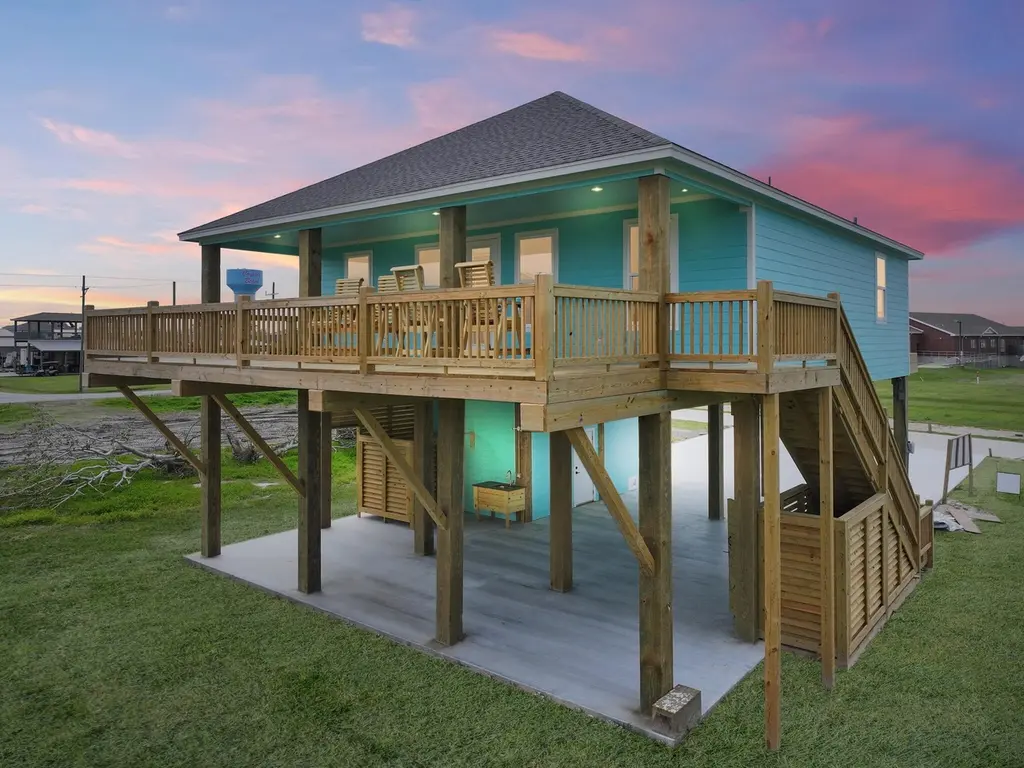
Recently built beach home offering a great 4-bedroom floor plan with 2 full baths, designed to maximize comfort and functionality. The open living, dining, and kitchen areas create an inviting space for gathering and entertaining, while the well-sized bedrooms provide flexibility for family, guests, or rental use. Located in Crystal Beach, this home supports a relaxed coastal lifestyle and is suitable as a primary residence, second home, or short-term rental property. Thoughtful design elements and quality craftsmanship by Prestige Custom Built contribute to long-term value and everyday livability, making this an attractive opportunity on the Bolivar Peninsula.
Key facts
- Beach home
- 7,248 sq ft lot
- Garage
Tags
Neighborhood map
What this means for you Summary
Snapshot
- This is a 4-bed/2.0-bath single-family listed at $404k.
Deal economics
- At list price, monthly cash flow is $154 ($2k/yr) — positive.
- The deal already cash-flows at list — no discount required.
- To meet the 1% rule (rent ≥ 1% of price), the offer needs to be $346k (14.3% below list).
- Recommended offer: $346k (14.3% below list) — sets the bar for 1% rule.
- Cap rate 6.7% vs local median 2.1% in Bolivar Peninsula — top-decile yield for the area; either an underpriced asset or a hidden risk that comps aren't pricing in. Stress-test before assuming the spread holds.
Location & tenants
- Location reads 65/100 on livability (#719 in TX) — a middle-class / working-renter tenant base. Strengths: crime A+, cost of living A+, housing A+; Watch: amenities F, commute F, health & safety F.
- Galveston ISD (town): math 33% / reading 39% proficiency, ranked #514 of 826 in TX (top 62%) — families likely to look elsewhere, expect single-tenant / working-renter base with shorter leases; 68% free/reduced lunch — lower-income household profile, screen leases tightly.
- Zoned schools: Oppe El (math 67% / reading 60%, grade B, #291 of 4,322 statewide, top 7%, 610 students, 63% FRL); Central Middle (math 18% / reading 21%, grade F, #1,445 of 1,662 statewide, top 88%, 879 students, 80% FRL); Ball H S (math 17% / reading 44%, grade F, #1,085 of 1,632 statewide, top 67%, 1,934 students, 73% FRL) — zoned schools at 72% FRL track the district average.
- Market conditions: 774 active listings in the ZIP; 4 comparable units currently listed for rent nearby; rentals leasing fast (median 1d on market — plan ~1-2 weeks tenant-placement turnaround); 3,258 units permitted in Galveston County in 2024 (0 in 5+ unit buildings).
Forward outlook
- Local home prices are declining (-3.0%/yr); year-one equity from $3k of loan paydown is wiped out by about $12k of value loss. Plan a longer hold.
- Galveston County population projected at +43% by 2050 — long-run rental-demand tailwind backs the buy-and-hold thesis.
Negotiation context
- It's been on market 112 days — a 9% lower offer ($368k) is reasonable based on typical stale-listing flexibility.
- 3 sale attempts since 2y ago; this cycle's ask has dropped $41k (9%) from the opening price — seller is motivated, your offer sets the floor, not the list.
Questions for the listing agent
- It's been on market 112 days. Have you received any prior offers? Is the seller open to a 14% concession, seller financing, or rate buy-down credit?
- What does the HOA fee cover, when was the last increase, and are there any pending special assessments or reserve-fund shortfalls?
- Why hasn't it sold? Are there any deal-killer items the seller is aware of (foundation, flood, title, zoning, code violations)?
- Is there a deadline driving the sale (1031 exchange, divorce, estate, relocation)? That informs how much negotiation room exists.
- Schools are D-rated, which usually means shorter tenancies and higher turnover. Who's the typical renter profile here, and what's been the actual vacancy rate?
- The area grade is low — what's the realistic commute time and amenity access for the typical tenant pool here? Any planned neighborhood developments (good or bad) we should know about?
- What's the average days-on-market for RENTAL listings here right now (not sales)? A rising rental-DOM trend means longer vacancies and softer asking-rent achievability than the comps imply.
- What's the recent tenant-quality profile in this submarket — average credit score on applications, eviction rate, late-payment / NSF rate, and stable-employment percentage? A property-management company in the area should have these aggregated.
- How much new for-sale + rental construction is in the pipeline within 1–3 miles? Heavy new supply typically softens prices + rents 12–24 months out; constrained supply supports both.
Investment metrics
- 1% rule
- 0.86% ✗
- Cap rate
- 6.75%
- Cash-on-cash
- 1.63%
- DSCR
- 1.07
- GRM
- 9.7
CMA / ARV
- ARV (median comp)
- $413,572
- List price
- $404,000
- Delta
- -2.31%
- Verdict
- FAIR
- Comps
- 20 within 1.0 mi
Show comp detail 12 sales within ~0.75 mi
| Address | Dist | Beds/Ba | Sqft | Sold | Price | $/sf | Match |
|---|---|---|---|---|---|---|---|
| 1984 Matt Dr | 0.16mi | 3/2.0 (-1) | 1,333 (-3%) | 4mo | $287,500 | $216 | 80 |
| 1990 Calypso | 0.09mi | 3/2.5 (-1) | 1,333 (-3%) | 10mo | $415,000 | $311 | 76 |
| 1981 Matt Dr | 0.12mi | 3/2.0 (-1) | 1,280 (-6%) | 10mo | $419,900 | $328 | 70 |
| 1781 S Croaker Ln W | 0.47mi | 3/2.0 (-1) | 1,380 (+1%) | 4mo | $420,000 | $304 | 68 |
| 1989 Matt Dr | 0.14mi | 3/2.0 (-1) | 1,200 (-12%) | 4mo | $249,000 | $208 | 65 |
| 938 Eastview | 0.25mi | 3/2.0 (-1) | 1,548 (+13%) | 2mo | $675,000 | $436 | 60 |
| 1855 Pompano Ln | 0.39mi | 3/3.0 (-1) | 1,457 (+6%) | 10mo | $495,000 | $340 | 53 |
| 2029 Idyle Vw | 0.40mi | 3/2.0 (-1) | 1,540 (+13%) | 3mo | $419,000 | $272 | 53 |
| 2281 E Lobster | 0.62mi | 3/2.0 (-1) | 1,332 (-3%) | 12mo | $450,000 | $338 | 52 |
| 888 Bowers Ln | 0.55mi | 3/2.0 (-1) | 1,462 (+7%) | 9mo | $469,000 | $321 | 50 |
| 2209 Shrimp | 0.66mi | 3/2.0 (-1) | 1,408 (+3%) | 12mo | $424,900 | $302 | 50 |
| 2288 E Crab St | 0.69mi | 3/2.5 (-1) | 1,489 (+9%) | 13mo | $438,000 | $294 | 35 |
Match score weights: distance 35% · size 25% · config 20% · recency 20%. Top-matched comps best support the ARV.
Projected returns pro-forma
-3.0% appreciation · 3.0% rent growth · sell at horizon
- IRR
- -13.7%
- Equity multiple
- 0.51×
- Total profit
- $-55,756
- Equity at exit
- $60,238
- IRR
- -4.9%
- Equity multiple
- 0.68×
- Total profit
- $-36,263
- Equity at exit
- $34,931
Cash invested: $113,120 (down + closing). Projections, not guarantees.
Landlord ↔ Tenant lean methodology
- Overall (STATE)
- 87 Strongly Landlord-Friendly
- State Texas
- 87 Strongly Landlord-Friendly · R+5
- County
- — inherits STATE
- City
- — inherits STATE
ZIP-level market 77650
- Home prices YoY
- -1.9%
- Active inventory
- 774
- Price-to-rent
- 9.7×
Monthly cashflow live
- Estimated rent
- $3,462 medium interval (Pro) →
- Mortgage (P&I)
- −$2,119
- Tax from tax record
- −$278 /mo · $3,331/yr
- Insurance
- −$168
- HOA
- −$17
- Vacancy / Maint / Mgmt
- −$727
- Net cashflow
- $154
Break-even live
Sensitivity live
| Price | -10% $382 | -5% $268 | +0% $154 | +5% $39 | +10% $-75 |
|---|---|---|---|---|---|
| Rent | -10% $-120 | -5% $17 | +0% $154 | +5% $290 | +10% $427 |
| Rate | -1.0pp $357 | -0.5pp $256 | base $154 | +0.5pp $49 | +1.0pp $-58 |
UW: 25.0% down · 7.5% · 30yr · 1.5% tax · 5.0% vac · 8.0% maint · 8.0% mgmt
Financing live
Cash to close
- Down payment
- $101,000
- Closing costs
- $12,120
- Reserves months
- —
- Total cash needed
- —
Loan-product check · same deal, 3 products live
Conventional
25% down · 7.5% · 30yr
- Down + closing
- —
- Monthly P&I
- —
- Monthly cashflow
- —
- DSCR
- —
- Eligible?
- —
Personal DTI + credit; lowest rate.
DSCR
20% down · 8.5% · 30yr
- Down + closing
- —
- Monthly P&I
- —
- Monthly cashflow
- —
- DSCR
- —
- Eligible?
- —
No personal income docs; deal must DSCR.
Hard money
10% down · 12.0% · 12mo
- Down + closing
- —
- Monthly P&I
- —
- Monthly cashflow
- —
- DSCR
- —
- Eligible?
- —
Short-term bridge; refi at stabilization.
Rent comps 4 comps
| Address | Beds | Baths | Sqft | Rent | $/sqft | DOM | Units | Dist |
|---|---|---|---|---|---|---|---|---|
| 951 Gulf Shores Dr Unit 1223252P Crystal Beach, TX | 3.0–6.0 | 2.0–5.0 | 2362 | $4,860 | $2.06 | 0d | 2 | 0.05mi |
| 943 Gulf Shores Dr Unit 1223244P Port Bolivar, TX | 3.0 | 3.0 | 1517 | $3,037 | $2.00 | 0d | 1 | 0.06mi |
| 1973 Avenue H Unit 1223251P Crystal Beach, TX | 3.0 | 2.0 | 1571 | $3,001 | $1.91 | 0d | 1 | 0.09mi |
| 820 Sandollar Unit 1351282P Crystal Beach, TX | 3.0 | 2.0 | 1539 | $3,077 | $2.00 | 0d | 1 | 1.41mi |
HOA detail
- Monthly dues
- $17 · $204/yr
Listing history 17 events
-
2026-06-15days on market $404,000 Pending 112 DOM
-
2026-06-13days on market $404,000 Pending 111 DOM
-
2026-06-09days on market $404,000 Pending 107 DOM
-
2026-06-08days on market $404,000 Pending 106 DOM
-
2026-06-07days on market $404,000 Pending 105 DOM
-
2026-06-04days on market $404,000 Pending 102 DOM
-
2026-06-03statusdays on market $404,000 Pending 101 DOM
-
2026-06-02days on market $404,000 Active 100 DOM
-
2026-06-01days on market $404,000 Active 99 DOM
-
2026-05-31days on market $404,000 Active 98 DOM
-
2026-02-22$445,000 Active 669-char remark
Show marketing remark (669 chars)
Recently built beach home offering a great 4-bedroom floor plan with 2 full baths, designed to maximize comfort and functionality. The open living, dining, and kitchen areas create an inviting space for gathering and entertaining, while the well-sized bedrooms provide flexibility for family, guests, or rental use. Located in Crystal Beach, this home supports a relaxed coastal lifestyle and is suitable as a primary residence, second home, or short-term rental property. Thoughtful design elements and quality craftsmanship by Prestige Custom Built contribute to long-term value and everyday livability, making this an attractive opportunity on the Bolivar Peninsula.
-
2025-03-11historical
-
2024-09-12$499,000 Active
-
2024-08-29historical
-
2024-04-30price $509,999
-
2024-02-29$530,000 Active
-
2024-02-27historical
ⓘ Source: listings_history table (triggers on properties + properties_extension) + one-shot
backfill from property_details.listing_events for pre-trigger history.
Tax reassessment forecast TX · Resets to sale price
- Current annual tax
- $3,331 · $278/mo
- Projected year-2 tax
- $7,393 · $616/mo
- Expected delta
- +$4,062/yr (+$339/mo · 121.9%)
ⓘ Screening estimate from a state-policy table — verify with the county assessor before closing.
Nearby sold comps map
Loading sold comps map…
Walkable amenities ~0.75 mi
Loading nearby amenities…
Taxation est. · year 1
- Rental income
- $41,547
- − Mortgage interest
- −$22,630
- − Property taxes
- −$3,331
- − Insurance
- −$2,020
- − Repairs & maintenance
- −$3,324
- − Management
- −$3,324
- − HOA
- −$204
- − Depreciation
- −$11,753
- Taxable loss
- −$5,038
- Est. tax savings @ 24.0%
- +$1,209
- After-tax cash flow
- $3,053/yr
For passive investors: Depreciation is non-cash, so a rental often shows a tax loss while cash-flowing — sheltering income. Rental losses are passive: they offset passive income freely, and up to $25,000/yr can offset ordinary (W-2) income if you actively participate and your MAGI is under $100k (phasing out to $0 by $150k); unused losses carry forward. On sale, claimed depreciation is recaptured at up to 25%, and gains may owe capital-gains tax (a 1031 exchange can defer both). Figures are a year-1 estimate at your 24.0% rate — not tax advice; consult a CPA.
Schools (NCES district)
- District
- Galveston ISD
- NCES district ID
- 4820280
- Math proficiency
- 33% ▼ -14.00%
- Reading proficiency
- 39% ▼ -4.00%
- Median HH income
- $40,162
- Composite
- 30.22/100
- National rank
- #6299
- State rank
- #514 of 826 in TX
Livability — Bolivar Peninsula
- Score
- 65/100
- State rank
- #719
- US rank
- #13437
Category grades
Schools grade is shown separately in the Schools card above.
Census & demographics
- Census place
- Bolivar Peninsula, TX
- City population
- 2,957
- Population (ZIP)
- 2,362
Population outlook (Galveston County) Hauer SSP2
- Today (2025)
- 390,640 people
- By 2030
- 425,226 · +8.9%
- By 2040
- 493,765 · +26.4%
- By 2050
- 559,698 · +43.3%
- By 2075
- 719,260 · +84.1%
- By 2100
- 819,628 · +109.8%
Race, ethnicity, and origin ACS 2023
- Neighborhood character
- Predominantly White (70%)
- Race & ethnicity
- White 70% Hispanic / Latino 21% Two or more races 10% Black 8%
- Hispanic origin (detail)
- Mexican 14%
- Common ancestry
- Lithuanian 6% Romanian 3% Iranian 3%
- Foreign-born
- 13% · Canada
- Languages at home
- 85% English-only · Spanish 14% German/W. Germanic 1%
Political lean MEDSL · Galveston
- 2024 margin
- Strong R (+27.4) · D 35.7% · R 63.1% · Other 1.2%
- 2008→2024 swing
- -7.9pp toward R · 2008: -19.5pp · 2024: -27.4pp
- All cycles
- 2024: R+27.4 2020: R+22.6 2016: R+22.6 2012: R+26.9 2008: R+19.5
Not yet ingested
- Civics
- —
Market trends
- HPI YoY
- ▼ -4.52%
- Current HPI
- 231.5074
- Rent YoY
- —
- Metro
- —
- State GDP YoY
- ▲ 3.95%
- F500 in state
- 110
Industry mix (Fortune 500 HQ in TX)
| Industry | F500 HQs | Revenue |
|---|---|---|
| Energy | 16 | $1,198B |
|
||
| Technology | 5 | $198B |
|
||
| Engineering / Construction | 4 | $72B |
|
||
| Energy Services | 3 | $60B |
|
||
| Utilities | 3 | $41B |
|
||
| Healthcare | 2 | $330B |
|
||
Price history
-16.0% since first listed7 events — show timeline
- 2026-02-22 Listed $445,000 HARMLS
- 2025-03-11 Listing Removed — HARMLS
- 2024-09-12 Listed $499,000 HARMLS
- 2024-08-29 Listing Removed — HARMLS
- 2024-04-30 Price Changed $509,999 HARMLS
- 2024-02-29 Listed $530,000 HARMLS
- 2024-02-27 Coming Soon — HARMLS
Property tax history
+128.5%/yrLatest (2025): $3,331 · +68.1% YoY. Source: county tax records.
Cash-flow waterfall
monthlySold comps — $/sqft
last 12 mo · ≤1 miLoading sold comps…