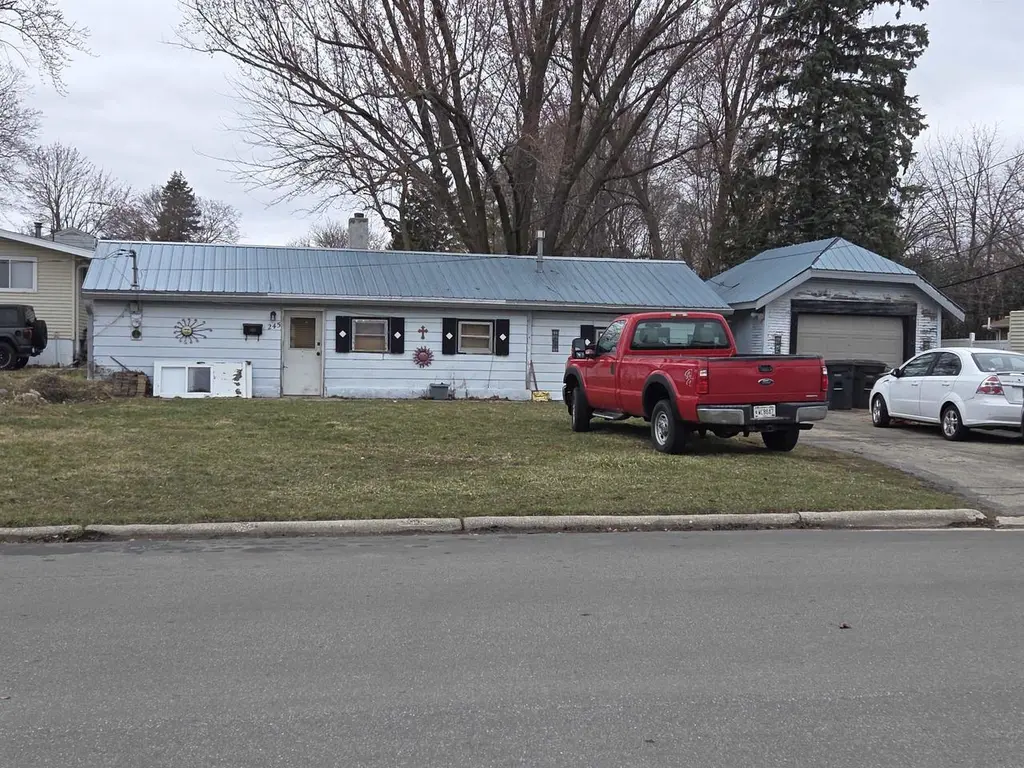
245 W Plymouth St · Jefferson, WI
Flood risk 1/10 · Minimal
- FEMA flood zone
- X (unshaded)
- Chance of flooding over 30 yrs
- 0.0%
- Est. flood insurance / yr
- $507 – $1,088
Fire risk 2/10 · Minimal
- Est. fire insurance / yr
- $636 – $1,182
Heat risk 2/10 · Minimal
- Hot days now (above 102°F)
- 7 days/yr
- Hot days in 30 yrs
- 13 days/yr
Wind risk 2/10 · Minimal
- Chance of severe wind over 30 yrs
- —
Air-quality risk 2/10 · Minimal
- Unhealthy air days now
- 1 days/yr
- Unhealthy air days in 30 yrs
- 1 days/yr
Risk factors via First Street. Map © Google.
Why this score? — see what drove the C- grade
The composite is a weighted blend of 9 inputs, each scored 0–100. Each bar is that input's sub-score; the figure is the points it added to the 100-point composite (weight × sub-score).
- Cash flow +17.1/30.0
- ARV discount +15.0/15.0
- 1% rule +5.7/10.0
- DSCR +5.3/10.0
- Livability +3.6/5.0
- Schools +3.1/10.0
- Rent growth +2.5/5.0
- Condition / age +2.5/5.0
- Appreciation +0.0/10.0
$105,000
🖨 Deal sheet 📄 Offer letter ✓ Due diligence
Listing remarks MLS
INVESTORS SPECIAL! Remodel or build on this nice corner lot! Could potentially be a rental property, or house flip. Being sold AS IS. Text or call today!
Key facts
- Corner lot
- 8,712 sq ft lot
- Garage
Tags
Neighborhood map
What this means for you Summary
Snapshot
- This is a 3-bed/1.0-bath single-family listed at $105k.
Deal economics
- At list price, monthly cash flow is $73 ($880/yr) — positive.
- The deal already cash-flows at list — no discount required.
- Meets the 1% rule at list price ($1k rent vs $105k).
- Recommended offer: $102k (3.0% below list) — sets the bar for market timing.
- Cap rate 7.1% vs local median 1.2% in Jefferson — top-decile yield for the area; either an underpriced asset or a hidden risk that comps aren't pricing in. Stress-test before assuming the spread holds.
Location & tenants
- Location reads 72/100 on livability (#243 in WI) — a middle-class / working-renter tenant base. Strengths: cost of living A+, housing A+, health & safety A; Watch: amenities F, commute F.
- Jefferson School District (town): math 35% / reading 36% proficiency, ranked #214 of 342 in WI (top 63%) — families likely to look elsewhere, expect single-tenant / working-renter base with shorter leases.
- Market conditions: 49 active listings in the ZIP; 145 units permitted in Jefferson County in 2024 (0 in 5+ unit buildings).
Forward outlook
- Local home prices are declining (-3.0%/yr); year-one equity from $726 of loan paydown is wiped out by about $3k of value loss. Plan a longer hold.
- Jefferson County population projected to shrink 6% by 2050 — rents likely to lag national; underwrite the cash flow, not the appreciation.
Negotiation context
- It's been on market 51 days — a 3% lower offer ($102k) is reasonable based on typical stale-listing flexibility.
- 2 sale attempts; this cycle's ask has dropped $14k (12%) from the opening price — seller is motivated, your offer sets the floor, not the list.
- Current owner paid $62k; list at $105k implies a 68% gain — meaningful room to come down on a strong offer.
Risks & watch-outs
- Watch-outs: property tax is 2.5% of price.
Questions for the listing agent
- It's been on market 51 days. Have you received any prior offers? Is the seller open to a 3% concession, seller financing, or rate buy-down credit?
- Property tax is high relative to price — has the assessment been appealed recently, and will the sale trigger a re-assessment?
- Is there a deadline driving the sale (1031 exchange, divorce, estate, relocation)? That informs how much negotiation room exists.
- What's the average days-on-market for RENTAL listings here right now (not sales)? A rising rental-DOM trend means longer vacancies and softer asking-rent achievability than the comps imply.
- What's the recent tenant-quality profile in this submarket — average credit score on applications, eviction rate, late-payment / NSF rate, and stable-employment percentage? A property-management company in the area should have these aggregated.
- How much new for-sale + rental construction is in the pipeline within 1–3 miles? Heavy new supply typically softens prices + rents 12–24 months out; constrained supply supports both.
Investment metrics
- 1% rule
- 1.07% ✓
- Cap rate
- 7.13%
- Cash-on-cash
- 2.99%
- DSCR
- 1.13
- GRM
- 7.8
CMA / ARV
- ARV (median comp)
- $128,905
- List price
- $105,000
- Delta
- -18.54%
- Verdict
- UNDERPRICED
- Comps
- 5 within 1.0 mi
Show comp detail 1 sale within ~0.75 mi
| Address | Dist | Beds/Ba | Sqft | Sold | Price | $/sf | Match |
|---|---|---|---|---|---|---|---|
| 245 W Plymouth St | 0.00mi | 3/1.0 | 680 (0%) | 1mo | $79,000 | $116 | 100 |
Match score weights: distance 35% · size 25% · config 20% · recency 20%. Top-matched comps best support the ARV.
Projected returns pro-forma
-3.0% appreciation · 3.0% rent growth · sell at horizon
- IRR
- -11.5%
- Equity multiple
- 0.58×
- Total profit
- $-12,271
- Equity at exit
- $15,656
- IRR
- -2.2%
- Equity multiple
- 0.85×
- Total profit
- $-4,375
- Equity at exit
- $9,078
Cash invested: $29,400 (down + closing). Projections, not guarantees.
Landlord ↔ Tenant lean methodology
- Overall (STATE)
- 73 Landlord-Friendly
- State Wisconsin
- 73 Landlord-Friendly · R+2
- County
- — inherits STATE
- City
- — inherits STATE
ZIP-level market 53549
- Active inventory
- 49
- Price-to-rent
- 7.8×
Monthly cashflow live
- Estimated rent
- $1,126 medium interval (Pro) →
- Mortgage (P&I)
- −$551
- Tax from tax record
- −$222 /mo · $2,664/yr
- Insurance
- −$44
- HOA
- −$0
- Vacancy / Maint / Mgmt
- −$237
- Net cashflow
- $73
Break-even live
UW: 25.0% down · 7.5% · 30yr · 1.5% tax · 5.0% vac · 8.0% maint · 8.0% mgmt
Financing live
Cash to close
- Down payment
- $26,250
- Closing costs
- $3,150
- Reserves months
- —
- Total cash needed
- —
Loan-product check · same deal, 3 products live
Conventional
25% down · 7.5% · 30yr
- Down + closing
- —
- Monthly P&I
- —
- Monthly cashflow
- —
- DSCR
- —
- Eligible?
- —
Personal DTI + credit; lowest rate.
DSCR
20% down · 8.5% · 30yr
- Down + closing
- —
- Monthly P&I
- —
- Monthly cashflow
- —
- DSCR
- —
- Eligible?
- —
No personal income docs; deal must DSCR.
Hard money
10% down · 12.0% · 12mo
- Down + closing
- —
- Monthly P&I
- —
- Monthly cashflow
- —
- DSCR
- —
- Eligible?
- —
Short-term bridge; refi at stabilization.
Listing history 7 events
-
2026-05-03status Pending 155-char remark
Show marketing remark (155 chars)
INVESTORS SPECIAL! Remodel or build on this nice corner lot! Could potentially be a rental property, or house flip. Being sold AS IS. Text or call today!
-
2026-04-10price $105,000 155-char remark
Show marketing remark (155 chars)
INVESTORS SPECIAL! Remodel or build on this nice corner lot! Could potentially be a rental property, or house flip. Being sold AS IS. Text or call today!
-
2026-04-03status Active 155-char remark
Show marketing remark (155 chars)
INVESTORS SPECIAL! Remodel or build on this nice corner lot! Could potentially be a rental property, or house flip. Being sold AS IS. Text or call today!
-
2026-04-01historical Offer Show 155-char remark
Show marketing remark (155 chars)
INVESTORS SPECIAL! Remodel or build on this nice corner lot! Could potentially be a rental property, or house flip. Being sold AS IS. Text or call today!
-
2026-03-13$119,000 Active 155-char remark
Show marketing remark (155 chars)
INVESTORS SPECIAL! Remodel or build on this nice corner lot! Could potentially be a rental property, or house flip. Being sold AS IS. Text or call today!
-
2001-11-26soldstatus $62,500
-
1998-11-18soldstatus $60,300
ⓘ Source: listings_history table (triggers on properties + properties_extension) + one-shot
backfill from property_details.listing_events for pre-trigger history.
Tax reassessment forecast WI · Partial reset (capped growth)
- Current annual tax
- $2,664 · $222/mo
- Projected year-2 tax
- $2,664 · $222/mo
- Expected delta
- $0/yr ($0/mo · 0.0%)
ⓘ Screening estimate from a state-policy table — verify with the county assessor before closing.
Climate risk First Street
- Flood 1/10 Low FEMA zone X (unshaded) · 0% chance over 30 yrs
- Wildfire 2/10 Low
- Heat 2/10 Low 7 d/yr ≥102°F today · 13 d/yr by 30 yrs out
- Wind 2/10 Low
- Air quality 2/10 Low 1 unhealthy d/yr today · 1 by 30 yrs out
Nearby sold comps map
Loading sold comps map…
Walkable amenities ~0.75 mi
Loading nearby amenities…
Taxation est. · year 1
- Rental income
- $13,514
- − Mortgage interest
- −$5,882
- − Property taxes
- −$2,664
- − Insurance
- −$525
- − Repairs & maintenance
- −$1,081
- − Management
- −$1,081
- − Depreciation
- −$3,055
- Taxable loss
- −$773
- Est. tax savings @ 24.0%
- +$185
- After-tax cash flow
- $1,066/yr
For passive investors: Depreciation is non-cash, so a rental often shows a tax loss while cash-flowing — sheltering income. Rental losses are passive: they offset passive income freely, and up to $25,000/yr can offset ordinary (W-2) income if you actively participate and your MAGI is under $100k (phasing out to $0 by $150k); unused losses carry forward. On sale, claimed depreciation is recaptured at up to 25%, and gains may owe capital-gains tax (a 1031 exchange can defer both). Figures are a year-1 estimate at your 24.0% rate — not tax advice; consult a CPA.
Schools (NCES district)
- District
- Jefferson School District
- NCES district ID
- 5507050
- Math proficiency
- 35% ▼ -5.00%
- Reading proficiency
- 36% ▼ -7.00%
- Median HH income
- $52,650
- Composite
- 31.02/100
- National rank
- #6091
- State rank
- #214 of 342 in WI
Livability — Jefferson
- Score
- 72/100
- State rank
- #243
- US rank
- #6354
Category grades
Schools grade is shown separately in the Schools card above.
Census & demographics
- Census place
- Jefferson, WI
- Population (ZIP)
- 9,901
Population outlook (Jefferson County) Hauer SSP2
- Today (2025)
- 86,617 people
- By 2030
- 86,818 · +0.2%
- By 2040
- 85,552 · -1.2%
- By 2050
- 81,765 · -5.6%
- By 2075
- 68,937 · -20.4%
- By 2100
- 55,854 · -35.5%
Race, ethnicity, and origin ACS 2023
- Neighborhood character
- Predominantly White (83%)
- Race & ethnicity
- White 83% Hispanic / Latino 12% Two or more races 5% Black 1%
- Hispanic origin (detail)
- Mexican 10% Puerto Rican 1%
- Common ancestry
- Portuguese 5% Romanian 4% Slovak 2%
- Foreign-born
- 3% · Canada
- Languages at home
- 93% English-only · Spanish 7%
Political lean MEDSL · Jefferson
- 2024 margin
- R (+16.4) · D 41.1% · R 57.5% · Other 1.4%
- 2008→2024 swing
- -17.2pp toward R · 2008: 0.8pp · 2024: -16.4pp
- All cycles
- 2024: R+16.4 2020: R+15.2 2016: R+16.2 2012: R+7.6 2008: D+0.8
Not yet ingested
- Civics
- —
Market trends
- HPI YoY
- ▼ -166.68%
- Current HPI
- 212.1903
- Rent YoY
- —
- Metro
- —
- State GDP YoY
- ▲ 2.10%
- F500 in state
- 20
Industry mix (Fortune 500 HQ in WI)
| Industry | F500 HQs | Revenue |
|---|---|---|
| Industrial Machinery | 4 | $23B |
|
||
| Industrial Technology | 2 | $36B |
|
||
| Insurance | 1 | $36B |
|
||
| Professional Services | 1 | $19B |
|
||
| Utilities | 1 | $9B |
|
||
| Consumer Goods | 1 | $3B |
|
||
Price history
+74.1% since first listed7 events — show timeline
- 2026-05-03 Pending — SCWMLS
- 2026-04-10 Price Changed $105,000 SCWMLS
- 2026-04-03 Relisted — SCWMLS
- 2026-04-01 Contingent — SCWMLS
- 2026-03-13 Listed $119,000 SCWMLS
- 2001-11-26 Sold (Public Records) $62,500 Public Records
- 1998-11-18 Sold (Public Records) $60,300 Public Records
Property tax history
+4.9%/yrLatest (2025): $2,664 · +8.2% YoY. Source: county tax records.
Cash-flow waterfall
monthlySold comps — $/sqft
last 12 mo · ≤1 miLoading sold comps…