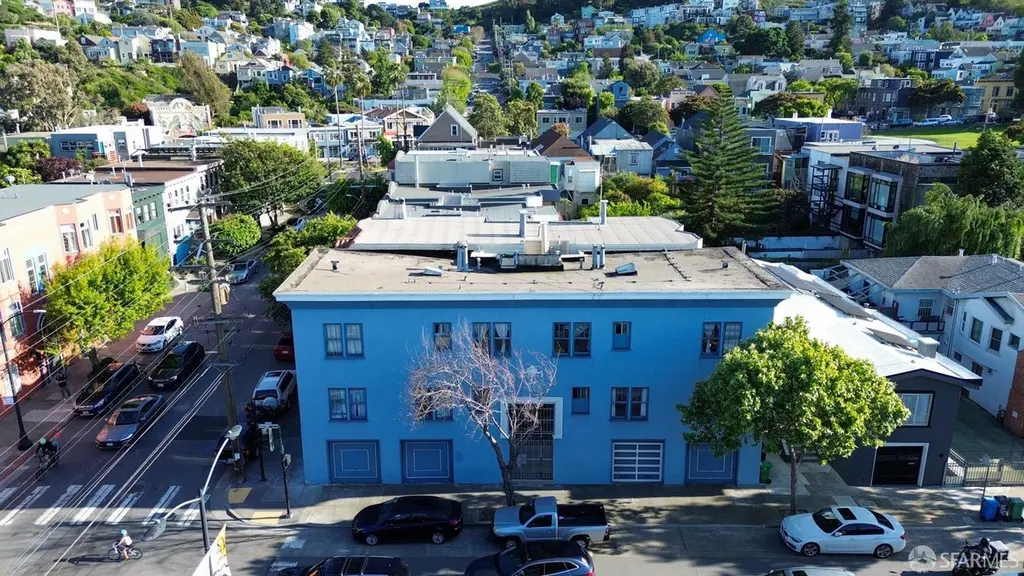
 Fourplex
3053-3059 Cesar Chavez · San Francisco, CA
Flood risk 6/10 · Moderate
- FEMA flood zone
- X (unshaded)
- Chance of flooding over 30 yrs
- 0.74%
- Est. flood insurance / yr
- $507 – $1,088
Fire risk 1/10 · Minimal
- Est. fire insurance / yr
- $659 – $1,223
Heat risk 2/10 · Minimal
- Hot days now (above 78°F)
- 8 days/yr
- Hot days in 30 yrs
- 18 days/yr
Wind risk 1/10 · Minimal
- Chance of severe wind over 30 yrs
- —
Air-quality risk 7/10 · Major
- Unhealthy air days now
- 13 days/yr
- Unhealthy air days in 30 yrs
- 13 days/yr
Risk factors via First Street. Map © Google.
Why this score? — see what drove the B- grade
The composite is a weighted blend of 9 inputs, each scored 0–100. Each bar is that input's sub-score; the figure is the points it added to the 100-point composite (weight × sub-score).
- Cash flow +29.2/30.0
- DSCR +10.0/10.0
- 1% rule +7.3/10.0
- ARV discount +5.7/15.0
- Rent growth +5.0/5.0
- Schools +5.0/10.0
- Livability +3.8/5.0
- Condition / age +2.5/5.0
- Appreciation +0.0/10.0
$1,498,000
🖨 Deal sheet (PDF) 📄 Offer letter ✓ Due diligence
Multi-family units
County records classify this as Multi-Family (5+ Unit). Listing-text estimate: 4 units. estimate disagrees with records
5+ unit building — per-unit beds/baths from public records are typically unavailable; the breakdown below (if shown) is an estimate from the listing text.
Listing remarks
Rare opportunity to own a beautiful 4-unit building, offered for the first time in over 48 years. Each unit is currently used as a 2-bedroom, 1-bath residence. Ideally located near Precita Park, schools, restaurants, cafes, and vibrant neighborhood amenities, this property sits at the crossroads of the Mission District and Bernal Heights offering a dynamic mix of residential charm, local commerce, and recreation with excellent walkability. Convenient access to public transportation and major freeways enhances everyday convenience. Two units will be delivered vacant, presenting immediate upside for market-rate rental income or owner-occupancy, while the remaining two units are tenant-occupie
Key facts
- Precita park
- Mission district
- Bernal heights
Tags
Property features AI
Finance
- Other: Living/building area reported as 3,500 square feet
- Financial info: 4 total units (quadruplex); 1 owner‑occupied unit; 2 units leased; 2 units month‑to‑month; 2 units vacant; 5 independent parking spaces
- HOA & community: No association fee
Exterior
- Parking: Attached garage with 5 parking spaces; 5 total parking spaces
- Security: Carbon monoxide detector(s)
- Utilities: City water; Public sewer; Natural gas connected with separate meter
- Home design: Residential income property (quadruplex); Three or more levels (3 stories); Original and updated/remodeled condition; Owner occupied unit present
- Construction: Built in 1921; Concrete, stucco, and wood construction; Concrete slab foundation
- Exterior features: Corner lot; Level topography
Interior
- Kitchen: Free‑standing gas range; Free‑standing refrigerator
- Bedrooms: 8 bedrooms total
- Flooring: Carpet; Tile
- Bathrooms: 4 full bathrooms
- Heating & cooling: Wall furnace heating; No central cooling
- Interior features: Formal entry; Full basement with storage space; Carbon monoxide detector(s)
- Laundry & utility: Laundry closet
Neighborhood map
What this means for you Summary
Snapshot
- This is a 4 × 2-bed/1.0-bath units multifamily listed at $1.50M.
Deal economics
- At list price, monthly cash flow is $5k ($63k/yr) — positive. Per door: $1k/mo.
- The deal already cash-flows at list — no discount required.
- Meets the 1% rule at list price ($18k rent vs $1.50M).
- Recommended offer: $1.45M (3.0% below list) — sets the bar for market timing.
- Cap rate 10.5% vs local median 2.1% in San Francisco — top-decile yield for the area; either an underpriced asset or a hidden risk that comps aren't pricing in. Stress-test before assuming the spread holds.
Location & tenants
- Location reads 76/100 on livability (#90 in CA, #3,143 nationally) — a middle-class / working-renter tenant base. Strengths: amenities A+, commute A+, employment A+; Watch: crime F, cost of living F.
- San Francisco Unified (urban): math 50% / reading 56% proficiency, ranked #322 of 1,400 in CA (top 23%) — acceptable for families but not a draw, mixed tenant base, ~2y average lease.
- Market conditions: Rents rising fast (+14.5%/yr); 161 active listings in the ZIP; 1 comparable units currently listed for rent nearby; high-income renter base; 750 units permitted in San Francisco County in 2024 (688 in 5+ unit buildings).
- At $18,375/mo this rent would consume 139% of the median local household income ($158k/yr) (locally 2732% of renters already pay >50% of income on rent) — very limited rent-growth headroom before tenants either downsize or default.
Forward outlook
- Local home prices are declining (-3.0%/yr); year-one equity from $10k of loan paydown is wiped out by about $45k of value loss. Plan a longer hold.
- San Francisco County population projected at +39% by 2050 — long-run rental-demand tailwind backs the buy-and-hold thesis.
- At projected returns (-3.0% appreciation + 8.0% rent growth), your $419k cash investment doubles in ~6 years — after that, you're playing with house money.
Negotiation context
- It's been on market 40 days — a 3% lower offer ($1.45M) is reasonable based on typical stale-listing flexibility.
- 2 sale attempts since 33y ago with the ask held roughly flat each time — persistent listings suggest the price (not the market) is what's stuck; bring a comps-based counter.
Risks & watch-outs
- Watch-outs: built in 1921 — expect roof / HVAC / electrical / plumbing capex.
- Climate carrying-cost: major flood risk — expect insurance premiums to compound above CPI over the hold.
Questions for the listing agent
- It's been on market 40 days. Have you received any prior offers? Is the seller open to a 3% concession, seller financing, or rate buy-down credit?
- Can we see the unit-by-unit rent roll, current vacancy, and any below-market leases? What's the average tenancy length?
- What capital expenditures (roof, boiler, parking lot, exteriors) have been made in the last 5 years, and what's planned in the next 2?
- Built in 1921 — when were the roof, HVAC, electrical panel, plumbing, and water heater last replaced?
- Is there a deadline driving the sale (1031 exchange, divorce, estate, relocation)? That informs how much negotiation room exists.
- Schools are B-rated — typically a magnet for longer-tenancy family renters. What's the average tenant stay here, and is there a school-zone premium baked into asking?
- Crime grade is F in this area — have there been break-ins, vandalism, or insurance claims at this property in the last 3 years? What carrier currently insures it and at what premium?
- What's the average days-on-market for RENTAL listings here right now (not sales)? A rising rental-DOM trend means longer vacancies and softer asking-rent achievability than the comps imply.
- What's the recent tenant-quality profile in this submarket — average credit score on applications, eviction rate, late-payment / NSF rate, and stable-employment percentage? A property-management company in the area should have these aggregated.
- How much new apartment / multifamily construction is in the pipeline within 1–3 miles? Heavy new supply (>2% of stock underway) typically softens rents 12–24 months out; light construction supports rent growth.
Investment metrics
- 1% rule
- 1.23% ✓
- Cap rate
- 10.47%
- Cash-on-cash
- 14.92%
- DSCR
- 1.66
- GRM
- 6.8
CMA / ARV
- ARV (median comp)
- $1,440,868
- List price
- $1,498,000
- Delta
- 3.97%
- Verdict
- FAIR
- Comps
- 20 within 1.0 mi
Show comp detail 6 sales within ~0.75 mi
| Address | Dist | Beds/Ba | Sqft | Sold | Price | $/sf | Match |
|---|---|---|---|---|---|---|---|
| 2773-2777 Bryant St | 0.18mi | 9/1.0 (+1) | 3,540 (+1%) | 10mo | $935,000 | $264 | 64 |
| 257-261 Andover St | 0.65mi | 8/3.0 | 3,377 (-4%) | 1mo | $1,535,000 | $455 | 59 |
| 759 Capp St | 0.54mi | 7/6.0 (-1) | 3,500 (0%) | 15mo | $905,000 | $259 | 49 |
| 2760-2762 Folsom St | 0.39mi | 7/3.0 (-1) | 3,750 (+7%) | 19mo | $1,932,125 | $515 | 45 |
| 275-279 San Jose Ave | 0.60mi | 7/4.0 (-1) | 3,132 (-10%) | 9mo | $1,470,000 | $469 | 42 |
| 2976-2978 21st St | 0.67mi | 7/2.0 (-1) | 3,105 (-11%) | 13mo | $1,250,000 | $403 | 26 |
Match score weights: distance 35% · size 25% · config 20% · recency 20%. Top-matched comps best support the ARV.
Projected returns pro-forma
-3.0% appreciation · 8.0% rent growth · sell at horizon
- IRR
- 10.6%
- Equity multiple
- 1.44×
- Total profit
- $186,160
- Equity at exit
- $223,357
- IRR
- 23.3%
- Equity multiple
- 3.46×
- Total profit
- $1,030,295
- Equity at exit
- $129,520
Cash invested: $419,440 (down + closing). Projections, not guarantees.
Landlord ↔ Tenant lean methodology
- Overall (CITY)
- 0 Strongly Tenant-Friendly
- State California
- 18 Strongly Tenant-Friendly · D+13
- County
- — inherits STATE
- City San Francisco
- 0 Strongly Tenant-Friendly · D+57
ZIP-level market 94110
- Rents YoY
- 14.5%
- Active inventory
- 161
- Price-to-rent
- 27.2×
Monthly cashflow live
- Estimated rent
- $18,375 high interval (Pro) →
- Mortgage (P&I)
- −$7,856
- Tax from tax record
- −$821 /mo · $9,854/yr
- Insurance
- −$624
- HOA
- −$0
- Vacancy / Maint / Mgmt
- −$3,859
- Net cashflow
- $5,215
Break-even live
Sensitivity live
| Price | -10% $6,063 | -5% $5,639 | +0% $5,215 | +5% $4,791 | +10% $4,367 |
|---|---|---|---|---|---|
| Rent | -10% $3,764 | -5% $4,489 | +0% $5,215 | +5% $5,941 | +10% $6,667 |
| Rate | -1.0pp $5,970 | -0.5pp $5,596 | base $5,215 | +0.5pp $4,827 | +1.0pp $4,432 |
4-unit breakdown (identical units grouped — click to expand)
| Units | Beds | Baths | Est. rent |
|---|---|---|---|
| 4× units | 2 | 1 | $18,376 |
| #1 | 2 | 1 | $4,594 |
| #2 | 2 | 1 | $4,594 |
| #3 | 2 | 1 | $4,594 |
| #4 | 2 | 1 | $4,594 |
| Total (4 units) | $18,375 | ||
UW: 25.0% down · 7.5% · 30yr · 1.5% tax · 5.0% vac · 8.0% maint · 8.0% mgmt
Financing live
Cash to close
- Down payment
- $374,500
- Closing costs
- $44,940
- Reserves months
- —
- Total cash needed
- —
Loan-product check · same deal, 3 products live
Conventional
25% down · 7.5% · 30yr
- Down + closing
- —
- Monthly P&I
- —
- Monthly cashflow
- —
- DSCR
- —
- Eligible?
- —
Personal DTI + credit; lowest rate.
DSCR
20% down · 8.5% · 30yr
- Down + closing
- —
- Monthly P&I
- —
- Monthly cashflow
- —
- DSCR
- —
- Eligible?
- —
No personal income docs; deal must DSCR.
Hard money
10% down · 12.0% · 12mo
- Down + closing
- —
- Monthly P&I
- —
- Monthly cashflow
- —
- DSCR
- —
- Eligible?
- —
Short-term bridge; refi at stabilization.
Rent comps 1 comps
| Address | Beds | Baths | Sqft | Rent | $/sqft | DOM | Units | Dist |
|---|---|---|---|---|---|---|---|---|
| 1520 Kirkwood Ave San Francisco, CA | 7.0 | 4.0 | 2863 | $8,500 | $2.97 | 44d | 1 | 1.43mi |
Listing history 10 events
-
2026-06-09days on market $1,498,000 Active 40 DOM
-
2026-06-08days on market $1,498,000 Active 39 DOM
-
2026-06-07days on market $1,498,000 Active 38 DOM
-
2026-06-04days on market $1,498,000 Active 35 DOM
-
2026-06-03days on market $1,498,000 Active 34 DOM
-
2026-06-02days on market $1,498,000 Active 33 DOM
-
2026-06-01days on market $1,498,000 Active 32 DOM
-
2026-05-31days on market $1,498,000 Active 31 DOM
-
2026-04-30$1,498,000 Active 932-char remark
-
1993-05-03$409,000
ⓘ Source: listings_history table (triggers on properties + properties_extension) + one-shot
backfill from property_details.listing_events for pre-trigger history.
Tax reassessment forecast CA · Resets to sale price
- Current annual tax
- $9,854 · $821/mo
- Projected year-2 tax
- $11,385 · $949/mo
- Expected delta
- +$1,531/yr (+$128/mo · 15.5%)
ⓘ Screening estimate from a state-policy table — verify with the county assessor before closing.
Climate risk First Street
- Flood 6/10 Major FEMA zone X (unshaded) · 74% chance over 30 yrs
- Wildfire 1/10 Low
- Heat 2/10 Low 8 d/yr ≥78°F today · 18 d/yr by 30 yrs out
- Wind 1/10 Low
- Air quality 7/10 Severe 13 unhealthy d/yr today · 13 by 30 yrs out
Nearby sold comps map
Loading sold comps map…
Walkable amenities ~0.75 mi
Loading nearby amenities…
Taxation est. · year 1
- Rental income
- $220,500
- − Mortgage interest
- −$83,911
- − Property taxes
- −$9,854
- − Insurance
- −$7,490
- − Repairs & maintenance
- −$17,640
- − Management
- −$17,640
- − Depreciation
- −$43,578
- Taxable income
- $40,387
- Est. tax owed @ 24.0%
- −$9,693
- After-tax cash flow
- $52,890/yr
For passive investors: Depreciation is non-cash, so a rental often shows a tax loss while cash-flowing — sheltering income. Rental losses are passive: they offset passive income freely, and up to $25,000/yr can offset ordinary (W-2) income if you actively participate and your MAGI is under $100k (phasing out to $0 by $150k); unused losses carry forward. On sale, claimed depreciation is recaptured at up to 25%, and gains may owe capital-gains tax (a 1031 exchange can defer both). Figures are a year-1 estimate at your 24.0% rate — not tax advice; consult a CPA.
Schools (NCES district)
- District
- San Francisco Unified
- NCES district ID
- 0634410
- Math proficiency
- 50% ▬ 0.00%
- Reading proficiency
- 56% ▲ 1.00%
- Median HH income
- $81,249
- Composite
- 50.14/100
- National rank
- #4088
- State rank
- #322 of 1400 in CA
Livability — San Francisco
- Score
- 76/100
- State rank
- #90
- US rank
- #3143
Category grades
Schools grade is shown separately in the Schools card above.
Census & demographics
- Census place
- San Francisco, CA
- County
- San Francisco County · 827,552 people
- City population
- 827,552
- Metro
- San Francisco-Oakland-Berkeley, CA
- Population (ZIP)
- 66,865
- Household income
- $158,351
- Rent vs Own
- Severe rent burden
- 2732.0
Population outlook (San Francisco County) Hauer SSP2
- Today (2025)
- 1,030,936 people
- By 2030
- 1,110,409 · +7.7%
- By 2040
- 1,270,010 · +23.2%
- By 2050
- 1,435,001 · +39.2%
- By 2075
- 1,779,074 · +72.6%
- By 2100
- 1,966,767 · +90.8%
Race, ethnicity, and origin ACS 2023
- Neighborhood character
- Highly diverse neighborhood (Simpson 0.70)
- Race & ethnicity
- White 41% Hispanic / Latino 32% Asian 16% Two or more races 15% Black 4% Native American 1%
- Hispanic origin (detail)
- Mexican 16% Puerto Rican 1%
- Common ancestry
- Lithuanian 3% Italian 2% Romanian 2%
- Foreign-born
- 28% · Canada, China, Vietnam
- Languages at home
- 58% English-only · Spanish 27% Chinese 5% Other Indo-European 2%
Political lean MEDSL · San Francisco
- 2024 margin
- Solid D (+64.8) · D 80.3% · R 15.5% · Other 4.1%
- 2008→2024 swing
- -5.7pp toward R · 2008: 70.5pp · 2024: 64.8pp
- All cycles
- 2024: D+64.8 2020: D+72.5 2016: D+76.1 2012: D+70.2 2008: D+70.5
Not yet ingested
- Civics
- —
Market trends
- HPI YoY
- ▼ -1385.62%
- Current HPI
- 267.2424
- Rent YoY
- ▲ 14.54%
- Metro
- San Francisco-Oakland-Berkeley, CA
- State GDP YoY
- ▲ 3.21%
- F500 in state
- 116
Industry mix (Fortune 500 HQ in CA)
| Industry | F500 HQs | Revenue |
|---|---|---|
| Technology | 27 | $1,492B |
|
||
| Financial Services | 3 | $174B |
|
||
| Retail | 3 | $44B |
|
||
| Insurance | 3 | $26B |
|
||
| Media / Entertainment | 2 | $115B |
|
||
| Pharmaceuticals / Biotech | 2 | $62B |
|
||
Price history
+266.3% since first listed2 events — show timeline
- 2026-04-30 Listed $1,498,000 San Francisco MLS
- 1993-05-03 Listed $409,000 San Francisco MLS
Property tax history
+2.2%/yrLatest (2025): $9,854 · +3.1% YoY. Source: county tax records.
Cash-flow waterfall
monthlySold comps — $/sqft
last 12 mo · ≤1 miLoading sold comps…