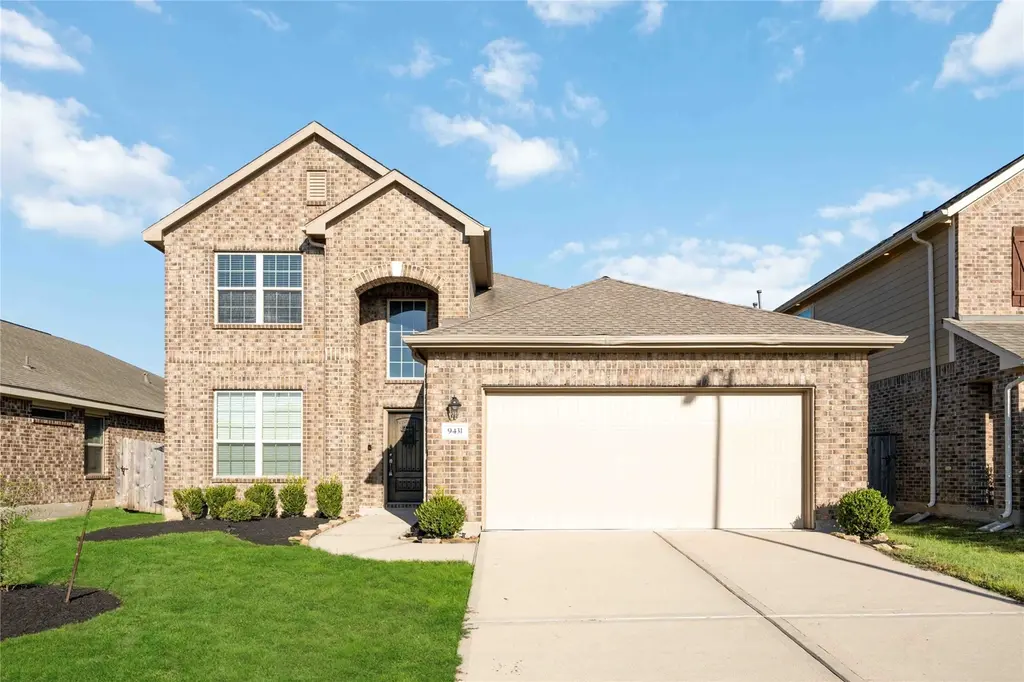
9431 Summer River Dr · Houston, TX
Flood risk 1/10 · Minimal
- FEMA flood zone
- X (unshaded)
- Chance of flooding over 30 yrs
- 0.0%
- Est. flood insurance / yr
- $507 – $1,088
Fire risk 4/10 · Minor
- Est. fire insurance / yr
- $1,222 – $2,270
Heat risk 9/10 · Severe
- Hot days now (above 111°F)
- 7 days/yr
- Hot days in 30 yrs
- 23 days/yr
Wind risk 9/10 · Severe
- Chance of severe wind over 30 yrs
- 99.0%
Air-quality risk 2/10 · Minimal
- Unhealthy air days now
- 1 days/yr
- Unhealthy air days in 30 yrs
- 1 days/yr
Risk factors via First Street. Map © Google.
Why this score? — see what drove the D- grade
The composite is a weighted blend of 9 inputs, each scored 0–100. Each bar is that input's sub-score; the figure is the points it added to the 100-point composite (weight × sub-score).
- ARV discount +10.5/15.0
- Cash flow +9.2/30.0
- Schools +4.6/10.0
- 1% rule +4.0/10.0
- Livability +3.7/5.0
- DSCR +2.6/10.0
- Condition / age +2.5/5.0
- Rent growth +2.1/5.0
- Appreciation +0.0/10.0
$339,000
🖨 Deal sheet (PDF) 📄 Offer letter ✓ Due diligence
Key facts
- 6,259 sq ft lot
- 2 garage spots
- Community pool
Property features AI
Finance
- Other: Lease considered: No
- HOA & community: Homeowners association (VanMor) with annual fee of $936
Exterior
- Parking: Attached 2-car garage
- Utilities: Public water; Public sewer
- Home design: Residential property; Built in 2018; Slab foundation
- Construction: Brick construction; Composition roof
- Exterior features: Subdivision lot; Community pool
Interior
- Kitchen: Dishwasher; Garbage disposal; Microwave
- Bedrooms: Primary bedroom on first floor (large); Additional bedrooms on second floor
- Bathrooms: 2 full bathrooms; 1 half bathroom
- Heating & cooling: Central heating (gas); Central electric air conditioning
- Interior features: Granite counters; Game room; Dining room; Living room
Neighborhood map
What this means for you Summary
Snapshot
- This is a 4-bed/3.0-bath single-family listed at $339k.
Deal economics
- At list price, monthly cash flow is $-253 ($-3k/yr) — negative.
- To cash-flow at today's rent, offer at most $294k (13.2% below list).
- To meet the 1% rule (rent ≥ 1% of price), the offer needs to be $306k (9.8% below list).
- Recommended offer: $294k (13.2% below list) — sets the bar for cash-flow.
- Cap rate 5.4% vs local median 3.2% in Houston — top-decile yield for the area; either an underpriced asset or a hidden risk that comps aren't pricing in. Stress-test before assuming the spread holds.
Location & tenants
- Location reads 74/100 on livability (#184 in TX, #4,771 nationally) — a middle-class / working-renter tenant base. Strengths: amenities A+, cost of living A+, housing A+; Watch: crime F.
- Lamar CISD (suburban): math 50% / reading 53% proficiency, ranked #116 of 826 in TX (top 14%) — acceptable for families but not a draw, mixed tenant base, ~2y average lease.
- Zoned schools: Joe Hubenak El (math 57% / reading 61%, grade B-, #455 of 4,322 statewide, top 11%, 1,214 students, 37% FRL); Briscoe J H (math 59% / reading 60%, grade B, #166 of 1,662 statewide, top 11%, 1,914 students, 38% FRL); Foster H S (math 64% / reading 74%, grade B, #141 of 1,632 statewide, top 9%, 2,388 students, 34% FRL).
- Market conditions: Rents soft (-1.6%/yr); 1238 active listings in the ZIP; 2 comparable units currently listed for rent nearby; high-income renter base; 12,093 units permitted in Fort Bend County in 2024 (815 in 5+ unit buildings).
Forward outlook
- Local home prices are declining (-3.0%/yr); year-one equity from $2k of loan paydown is wiped out by about $10k of value loss. Plan a longer hold.
- Fort Bend County population projected at +75% by 2050 — long-run rental-demand tailwind backs the buy-and-hold thesis.
Negotiation context
- It's been on market 43 days — a 3% lower offer ($329k) is reasonable based on typical stale-listing flexibility.
- 10 sale attempts since 2y ago with the ask held roughly flat each time — persistent listings suggest the price (not the market) is what's stuck; bring a comps-based counter.
Risks & watch-outs
- Climate carrying-cost: severe wind risk, 99% chance of damaging wind over 30y; extreme-heat days projected 7→23/yr by 2055 (HVAC capex compounding) — expect insurance premiums to compound above CPI over the hold.
Questions for the listing agent
- What do current leases actually rent for vs. the listed asking? Can we see a recent rent roll and the last 12 months of T-12 income?
- It's been on market 43 days. Have you received any prior offers? Is the seller open to a 13% concession, seller financing, or rate buy-down credit?
- What does the HOA fee cover, when was the last increase, and are there any pending special assessments or reserve-fund shortfalls?
- Is there a deadline driving the sale (1031 exchange, divorce, estate, relocation)? That informs how much negotiation room exists.
- Schools are D-rated, which usually means shorter tenancies and higher turnover. Who's the typical renter profile here, and what's been the actual vacancy rate?
- Crime grade is F in this area — have there been break-ins, vandalism, or insurance claims at this property in the last 3 years? What carrier currently insures it and at what premium?
- The area grade is low — what's the realistic commute time and amenity access for the typical tenant pool here? Any planned neighborhood developments (good or bad) we should know about?
- What's the average days-on-market for RENTAL listings here right now (not sales)? A rising rental-DOM trend means longer vacancies and softer asking-rent achievability than the comps imply.
- What's the recent tenant-quality profile in this submarket — average credit score on applications, eviction rate, late-payment / NSF rate, and stable-employment percentage? A property-management company in the area should have these aggregated.
- How much new for-sale + rental construction is in the pipeline within 1–3 miles? Heavy new supply typically softens prices + rents 12–24 months out; constrained supply supports both.
Investment metrics
- 1% rule
- 0.90% ✗
- Cap rate
- 5.40%
- Cash-on-cash
- -3.20%
- DSCR
- 0.86
- GRM
- 9.2
CMA / ARV
- ARV (median comp)
- $363,251
- List price
- $339,000
- Delta
- -6.68%
- Verdict
- FAIR
- Comps
- 20 within 1.0 mi
Show comp detail 12 sales within ~0.75 mi
| Address | Dist | Beds/Ba | Sqft | Sold | Price | $/sf | Match |
|---|---|---|---|---|---|---|---|
| 9410 Greensbend Dr | 0.10mi | 4/3.0 | 2,246 (-0%) | 2mo | $365,000 | $163 | 93 |
| 9426 Alpine Cove Dr | 0.03mi | 4/2.0 | 2,286 (+1%) | 9mo | $395,000 | $173 | 85 |
| 26311 Cloverbank Ln | 0.19mi | 4/3.0 | 2,368 (+5%) | 2mo | $400,000 | $169 | 82 |
| 26110 Lazywaters Dr | 0.07mi | 4/3.5 | 2,509 (+11%) | 0mo | $415,000 | $165 | 76 |
| 9414 Summer River Dr | 0.04mi | 3/2.0 (-1) | 2,078 (-8%) | 3mo | $349,500 | $168 | 73 |
| 9422 Alpine Cove Dr | 0.04mi | 3/2.0 (-1) | 2,006 (-11%) | 4mo | $339,000 | $169 | 67 |
| 9630 Dancing Grass Dr | 0.18mi | 4/3.5 | 2,511 (+11%) | 7mo | $450,000 | $179 | 65 |
| 9847 Copper Ranch Trl | 0.42mi | 4/2.5 | 2,359 (+5%) | 11mo | $345,000 | $146 | 62 |
| 9726 Dancing Grass Dr | 0.25mi | 3/2.0 (-1) | 1,990 (-12%) | 7mo | $400,000 | $201 | 54 |
| 342 Shining Succulent Dr | 0.74mi | 4/3.5 | 2,392 (+6%) | 6mo | $399,900 | $167 | 48 |
| 26030 Drover Sky Ct | 0.53mi | 3/2.5 (-1) | 1,926 (-15%) | 9mo | $320,000 | $166 | 36 |
| 8623 Gleaming Village Way | 0.73mi | 3/2.5 (-1) | 1,988 (-12%) | 11mo | $449,772 | $226 | 30 |
Match score weights: distance 35% · size 25% · config 20% · recency 20%. Top-matched comps best support the ARV.
Projected returns pro-forma
-3.0% appreciation · 0.0% rent growth · sell at horizon
- IRR
- -25.5%
- Equity multiple
- 0.16×
- Total profit
- $-79,766
- Equity at exit
- $50,546
- IRR
- -38.2%
- Equity multiple
- -0.30×
- Total profit
- $-123,843
- Equity at exit
- $29,311
Cash invested: $94,920 (down + closing). Projections, not guarantees.
Landlord ↔ Tenant lean methodology
- Overall (STATE)
- 87 Strongly Landlord-Friendly
- State Texas
- 87 Strongly Landlord-Friendly · R+5
- County
- — inherits STATE
- City
- — inherits STATE
ZIP-level market 77406
- Home prices YoY
- -26.2%
- Rents YoY
- -1.6%
- Active inventory
- 1238
- Price-to-rent
- 9.2×
Monthly cashflow live
- Estimated rent
- $3,057 medium interval (Pro) →
- Mortgage (P&I)
- −$1,778
- Tax from tax record
- −$671 /mo · $8,057/yr
- Insurance
- −$141
- HOA
- −$78
- Vacancy / Maint / Mgmt
- −$642
- Net cashflow
- $-253
Break-even live
Sensitivity live
| Price | -10% $-61 | -5% $-157 | +0% $-253 | +5% $-349 | +10% $-445 |
|---|---|---|---|---|---|
| Rent | -10% $-495 | -5% $-374 | +0% $-253 | +5% $-132 | +10% $-12 |
| Rate | -1.0pp $-82 | -0.5pp $-167 | base $-253 | +0.5pp $-341 | +1.0pp $-430 |
UW: 25.0% down · 7.5% · 30yr · 1.5% tax · 5.0% vac · 8.0% maint · 8.0% mgmt
Financing live
Cash to close
- Down payment
- $84,750
- Closing costs
- $10,170
- Reserves months
- —
- Total cash needed
- —
Loan-product check · same deal, 3 products live
Conventional
25% down · 7.5% · 30yr
- Down + closing
- —
- Monthly P&I
- —
- Monthly cashflow
- —
- DSCR
- —
- Eligible?
- —
Personal DTI + credit; lowest rate.
DSCR
20% down · 8.5% · 30yr
- Down + closing
- —
- Monthly P&I
- —
- Monthly cashflow
- —
- DSCR
- —
- Eligible?
- —
No personal income docs; deal must DSCR.
Hard money
10% down · 12.0% · 12mo
- Down + closing
- —
- Monthly P&I
- —
- Monthly cashflow
- —
- DSCR
- —
- Eligible?
- —
Short-term bridge; refi at stabilization.
Rent comps 2 comps
| Address | Beds | Baths | Sqft | Rent | $/sqft | DOM | Units | Dist |
|---|---|---|---|---|---|---|---|---|
| 10503 Shinning Dawn Way Richmond, TX | 4.0 | 3.5 | 2523 | $3,399 | $1.35 | 45d | 1 | 0.99mi |
| 26407 Polaris Rise Ln Richmond, TX | 4.0 | 3.5 | 3260 | $3,750 | $1.15 | 45d | 1 | 1.40mi |
HOA detail
- Monthly dues
- $78 · $936/yr
Listing history 37 events
-
2026-06-21days on market $339,000 Active 43 DOM
-
2026-06-18days on market $339,000 Active 40 DOM
-
2026-06-17days on market $339,000 Active 39 DOM
-
2026-06-16days on market $339,000 Active 38 DOM
-
2026-06-15days on market $339,000 Active 37 DOM
-
2026-06-13days on market $339,000 Active 35 DOM
-
2026-06-09days on market $339,000 Active 31 DOM
-
2026-06-08days on market $339,000 Active 30 DOM
-
2026-06-07days on market $339,000 Active 29 DOM
-
2026-06-04days on market $339,000 Active 26 DOM
-
2026-06-03days on market $339,000 Active 25 DOM
-
2026-06-02days on market $339,000 Active 24 DOM
-
2026-06-01days on market $339,000 Active 23 DOM
-
2026-05-31days on market $339,000 Active 22 DOM
-
2026-05-09$339,000 Active
-
2026-05-06historical
-
2026-03-11$339,000 Active
-
2026-03-09historical $2,500
-
2026-02-19$2,500
-
2026-02-17historical $2,500
-
2025-12-11$2,500
-
2025-12-10historical
-
2025-10-26price $345,000
-
2025-09-18$365,000 Active
-
2025-01-06historical $2,400
-
2025-01-05historical
-
2024-11-25price $2,400
-
2024-11-03$2,600
-
2024-09-21price $368,000
-
2024-08-30$373,000 Active
-
2024-08-16historical
-
2024-06-14$360,000 Active
-
2024-06-13historical
-
2024-05-09$382,000 Active
-
2024-05-07historical
-
2024-05-03price $392,000
-
2024-03-22$405,900 Active
ⓘ Source: listings_history table (triggers on properties + properties_extension) + one-shot
backfill from property_details.listing_events for pre-trigger history.
Tax reassessment forecast TX · Resets to sale price
- Current annual tax
- $8,057 · $671/mo
- Projected year-2 tax
- $8,057 · $671/mo
- Expected delta
- $0/yr ($0/mo · 0.0%)
ⓘ Screening estimate from a state-policy table — verify with the county assessor before closing.
Climate risk First Street
- Flood 1/10 Low FEMA zone X (unshaded) · 0% chance over 30 yrs
- Wildfire 4/10 Moderate
- Heat 9/10 Extreme 7 d/yr ≥111°F today · 23 d/yr by 30 yrs out
- Wind 9/10 Extreme 99% chance of damaging wind over 30 yrs
- Air quality 2/10 Low 1 unhealthy d/yr today · 1 by 30 yrs out
Nearby sold comps map
Loading sold comps map…
Walkable amenities ~0.75 mi
Loading nearby amenities…
Taxation est. · year 1
- Rental income
- $36,689
- − Mortgage interest
- −$18,989
- − Property taxes
- −$8,057
- − Insurance
- −$1,695
- − Repairs & maintenance
- −$2,935
- − Management
- −$2,935
- − HOA
- −$936
- − Depreciation
- −$9,862
- Taxable loss
- −$8,721
- Est. tax savings @ 24.0%
- +$2,093
- After-tax cash flow
- $-944/yr
For passive investors: Depreciation is non-cash, so a rental often shows a tax loss while cash-flowing — sheltering income. Rental losses are passive: they offset passive income freely, and up to $25,000/yr can offset ordinary (W-2) income if you actively participate and your MAGI is under $100k (phasing out to $0 by $150k); unused losses carry forward. On sale, claimed depreciation is recaptured at up to 25%, and gains may owe capital-gains tax (a 1031 exchange can defer both). Figures are a year-1 estimate at your 24.0% rate — not tax advice; consult a CPA.
Schools (NCES district)
- District
- Lamar CISD
- NCES district ID
- 4826580
- Math proficiency
- 50% ▼ -12.00%
- Reading proficiency
- 53% ▼ -4.00%
- Median HH income
- $75,213
- Composite
- 46.43/100
- National rank
- #2452
- State rank
- #116 of 826 in TX
Livability — Houston
- Score
- 74/100
- State rank
- #184
- US rank
- #4771
Category grades
Schools grade is shown separately in the Schools card above.
Census & demographics
- County
- Fort Bend County · 836,777 people
- City population
- 3,226,434
- Metro
- Houston-The Woodlands-Sugar Land, TX
- Population (ZIP)
- 69,918
- Household income
- $141,869
- Rent vs Own
- Severe rent burden
- 575.0
Population outlook (Fort Bend County) Hauer SSP2
- Today (2025)
- 1,004,526 people
- By 2030
- 1,153,104 · +14.8%
- By 2040
- 1,453,718 · +44.7%
- By 2050
- 1,753,781 · +74.6%
- By 2075
- 2,455,772 · +144.5%
- By 2100
- 2,930,528 · +191.7%
Race, ethnicity, and origin ACS 2023
- Neighborhood character
- Highly diverse neighborhood (Simpson 0.72)
- Race & ethnicity
- White 43% Hispanic / Latino 26% Two or more races 15% Black 14% Asian 12%
- Hispanic origin (detail)
- Mexican 18% Puerto Rican 1%
- Common ancestry
- Lithuanian 2% Romanian 1% Iranian 1%
- Foreign-born
- 17% · Canada, Vietnam, China
- Languages at home
- 73% English-only · Spanish 14% Other Indo-European 3% Vietnamese 2%
Political lean MEDSL · Fort Bend
- 2024 margin
- Toss-up / Even · D 49.5% · R 47.9% · Other 2.6%
- 2008→2024 swing
- +4.0pp toward D · 2008: -2.4pp · 2024: 1.6pp
- All cycles
- 2024: D+1.6 2020: D+10.6 2016: D+6.6 2012: R+6.8 2008: R+2.4
Not yet ingested
- Civics
- —
Market trends
- HPI YoY
- ▼ -79.18%
- Current HPI
- 222.9525
- Rent YoY
- ▼ -1.61%
- Metro
- Houston-The Woodlands-Sugar Land, TX
- State GDP YoY
- ▲ 3.95%
- F500 in state
- 110
Industry mix (Fortune 500 HQ in TX)
| Industry | F500 HQs | Revenue |
|---|---|---|
| Energy | 16 | $1,198B |
|
||
| Technology | 5 | $198B |
|
||
| Engineering / Construction | 4 | $72B |
|
||
| Energy Services | 3 | $60B |
|
||
| Utilities | 3 | $41B |
|
||
| Healthcare | 2 | $330B |
|
||
Price history
-16.5% since first listed23 events — show timeline
- 2026-05-09 Listed $339,000 HARMLS
- 2026-05-06 Listing Removed — HARMLS
- 2026-03-11 Listed $339,000 HARMLS
- 2026-03-09 Rental Removed $2,500 HARMLS
- 2026-02-19 Listed for Rent $2,500 HARMLS
- 2026-02-17 Rental Removed $2,500 HARMLS
- 2025-12-11 Listed for Rent $2,500 HARMLS
- 2025-12-10 Listing Removed — HARMLS
- 2025-10-26 Price Changed $345,000 HARMLS
- 2025-09-18 Listed $365,000 HARMLS
- 2025-01-06 Rental Removed $2,400 HARMLS
- 2025-01-05 Listing Removed — HARMLS
- 2024-11-25 Price Changed $2,400 HARMLS
- 2024-11-03 Listed for Rent $2,600 HARMLS
- 2024-09-21 Price Changed $368,000 HARMLS
- 2024-08-30 Listed $373,000 HARMLS
- 2024-08-16 Listing Removed — HARMLS
- 2024-06-14 Listed $360,000 HARMLS
- 2024-06-13 Listing Removed — HARMLS
- 2024-05-09 Listed $382,000 HARMLS
- 2024-05-07 Listing Removed — HARMLS
- 2024-05-03 Price Changed $392,000 HARMLS
- 2024-03-22 Listed $405,900 HARMLS
Property tax history
+76.9%/yrLatest (2025): $8,057 · -1.0% YoY. Source: county tax records.
Cash-flow waterfall
monthlySold comps — $/sqft
last 12 mo · ≤1 miLoading sold comps…