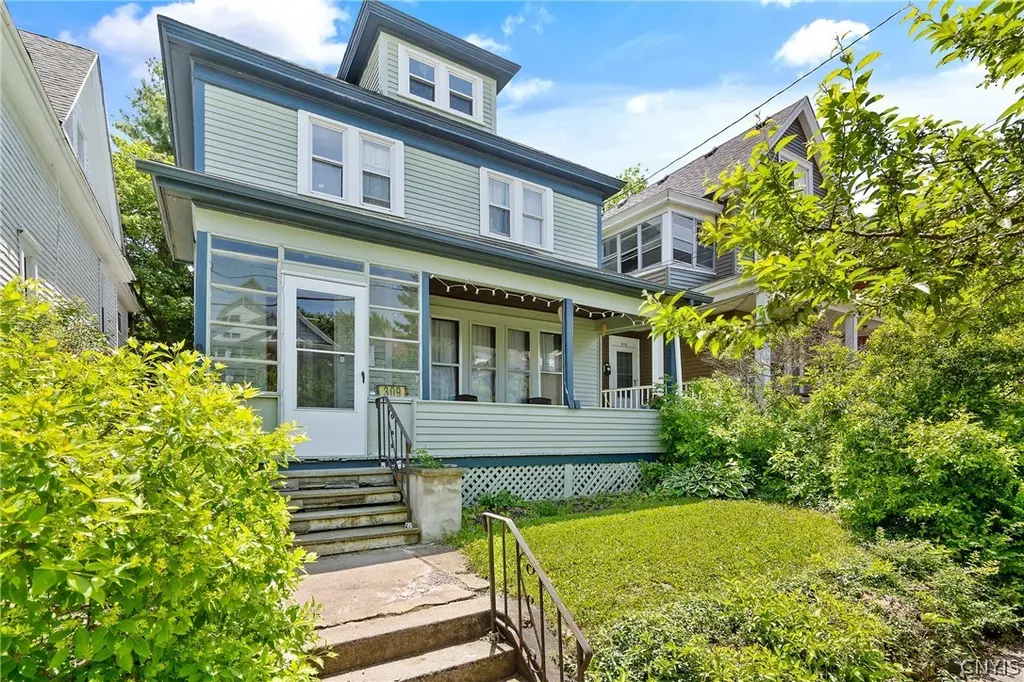
309 Bryant Ave · Syracuse, NY
Flood risk 1/10 · Minimal
- FEMA flood zone
- X (unshaded)
- Chance of flooding over 30 yrs
- 0.0%
- Est. flood insurance / yr
- $473 – $860
Fire risk 1/10 · Minimal
- Est. fire insurance / yr
- $691 – $1,283
Heat risk 3/10 · Minor
- Hot days now (above 95°F)
- 7 days/yr
- Hot days in 30 yrs
- 16 days/yr
Wind risk 1/10 · Minimal
- Chance of severe wind over 30 yrs
- 0.0%
Air-quality risk 2/10 · Minimal
- Unhealthy air days now
- 0 days/yr
- Unhealthy air days in 30 yrs
- 1 days/yr
Risk factors via First Street. Map © Google.
Why this score? — see what drove the B- grade
The composite is a weighted blend of 9 inputs, each scored 0–100. Each bar is that input's sub-score; the figure is the points it added to the 100-point composite (weight × sub-score).
- Cash flow +20.8/30.0
- ARV discount +10.9/15.0
- Appreciation +10.0/10.0
- DSCR +6.6/10.0
- 1% rule +4.6/10.0
- Rent growth +4.6/5.0
- Livability +3.9/5.0
- Condition / age +2.5/5.0
- Schools +1.8/10.0
$204,900
🖨 Deal sheet 📄 Offer letter ✓ Due diligence
Listing remarks MLS
GREAT INVESTMENT PROPERTY, TENANTS SIGNED ON UNTIL JUNE 30,2023. GREAT LOCATION IN TIPPERARY HILL. CLOSE TO SHOPPING, ENTERTAINMENT, PARKS AND MUCH MORE. SO MUCH CHARACTER IN THIS HOME! BEAUTIFUL HARDWOODS THROUGHOUT. YOU'LL LOVE THE BUTLER PANTRY OFF THE KITCHEN. LARGE LIVING ROOM AND DINING ROOM, 3 GOOD SIZED BEDROOMS AND 2 FULL BATH. ATTIC HAS TONS OF STORAGE. FRONT PORCH IS A BONUS! DON'T WAIT ON THIS ONE!
Key facts
- Back yard
- Formal dining room
- Eat in kitchen
Tags
Property features AI
Exterior
- Parking: No garage; No driveway
- Utilities: Cable available; High-speed internet available; Sewer connected; Public water connected; Circuit breaker electric
- Home design: 2 stories; Existing construction
- Construction: Wood siding; Copper plumbing; Block foundation
- Exterior features: Deck; Covered porch; Porch; Near public transit; Rectangular residential lot; City street frontage
Interior
- Kitchen: Gas oven; Gas range; Refrigerator; Walk-in pantry; Eat-in kitchen
- Bedrooms: Total rooms: 9
- Flooring: Hardwood; Laminate; Varies
- Bathrooms: 2 full bathrooms; 1 main-level bathroom
- Heating & cooling: Gas forced air heating
- Interior features: Separate/formal dining room; Entrance foyer; Eat-in kitchen; Separate/formal living room; Sliding glass door(s); Walk-in pantry; Natural woodwork; Sliding doors
- Laundry & utility: Laundry in basement; Gas water heater
Neighborhood map
What this means for you Summary
Snapshot
- This is a 3-bed/2.0-bath single-family listed at $205k.
Deal economics
- At list price, monthly cash flow is $280 ($3k/yr) — positive.
- The deal already cash-flows at list — no discount required.
- To meet the 1% rule (rent ≥ 1% of price), the offer needs to be $198k (3.5% below list).
- Recommended offer: $198k (3.5% below list) — sets the bar for 1% rule.
Location & tenants
- Location reads 77/100 on livability (#187 in NY, #2,869 nationally) — a middle-class / working-renter tenant base. Strengths: amenities A+, commute A+, cost of living A+; Watch: schools D+, crime F, employment D-.
- Syracuse City School District (urban): math 18% / reading 26% proficiency, ranked #590 of 590 in NY (top 100%) — low school quality limits family demand, transient renter base, plan for 1-2y turnover; 74% free/reduced lunch — lower-income household profile, screen leases tightly.
- Market conditions: Rents rising fast (+8.2%/yr); 119 active listings in the ZIP; 20 comparable units currently listed for rent nearby; rentals at typical pace (median 21d on market — plan ~3-4 weeks tenant-placement turnaround); 616 units permitted in Onondaga County in 2024 (256 in 5+ unit buildings).
- At $1,977/mo this rent would consume 52% of the median local household income ($45k/yr) (locally 2073% of renters already pay >50% of income on rent) — very limited rent-growth headroom before tenants either downsize or default.
Forward outlook
- In year one you build about $22k of equity ($1k loan paydown + $20k appreciation (10.0% local appreciation)).
- Onondaga County population projected to shrink 9% by 2050 — rents likely to lag national; underwrite the cash flow, not the appreciation.
- At projected returns (10.0% appreciation + 8.0% rent growth), your $57k cash investment doubles in ~3 years — after that, you're playing with house money.
- By year 2, paydown + projected appreciation supports a ~$35k cash-out refi (75% LTV) — recoverable capital for the next deal without selling this one.
Negotiation context
- Only 6 days on market — expect competitive offers; lowballing is unlikely to land.
- 6 sale attempts since 10y ago with the ask held roughly flat each time — persistent listings suggest the price (not the market) is what's stuck; bring a comps-based counter.
- Current owner paid $135k; list at $205k implies a 52% gain — meaningful room to come down on a strong offer.
Risks & watch-outs
- Watch-outs: built in 1905 — expect roof / HVAC / electrical / plumbing capex.
Questions for the listing agent
- Built in 1905 — when were the roof, HVAC, electrical panel, plumbing, and water heater last replaced?
- Is there a deadline driving the sale (1031 exchange, divorce, estate, relocation)? That informs how much negotiation room exists.
- Schools are D-rated, which usually means shorter tenancies and higher turnover. Who's the typical renter profile here, and what's been the actual vacancy rate?
- Crime grade is F in this area — have there been break-ins, vandalism, or insurance claims at this property in the last 3 years? What carrier currently insures it and at what premium?
- What's the average days-on-market for RENTAL listings here right now (not sales)? A rising rental-DOM trend means longer vacancies and softer asking-rent achievability than the comps imply.
- What's the recent tenant-quality profile in this submarket — average credit score on applications, eviction rate, late-payment / NSF rate, and stable-employment percentage? A property-management company in the area should have these aggregated.
- How much new for-sale + rental construction is in the pipeline within 1–3 miles? Heavy new supply typically softens prices + rents 12–24 months out; constrained supply supports both.
Investment metrics
- 1% rule
- 0.96% ✗
- Cap rate
- 7.93%
- Cash-on-cash
- 5.86%
- DSCR
- 1.26
- GRM
- 8.6
CMA / ARV
- ARV (on-the-fly)
- $221,535
- Comps found
- 12
Show comp detail 12 sales within ~0.75 mi
| Address | Dist | Beds/Ba | Sqft | Sold | Price | $/sf | Match |
|---|---|---|---|---|---|---|---|
| 416 Whittier Ave | 0.13mi | 3/1.0 | 1,632 (-0%) | 8mo | $205,000 | $126 | 82 |
| 461 Whittier Ave | 0.21mi | 3/1.5 | 1,462 (-11%) | 6mo | $175,000 | $120 | 65 |
| 513 Whittier Ave | 0.25mi | 4/2.0 (+1) | 1,457 (-11%) | 1mo | $202,000 | $139 | 64 |
| 703 Schuyler St | 0.44mi | 3/1.0 | 1,542 (-6%) | 3mo | $217,000 | $141 | 63 |
| 413 Fitch St | 0.63mi | 3/2.0 | 1,624 (-1%) | 9mo | $50,000 | $31 | 62 |
| 505 Tompkins St | 0.14mi | 3/1.0 | 1,852 (+13%) | 9mo | $150,000 | $81 | 61 |
| 310 Wilbur | 0.25mi | 4/2.0 (+1) | 1,856 (+13%) | 2mo | $250,000 | $135 | 60 |
| 136 Bryant Ave | 0.20mi | 4/1.0 (+1) | 1,440 (-12%) | 7mo | $220,000 | $153 | 56 |
| 557 Tennyson Ave | 0.29mi | 4/1.5 (+1) | 1,427 (-13%) | 3mo | $220,000 | $154 | 55 |
| 413 Herkimer St | 0.72mi | 4/2.5 (+1) | 1,566 (-5%) | 1mo | $260,000 | $166 | 51 |
| 214 Montrose Ave | 0.70mi | 3/2.0 | 1,722 (+5%) | 10mo | $120,000 | $70 | 50 |
| 205 Apple St | 0.55mi | 4/2.0 (+1) | 1,885 (+15%) | 8mo | $175,000 | $93 | 38 |
Match score weights: distance 35% · size 25% · config 20% · recency 20%. Top-matched comps best support the ARV.
Projected returns pro-forma
10.0% appreciation · 8.0% rent growth · sell at horizon
- IRR
- 30.4%
- Equity multiple
- 3.44×
- Total profit
- $139,847
- Equity at exit
- $184,590
- IRR
- 27.8%
- Equity multiple
- 8.38×
- Total profit
- $423,565
- Equity at exit
- $398,076
Cash invested: $57,372 (down + closing). Projections, not guarantees.
Landlord ↔ Tenant lean methodology
- Overall (STATE)
- 15 Strongly Tenant-Friendly
- State New York
- 15 Strongly Tenant-Friendly · D+10
- County
- — inherits STATE
- City
- — inherits STATE
ZIP-level market 13204
- Home prices YoY
- 31.6%
- Rents YoY
- 8.2%
- Active inventory
- 119
- Price-to-rent
- 8.6×
Monthly cashflow live
- Estimated rent
- $1,977 high interval (Pro) →
- Mortgage (P&I)
- −$1,075
- Tax from tax record
- −$122 /mo · $1,461/yr
- Insurance
- −$85
- HOA
- −$0
- Vacancy / Maint / Mgmt
- −$415
- Net cashflow
- $280
Break-even live
UW: 25.0% down · 7.5% · 30yr · 1.5% tax · 5.0% vac · 8.0% maint · 8.0% mgmt
Financing live
Cash to close
- Down payment
- $51,225
- Closing costs
- $6,147
- Reserves months
- —
- Total cash needed
- —
Loan-product check · same deal, 3 products live
Conventional
25% down · 7.5% · 30yr
- Down + closing
- —
- Monthly P&I
- —
- Monthly cashflow
- —
- DSCR
- —
- Eligible?
- —
Personal DTI + credit; lowest rate.
DSCR
20% down · 8.5% · 30yr
- Down + closing
- —
- Monthly P&I
- —
- Monthly cashflow
- —
- DSCR
- —
- Eligible?
- —
No personal income docs; deal must DSCR.
Hard money
10% down · 12.0% · 12mo
- Down + closing
- —
- Monthly P&I
- —
- Monthly cashflow
- —
- DSCR
- —
- Eligible?
- —
Short-term bridge; refi at stabilization.
Rent comps 20 comps
| Address | Beds | Baths | Sqft | Rent | $/sqft | DOM | Units | Dist |
|---|---|---|---|---|---|---|---|---|
| 349 Bryant Ave Syracuse, NY | 3.0 | 1.5 | 1500 | $2,300 | $1.53 | 13d | 1 | 0.07mi |
| 121 Whittier Ave Syracuse, NY | 4.0 | 1.0 | 1400 | $600 | $0.43 | 43d | 1 | 0.23mi |
| 214 Rowland St Syracuse, NY | 4.0 | 1.0 | 2092 | $1,800 | $0.86 | 13d | 1 | 0.80mi |
| 1110 Bellevue Ave Syracuse, NY | 3.0 | 1.0 | 1449 | $1,500 | $1.04 | 43d | 1 | 0.96mi |
| 318 Kellogg St Unit 2 Syracuse, NY | 3.0 | 1.0 | 1523 | $1,675 | $1.10 | 43d | 1 | 0.98mi |
| 318 Kellogg St Unit 1 Syracuse, NY | 3.0 | 1.0 | 1523 | $1,650 | $1.08 | 43d | 1 | 0.98mi |
| 315 Grant Ave #17 Syracuse, NY | 3.0 | 2.0 | 1477 | $1,275 | $0.86 | 13d | 1 | 0.99mi |
| 122 Putnam St Syracuse, NY | 3.0 | 1.0 | 1064 | $2,050 | $1.93 | 21d | 1 | 1.00mi |
| 229 Kellogg St Syracuse, NY | 2.0 | 1.0 | 2046 | $1,300 | $0.64 | 21d | 1 | 1.04mi |
| 326 Holland St Unit 1 Syracuse, NY | 3.0 | 1.0 | 2100 | $1,825 | $0.87 | 43d | 1 | 1.05mi |
| 538 Erie Blvd W Syracuse, NY | 2.0 | 2.0 | 1110 | $2,100 | $1.89 | 21d | 1 | 1.09mi |
| 410 Chemung St Unit 1 Syracuse, NY | 3.0 | 1.0 | 1100 | $1,500 | $1.36 | 13d | 1 | 1.13mi |
| 121 W End Dr Syracuse, NY | 3.0 | 1.5 | 1082 | $1,500 | $1.39 | 13d | 1 | 1.19mi |
| 104 Kincaid Ave Syracuse, NY | 4.0 | 1.0 | 1910 | $1,600 | $0.84 | 13d | 1 | 1.21mi |
| 409 Stolp Ave Syracuse, NY | 1.0–3.0 | 1.0 | 849 | $1,575 | $1.86 | 13d | 5 | 1.21mi |
| 373 Spencer St Unit 303 Syracuse, NY | 2.0 | 1.5 | 1085 | $1,850 | $1.71 | 43d | 1 | 1.37mi |
| 324 W Water St Syracuse, NY | 2.0 | 1.0 | 1007 | $1,975 | $1.96 | 13d | 6 | 1.37mi |
| 324 W Water St Unit 106 Syracuse, NY | 2.0 | 1.0 | 1436 | $2,095 | $1.46 | 21d | 1 | 1.37mi |
| 110 Walton St Unit 301 Syracuse, NY | 2.0 | 2.0 | 1051 | $2,000 | $1.90 | 21d | 1 | 1.47mi |
| 110 Walton St Unit 201 Syracuse, NY | 2.0 | 2.0 | 1051 | $2,200 | $2.09 | 43d | 1 | 1.47mi |
Listing history 6 events
-
2026-06-18days on market $204,900 Active 6 DOM
-
2026-06-17days on market $204,900 Active 5 DOM
-
2026-06-16days on market $204,900 Active 4 DOM
-
2026-06-15days on market $204,900 Active 3 DOM
-
2026-06-13remarks 699-char remark
-
2026-06-13$204,900 Active 1 DOM
ⓘ Source: listings_history table (triggers on properties + properties_extension) + one-shot
backfill from property_details.listing_events for pre-trigger history.
Tax reassessment forecast NY · Partial reset (capped growth)
- Current annual tax
- $1,461 · $122/mo
- Projected year-2 tax
- $2,462 · $205/mo
- Expected delta
- +$1,001/yr (+$83/mo · 68.5%)
ⓘ Screening estimate from a state-policy table — verify with the county assessor before closing.
Climate risk First Street
- Flood 1/10 Low FEMA zone X (unshaded) · 0% chance over 30 yrs
- Wildfire 1/10 Low
- Heat 3/10 Moderate 7 d/yr ≥95°F today · 16 d/yr by 30 yrs out
- Wind 1/10 Low 0% chance of damaging wind over 30 yrs
- Air quality 2/10 Low 0 unhealthy d/yr today · 1 by 30 yrs out
Nearby sold comps map
Loading sold comps map…
Walkable amenities ~0.75 mi
Loading nearby amenities…
Taxation est. · year 1
- Rental income
- $23,727
- − Mortgage interest
- −$11,478
- − Property taxes
- −$1,461
- − Insurance
- −$1,024
- − Repairs & maintenance
- −$1,898
- − Management
- −$1,898
- − Depreciation
- −$5,961
- Taxable income
- $7
- Est. tax owed @ 24.0%
- −$2
- After-tax cash flow
- $3,363/yr
For passive investors: Depreciation is non-cash, so a rental often shows a tax loss while cash-flowing — sheltering income. Rental losses are passive: they offset passive income freely, and up to $25,000/yr can offset ordinary (W-2) income if you actively participate and your MAGI is under $100k (phasing out to $0 by $150k); unused losses carry forward. On sale, claimed depreciation is recaptured at up to 25%, and gains may owe capital-gains tax (a 1031 exchange can defer both). Figures are a year-1 estimate at your 24.0% rate — not tax advice; consult a CPA.
Schools (NCES district)
- District
- Syracuse City School District
- NCES district ID
- 3628590
- Math proficiency
- 18% ▼ -5.00%
- Reading proficiency
- 26% ▬ 0.00%
- Median HH income
- $32,097
- Composite
- 17.83/100
- National rank
- #9007
- State rank
- #590 of 590 in NY
Livability — Syracuse
- Score
- 77/100
- State rank
- #187
- US rank
- #2869
Category grades
Schools grade is shown separately in the Schools card above.
Census & demographics
- Census place
- Syracuse, NY
- County
- Onondaga County · 247,257 people
- City population
- 152,627
- Metro
- Syracuse, NY
- Population (ZIP)
- 19,440
- Household income
- $45,351
- Rent vs Own
- Severe rent burden
- 2073.0
Population outlook (Onondaga County) Hauer SSP2
- Today (2025)
- 467,894 people
- By 2030
- 463,381 · -1.0%
- By 2040
- 447,697 · -4.3%
- By 2050
- 426,399 · -8.9%
- By 2075
- 373,661 · -20.1%
- By 2100
- 307,967 · -34.2%
Race, ethnicity, and origin ACS 2023
- Neighborhood character
- Diverse neighborhood (Simpson 0.68)
- Race & ethnicity
- White 47% Black 26% Hispanic / Latino 17% Two or more races 13% Native American 1%
- Hispanic origin (detail)
- Puerto Rican 12% Cuban 2% Dominican 1%
- Common ancestry
- Romanian 5% Lithuanian 2% Subsaharan African 2%
- Foreign-born
- 7% · Canada, Jamaica
- Languages at home
- 83% English-only · Spanish 11% Russian/Polish/Slavic 3% Arabic 1%
Political lean MEDSL · Onondaga
- 2024 margin
- D (+17.3) · D 58.6% · R 41.4%
- 2008→2024 swing
- -3.0pp toward R · 2008: 20.3pp · 2024: 17.3pp
- All cycles
- 2024: D+17.3 2020: D+20.6 2016: D+12.8 2012: D+21.1 2008: D+20.3
Not yet ingested
- Civics
- —
Market trends
- HPI YoY
- ▲ 100.14%
- Current HPI
- 416.7272
- Rent YoY
- ▲ 8.24%
- Metro
- Syracuse, NY
- State GDP YoY
- ▲ 2.60%
- F500 in state
- 92
Industry mix (Fortune 500 HQ in NY)
| Industry | F500 HQs | Revenue |
|---|---|---|
| Financial Services | 10 | $950B |
|
||
| Consumer Goods | 9 | $162B |
|
||
| Insurance | 4 | $225B |
|
||
| Telecommunications | 2 | $144B |
|
||
| Pharmaceuticals | 2 | $112B |
|
||
| Media / Entertainment | 2 | $69B |
|
||
Price history
+168.8% since first listed24 events — show timeline
- 2026-06-12 Listed $204,900 CNYIS
- 2022-09-23 Sold (Public Records) $135,000 Public Records
- 2022-09-14 Sold (MLS) $135,000 CNYIS
- 2022-08-30 Pending — CNYIS
- 2022-08-25 Sold (MLS) $135,000 CNYIS
- 2022-06-24 Pending — CNYIS
- 2022-06-20 Contingent — CNYIS
- 2022-06-17 Listed $124,900 CNYIS
- 2017-08-11 Sold (Public Records) $64,000 Public Records
- 2017-08-09 Sold (MLS) $61,000 CNYIS
- 2017-04-13 Contingent — CNYIS
- 2017-03-15 Relisted — CNYIS
- 2017-02-28 Contingent — CNYIS
- 2017-02-17 Listed $65,000 CNYIS
- 2016-10-11 Listing Removed — CNYIS
- 2016-09-07 Price Changed $69,900 CNYIS
- 2016-08-19 Price Changed $74,900 CNYIS
- 2016-08-10 Relisted — CNYIS
- 2016-08-03 Pending — CNYIS
- 2016-07-01 Price Changed $79,900 CNYIS
- 2016-06-29 Price Changed $80,900 CNYIS
- 2016-05-28 Price Changed $84,900 CNYIS
- 2016-05-01 Listed $89,900 CNYIS
- 2010-06-30 Sold (Public Records) $76,220 Public Records
Property tax history
+1.3%/yrLatest (2025): $1,461 · +0.0% YoY. Source: county tax records.
Cash-flow waterfall
monthlySold comps — $/sqft
last 12 mo · ≤1 miLoading sold comps…