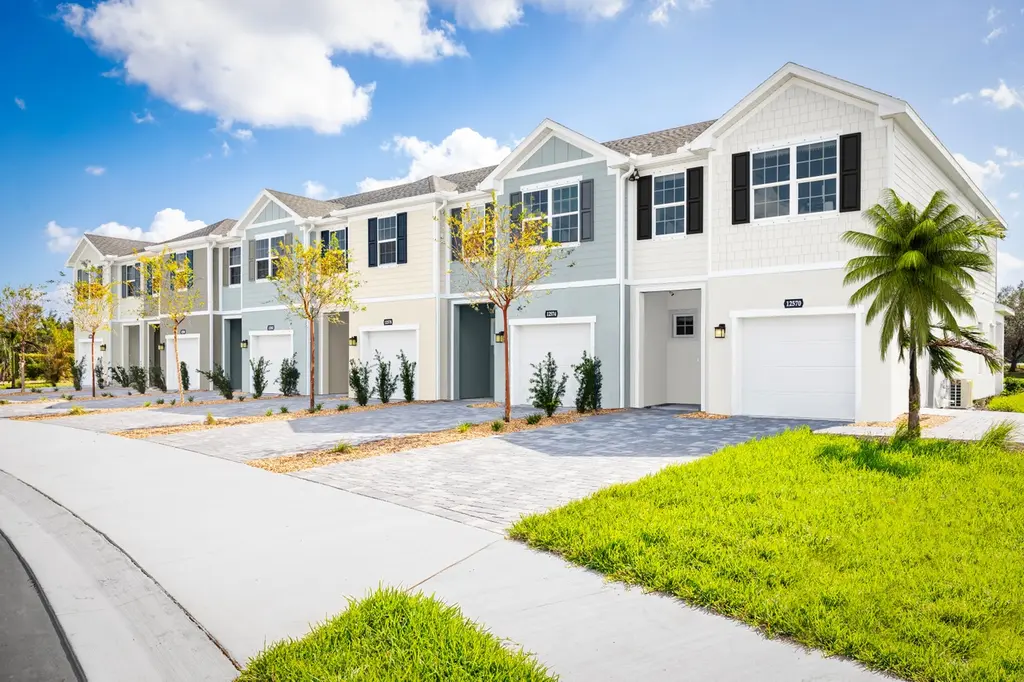
1676 Sweet Sapling Ct · Four Corners, FL
Flood risk No data
- FEMA flood zone
- —
- Chance of flooding over 30 yrs
- —
- Est. flood insurance / yr
- —
Fire risk No data
- Est. fire insurance / yr
- —
Heat risk No data
- Hot days now (above threshold)
- —
- Hot days in 30 yrs
- —
Wind risk No data
- Chance of severe wind over 30 yrs
- —
Air-quality risk No data
- Unhealthy air days now
- —
- Unhealthy air days in 30 yrs
- —
Risk factors via First Street. Map © Google.
Why this score? — see what drove the F grade
The composite is a weighted blend of 9 inputs, each scored 0–100. Each bar is that input's sub-score; the figure is the points it added to the 100-point composite (weight × sub-score).
- Cash flow +9.5/30.0
- ARV discount +7.5/15.0
- 1% rule +3.5/10.0
- Schools +3.5/10.0
- Livability +3.5/5.0
- DSCR +2.7/10.0
- Condition / age +2.5/5.0
- Rent growth +1.8/5.0
- Appreciation +0.0/10.0
$279,990
🖨 Deal sheet 📄 Offer letter ✓ Due diligence
Listing remarks MLS
Tile on the 1st Floor, 42 inch Espresso Cabinets, Granite countertop, All Stainless appliance, with top loaded washer & Dryer, Cable and internet included.
Key facts
- $150 HOA
- Garage
- Built 2026
Property features AI
Finance
- Other: Home warranty included
- Financial info: Other annual assessment: $2,040; Total monthly fees: $150; Total annual fees: $1,800; Lease restrictions apply
- HOA & community: HOA: Ryan Homes; Monthly HOA fee $150 (includes cable TV, internet, grounds maintenance); Community amenities: Park, Playground; Pets allowed
Exterior
- Parking: Attached garage (1 car, 10 x 21)
- Security: Smoke detector(s)
- Utilities: Public water; Public sewer; Electricity available; Public utilities
- Home design: Townhouse (attached); Two levels; New construction; Facing south
- Construction: Block, stucco, and frame construction; Shingle roof; Slab foundation; Builder: Ryan Homes (Model: MAYPORT); Projected completion: 2026-04-30
- Exterior features: Covered patio; Patio; Sliding doors; Sidewalk; Paved lot/road
Interior
- Kitchen: Dishwasher; Disposal; Microwave; Range; Electric water heater
- Bedrooms: 3 bedrooms
- Flooring: Carpet; Ceramic tile
- Bathrooms: 2 full bathrooms; 1 half bathroom
- Heating & cooling: Central heating; Central air
- Interior features: Eat-in kitchen; High ceilings; Kitchen/family room combo; Living room/dining room combo; Solid surface counters; Stone counters; Thermostat; Walk-in closet(s); ENERGY STAR qualified windows; Smoke detector(s)
- Laundry & utility: Inside laundry on upper level; Inside utility room
Neighborhood map
What this means for you Summary
Snapshot
- This is a 3-bed/2.5-bath land listed at $280k.
Deal economics
- At list price, monthly cash flow is $-195 ($-2k/yr) — negative.
- To cash-flow at today's rent, offer at most $252k (10.1% below list).
- To meet the 1% rule (rent ≥ 1% of price), the offer needs to be $239k (14.5% below list).
- Recommended offer: $239k (14.5% below list) — sets the bar for 1% rule.
- Cap rate 5.5% vs local median 3.2% in Four Corners — top-decile yield for the area; either an underpriced asset or a hidden risk that comps aren't pricing in. Stress-test before assuming the spread holds.
Location & tenants
- Location reads 69/100 on livability (#453 in FL) — a middle-class / working-renter tenant base. Strengths: housing A+, cost of living A-; Watch: amenities F, health & safety F.
- Polk (suburban): math 39% / reading 43% proficiency, ranked #62 of 73 in FL (top 85%) — families likely to look elsewhere, expect single-tenant / working-renter base with shorter leases.
- Zoned schools: Loughman Oaks Elementary School (math 36% / reading 36%, grade F, #1,670 of 2,144 statewide, top 78%, 1,052 students, 37% FRL); Davenport High School (2,333 students, 37% FRL) — zoned schools average 37% FRL vs 60% district-wide (22 pts lower); this property's tenant base skews higher-income than the district average.
- Market conditions: Rents soft (-2.7%/yr); 1382 active listings in the ZIP; 29 comparable units currently listed for rent nearby; rentals at typical pace (median 19d on market — plan ~3-4 weeks tenant-placement turnaround); solid renter incomes; 10,384 units permitted in Polk County in 2024 (1,716 in 5+ unit buildings).
- This rent runs 35% of the median local income ($81k/yr) — at the standard rent-burdened threshold; future hikes will face affordability resistance.
Forward outlook
- Local home prices are declining (-3.0%/yr); year-one equity from $2k of loan paydown is wiped out by about $8k of value loss. Plan a longer hold.
- Polk County population projected at +33% by 2050 — long-run rental-demand tailwind backs the buy-and-hold thesis.
Negotiation context
- It's been on market 71 days — a 6% lower offer ($263k) is reasonable based on typical stale-listing flexibility.
- 3 sale attempts with the ask held roughly flat each time — persistent listings suggest the price (not the market) is what's stuck; bring a comps-based counter.
Questions for the listing agent
- What do current leases actually rent for vs. the listed asking? Can we see a recent rent roll and the last 12 months of T-12 income?
- It's been on market 71 days. Have you received any prior offers? Is the seller open to a 15% concession, seller financing, or rate buy-down credit?
- What does the HOA fee cover, when was the last increase, and are there any pending special assessments or reserve-fund shortfalls?
- Why hasn't it sold? Are there any deal-killer items the seller is aware of (foundation, flood, title, zoning, code violations)?
- Is there a deadline driving the sale (1031 exchange, divorce, estate, relocation)? That informs how much negotiation room exists.
- Schools are F-rated, which usually means shorter tenancies and higher turnover. Who's the typical renter profile here, and what's been the actual vacancy rate?
- The area grade is low — what's the realistic commute time and amenity access for the typical tenant pool here? Any planned neighborhood developments (good or bad) we should know about?
- What's the average days-on-market for RENTAL listings here right now (not sales)? A rising rental-DOM trend means longer vacancies and softer asking-rent achievability than the comps imply.
- What's the recent tenant-quality profile in this submarket — average credit score on applications, eviction rate, late-payment / NSF rate, and stable-employment percentage? A property-management company in the area should have these aggregated.
- How much new for-sale + rental construction is in the pipeline within 1–3 miles? Heavy new supply typically softens prices + rents 12–24 months out; constrained supply supports both.
Investment metrics
- 1% rule
- 0.85% ✗
- Cap rate
- 5.46%
- Cash-on-cash
- -2.98%
- DSCR
- 0.87
- GRM
- 9.8
CMA / ARV
No comps found within radius.
Projected returns pro-forma
-3.0% appreciation · 0.0% rent growth · sell at horizon
- IRR
- -24.9%
- Equity multiple
- 0.18×
- Total profit
- $-64,657
- Equity at exit
- $41,747
- IRR
- -34.9%
- Equity multiple
- -0.26×
- Total profit
- $-98,850
- Equity at exit
- $24,208
Cash invested: $78,397 (down + closing). Projections, not guarantees.
Landlord ↔ Tenant lean methodology
- Overall (STATE)
- 87 Strongly Landlord-Friendly
- State Florida
- 87 Strongly Landlord-Friendly · R+3
- County
- — inherits STATE
- City
- — inherits STATE
ZIP-level market 33837
- Home prices YoY
- -33.9%
- Rents YoY
- -2.7%
- Active inventory
- 1382
- Price-to-rent
- 9.8×
Monthly cashflow live
- Estimated rent
- $2,393 high interval (Pro) →
- Mortgage (P&I)
- −$1,468
- Tax est. 1.5%
- −$350 /mo · $4,200/yr
- Insurance
- −$117
- HOA
- −$150
- Vacancy / Maint / Mgmt
- −$502
- Net cashflow
- $-195
Break-even live
UW: 25.0% down · 7.5% · 30yr · 1.5% tax · 5.0% vac · 8.0% maint · 8.0% mgmt
Financing live
Cash to close
- Down payment
- $69,998
- Closing costs
- $8,400
- Reserves months
- —
- Total cash needed
- —
Loan-product check · same deal, 3 products live
Conventional
25% down · 7.5% · 30yr
- Down + closing
- —
- Monthly P&I
- —
- Monthly cashflow
- —
- DSCR
- —
- Eligible?
- —
Personal DTI + credit; lowest rate.
DSCR
20% down · 8.5% · 30yr
- Down + closing
- —
- Monthly P&I
- —
- Monthly cashflow
- —
- DSCR
- —
- Eligible?
- —
No personal income docs; deal must DSCR.
Hard money
10% down · 12.0% · 12mo
- Down + closing
- —
- Monthly P&I
- —
- Monthly cashflow
- —
- DSCR
- —
- Eligible?
- —
Short-term bridge; refi at stabilization.
Rent comps 29 comps
| Address | Beds | Baths | Sqft | Rent | $/sqft | DOM | Units | Dist |
|---|---|---|---|---|---|---|---|---|
| 616 Daring Dr Davenport, FL | 4.0 | 2.0 | 2090 | $2,500 | $1.20 | 23d | 1 | 0.44mi |
| 652 Daring Dr Davenport, FL | 3.0 | 2.0 | 2109 | $2,150 | $1.02 | 23d | 1 | 0.52mi |
| 506 Hatteras Rd Davenport, FL | 4.0 | 3.0 | 2120 | $2,890 | $1.36 | 3d | 1 | 0.59mi |
| 700 Daring Dr Davenport, FL | 4.0 | 2.0 | 1853 | $2,350 | $1.27 | 23d | 1 | 0.63mi |
| 316 Heroic Rd Davenport, FL | 4.0 | 3.0 | 2080 | $3,000 | $1.44 | 14d | 1 | 0.64mi |
| 1731 Oceania Ave Davenport, FL | 4.0 | 2.5 | 2110 | $2,560 | $1.21 | 14d | 1 | 0.77mi |
| 1337 Cascade Dr Davenport, FL | 3.0 | 2.0 | 1506 | $2,025 | $1.34 | 14d | 1 | 0.78mi |
| 1824 Brisbane Pl Davenport, FL | 3.0 | 2.0 | 1596 | $2,200 | $1.38 | 19d | 1 | 0.82mi |
| 1011 John Jacob Rd Davenport, FL | 3.0 | 2.0 | 1555 | $2,200 | $1.41 | 23d | 1 | 0.89mi |
| 2788 Pierr St Davenport, FL | 3.0 | 2.5 | 1700 | $2,150 | $1.26 | 14d | 1 | 0.89mi |
| 2821 Pierr St Davenport, FL | 3.0 | 2.5 | 1873 | $2,000 | $1.07 | 23d | 1 | 0.89mi |
| 2172 Desert Rose Dr Davenport, FL | 3.0 | 2.0 | 1545 | $2,250 | $1.46 | 23d | 1 | 0.89mi |
| 1126 James Paul Rd Davenport, FL | 4.0 | 2.5 | 2041 | $2,200 | $1.08 | 14d | 1 | 0.91mi |
| 1106 James Paul Rd Davenport, FL | 4.0 | 2.0 | 1897 | $2,550 | $1.34 | 23d | 1 | 0.91mi |
| 852 Daring Dr Davenport, FL | 3.0 | 2.0 | 1555 | $1,990 | $1.28 | 23d | 1 | 0.96mi |
| 865 Daring Dr Davenport, FL | 4.0 | 2.5 | 1890 | $2,650 | $1.40 | 23d | 1 | 0.99mi |
| 507 Lily Ln Davenport, FL | 4.0 | 2.0 | 1952 | $2,300 | $1.18 | 19d | 1 | 1.11mi |
| 148 Heavenwood Ct Davenport, FL | 3.0 | 2.0 | 1327 | $1,881 | $1.42 | 3d | 1 | 1.12mi |
| 3141 Laurent Loop Davenport, FL | 3.0 | 2.5 | 1888 | $1,950 | $1.03 | 3d | 1 | 1.19mi |
| 3133 Laurent Loop Davenport, FL | 3.0 | 2.5 | 1834 | $2,000 | $1.09 | 23d | 1 | 1.20mi |
| 3255 Laurent Loop Davenport, FL | 3.0 | 2.5 | 1873 | $2,225 | $1.19 | 19d | 1 | 1.22mi |
| 3302 Laurent Loop Davenport, FL | 3.0 | 2.5 | 1840 | $2,230 | $1.21 | 3d | 1 | 1.23mi |
| 2837 Pierr St Davenport, FL | 3.0 | 2.5 | 1738 | $2,100 | $1.21 | 3d | 1 | 1.25mi |
| 1320 Oak Crest St Davenport, FL | 4.0 | 2.0 | 1850 | $2,211 | $1.20 | 14d | 1 | 1.29mi |
| 4052 Oaktree Dr Davenport, FL | 4.0 | 3.0 | 2172 | $2,850 | $1.31 | 14d | 1 | 1.37mi |
| 820 Briargrove Ave Davenport, FL | 4.0 | 2.0 | 1564 | $2,249 | $1.44 | 3d | 1 | 1.38mi |
| 129 Victory Ave Davenport, FL | 3.0 | 2.0 | 1600 | $2,350 | $1.47 | 23d | 1 | 1.41mi |
| 245 Foggy Creek Rd Davenport, FL | 3.0 | 2.0 | 1440 | $2,150 | $1.49 | 23d | 1 | 1.46mi |
| 309 Vizcay Way Davenport, FL | 3.0 | 2.0 | 1759 | $2,435 | $1.38 | 14d | 1 | 1.48mi |
HOA detail
- Monthly dues
- $150 · $1,800/yr
- Likely covers
- internetcable
Listing history 22 events
-
2026-06-18days on market $279,990 Active 71 DOM
-
2026-06-17days on market $279,990 Active 70 DOM
-
2026-06-16days on market $279,990 Active 69 DOM
-
2026-06-15days on market $279,990 Active 68 DOM
-
2026-06-13days on market $279,990 Active 66 DOM
-
2026-06-10days on market $279,990 Active 63 DOM
-
2026-06-09days on market $279,990 Active 62 DOM
-
2026-06-08days on market $279,990 Active 61 DOM
-
2026-06-07days on market $279,990 Active 60 DOM
-
2026-06-05days on market $279,990 Active 57 DOM
-
2026-06-03days on market $279,990 Active 56 DOM
-
2026-06-03days on market $279,990 Active 55 DOM
-
2026-06-01days on market $279,990 Active 54 DOM
-
2026-05-31days on market $279,990 Active 53 DOM
-
2026-05-19price $279,990
Show marketing remark (161 chars)
Tile on the 1st Floor, 42 inch Espresso Cabinets, Granite countertop, All Stainless appliance, with top loaded washer & Dryer, Cable and internet included.
-
2026-05-19price $279,990 161-char remark
Show marketing remark (161 chars)
Tile on the 1st Floor, 42 inch Espresso Cabinets, Granite countertop, All Stainless appliance, with top loaded washer & Dryer, Cable and internet included.
-
2026-04-23status Active 161-char remark
Show marketing remark (161 chars)
Tile on the 1st Floor, 42 inch Espresso Cabinets, Granite countertop, All Stainless appliance, with top loaded washer & Dryer, Cable and internet included.
-
2026-04-23price $289,990 161-char remark
Show marketing remark (161 chars)
Tile on the 1st Floor, 42 inch Espresso Cabinets, Granite countertop, All Stainless appliance, with top loaded washer & Dryer, Cable and internet included.
-
2026-04-17historical 161-char remark
Show marketing remark (161 chars)
Tile on the 1st Floor, 42 inch Espresso Cabinets, Granite countertop, All Stainless appliance, with top loaded washer & Dryer, Cable and internet included.
-
2026-04-08$293,990 Active 161-char remark
Show marketing remark (161 chars)
Tile on the 1st Floor, 42 inch Espresso Cabinets, Granite countertop, All Stainless appliance, with top loaded washer & Dryer, Cable and internet included.
-
2026-04-08$289,990 Active
Show marketing remark (161 chars)
Tile on the 1st Floor, 42 inch Espresso Cabinets, Granite countertop, All Stainless appliance, with top loaded washer & Dryer, Cable and internet included.
-
2026-01-14soldstatus $1,330,000
ⓘ Source: listings_history table (triggers on properties + properties_extension) + one-shot
backfill from property_details.listing_events for pre-trigger history.
Nearby sold comps map
Loading sold comps map…
Walkable amenities ~0.75 mi
Loading nearby amenities…
Taxation est. · year 1
- Rental income
- $28,712
- − Mortgage interest
- −$15,684
- − Property taxes
- −$4,200
- − Insurance
- −$1,400
- − Repairs & maintenance
- −$2,297
- − Management
- −$2,297
- − HOA
- −$1,800
- − Depreciation
- −$8,145
- Taxable loss
- −$7,111
- Est. tax savings @ 24.0%
- +$1,707
- After-tax cash flow
- $-630/yr
For passive investors: Depreciation is non-cash, so a rental often shows a tax loss while cash-flowing — sheltering income. Rental losses are passive: they offset passive income freely, and up to $25,000/yr can offset ordinary (W-2) income if you actively participate and your MAGI is under $100k (phasing out to $0 by $150k); unused losses carry forward. On sale, claimed depreciation is recaptured at up to 25%, and gains may owe capital-gains tax (a 1031 exchange can defer both). Figures are a year-1 estimate at your 24.0% rate — not tax advice; consult a CPA.
Schools (NCES district)
- District
- Polk
- NCES district ID
- 1201590
- Math proficiency
- 39% ▼ -11.00%
- Reading proficiency
- 43% ▼ -4.00%
- Median HH income
- $43,979
- Composite
- 34.74/100
- National rank
- #5132
- State rank
- #62 of 73 in FL
Livability — Four Corners
- Score
- 69/100
- State rank
- #453
- US rank
- #8218
Category grades
Schools grade is shown separately in the Schools card above.
Census & demographics
- County
- Polk County · 740,051 people
- City population
- 27,422
- Metro
- Lakeland-Winter Haven, FL
- Population (ZIP)
- 47,389
- Household income
- $81,276
- Rent vs Own
- Severe rent burden
- 424.0
Population outlook (Polk County) Hauer SSP2
- Today (2025)
- 752,975 people
- By 2030
- 804,621 · +6.9%
- By 2040
- 906,117 · +20.3%
- By 2050
- 1,000,476 · +32.9%
- By 2075
- 1,197,520 · +59.0%
- By 2100
- 1,271,518 · +68.9%
Race, ethnicity, and origin ACS 2023
- Neighborhood character
- Diverse neighborhood (Simpson 0.68)
- Race & ethnicity
- Hispanic / Latino 42% White 36% Two or more races 16% Black 15% Asian 2%
- Hispanic origin (detail)
- Mexican 7% Puerto Rican 22% Cuban 2% Dominican 1%
- Common ancestry
- Hispanic 5% Romanian 3% Lithuanian 1%
- Foreign-born
- 18% · Canada, Jamaica
- Languages at home
- 55% English-only · Spanish 35% French/Haitian/Cajun 6% Other Indo-European 2%
Political lean MEDSL · Polk
- 2024 margin
- Strong R (+20.7) · D 39.2% · R 59.9%
- 2008→2024 swing
- -14.6pp toward R · 2008: -6.1pp · 2024: -20.7pp
- All cycles
- 2024: R+20.7 2020: R+14.4 2016: R+14.1 2012: R+6.8 2008: R+6.1
Not yet ingested
- Civics
- —
Market trends
- HPI YoY
- ▼ -131.62%
- Current HPI
- 256.8165
- Rent YoY
- ▼ -2.73%
- Metro
- Lakeland-Winter Haven, FL
- State GDP YoY
- ▲ 3.28%
- F500 in state
- 36
Industry mix (Fortune 500 HQ in FL)
| Industry | F500 HQs | Revenue |
|---|---|---|
| Industrial Technology | 2 | $29B |
|
||
| Insurance | 2 | $17B |
|
||
| Retail | 1 | $60B |
|
||
| Technology Distribution | 1 | $58B |
|
||
| Homebuilding | 1 | $35B |
|
||
| Technology Manufacturing | 1 | $35B |
|
||
Price history
-78.9% since first listed8 events — show timeline
- 2026-05-19 Price Changed $279,990 Stellar MLS as Distributed by MLS Grid
- 2026-05-19 Price Changed $279,990 Zillow
- 2026-04-23 Relisted — Zillow
- 2026-04-23 Price Changed $289,990 Zillow
- 2026-04-17 Delisted — Zillow
- 2026-04-08 Listed $293,990 Zillow
- 2026-04-08 Listed $289,990 Stellar MLS as Distributed by MLS Grid
- 2026-01-14 Sold (Public Records) $1,330,000 Public Records
Cash-flow waterfall
monthlySold comps — $/sqft
last 12 mo · ≤1 miLoading sold comps…