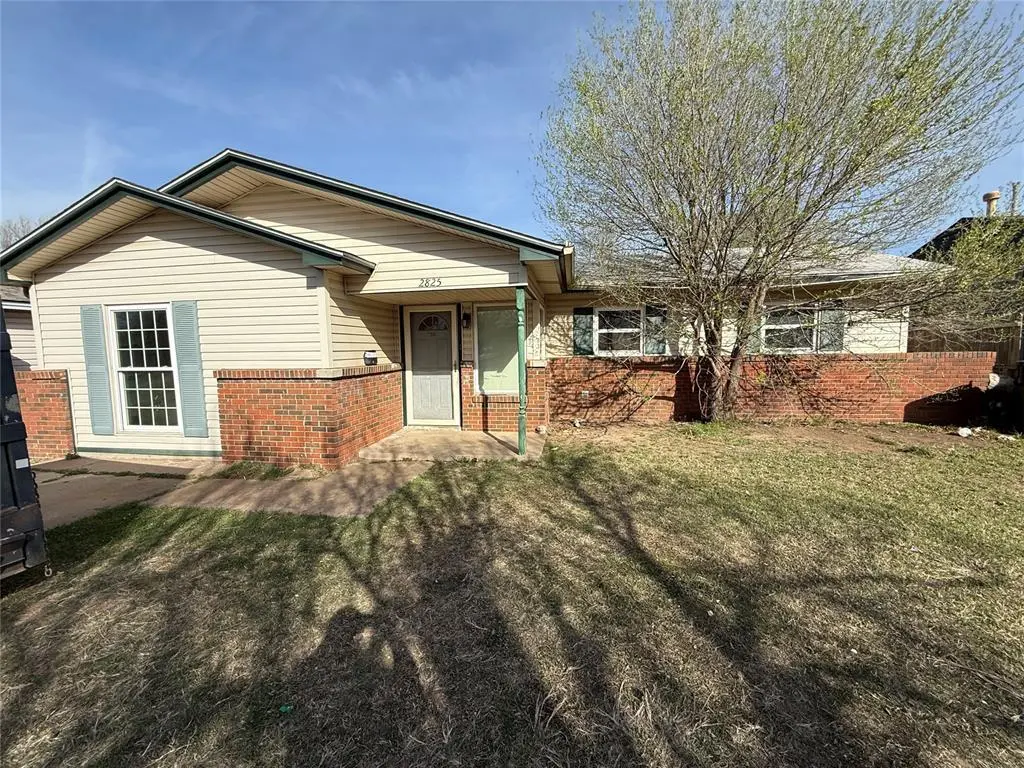
2825 SW 62nd St · Oklahoma City, OK
Flood risk 1/10 · Minimal
- FEMA flood zone
- X (unshaded)
- Chance of flooding over 30 yrs
- 0.0%
- Est. flood insurance / yr
- $507 – $1,088
Fire risk 4/10 · Minor
- Est. fire insurance / yr
- $2,463 – $4,575
Heat risk 6/10 · Moderate
- Hot days now (above 107°F)
- 7 days/yr
- Hot days in 30 yrs
- 19 days/yr
Wind risk 3/10 · Minor
- Chance of severe wind over 30 yrs
- 4.0%
Air-quality risk 1/10 · Minimal
- Unhealthy air days now
- 0 days/yr
- Unhealthy air days in 30 yrs
- 0 days/yr
Risk factors via First Street. Map © Google.
Why this score? — see what drove the B- grade
The composite is a weighted blend of 9 inputs, each scored 0–100. Each bar is that input's sub-score; the figure is the points it added to the 100-point composite (weight × sub-score).
- Cash flow +26.2/30.0
- ARV discount +15.0/15.0
- DSCR +8.8/10.0
- 1% rule +6.7/10.0
- Livability +4.0/5.0
- Rent growth +3.4/5.0
- Condition / age +2.5/5.0
- Schools +0.7/10.0
- Appreciation +0.0/10.0
$110,000
🖨 Deal sheet (PDF) 📄 Offer letter ✓ Due diligence
Listing remarks MLS
Attention investors and flippers! This SW OKC property is ready for a full transformation. With a functional layout and strong upside potential, this is the perfect opportunity to add value and maximize returns. Located in an established area with convenient access to shopping, dining, and highways. Property to be sold as-is.
Key facts
- 7,645 sq ft lot
- Built 1959
- Listed 59 days
Neighborhood map
What this means for you Summary
Snapshot
- This is a 3-bed/1.0-bath single-family listed at $110k.
Deal economics
- At list price, monthly cash flow is $280 ($3k/yr) — positive.
- The deal already cash-flows at list — no discount required.
- Meets the 1% rule at list price ($1k rent vs $110k).
- Recommended offer: $107k (3.0% below list) — sets the bar for market timing.
- Cap rate 9.3% vs local median 3.7% in Oklahoma City — top-decile yield for the area; either an underpriced asset or a hidden risk that comps aren't pricing in. Stress-test before assuming the spread holds.
Location & tenants
- Location reads 80/100 on livability (#3 in OK, #1,635 nationally) — a professional / high-income tenant draw. Strengths: amenities A+, commute A+, cost of living A+; Watch: crime F.
- Oklahoma City (urban): math 7% / reading 10% proficiency, ranked #254 of 270 in OK (top 94%) — low school quality limits family demand, transient renter base, plan for 1-2y turnover; 82% free/reduced lunch — lower-income household profile, screen leases tightly.
- Zoned schools: Hillcrest Es (math 17% / reading 17%, grade F, #540 of 845 statewide, top 68%, 516 students, 0% FRL); Jefferson Ms (math 2% / reading 5%, grade F, #330 of 345 statewide, top 96%, 919 students, 0% FRL); U. S. Grant Hs (math 2% / reading 7%, grade F, #442 of 447 statewide, top 99%, 1,594 students, 0% FRL) — zoned schools average 0% FRL vs 82% district-wide (82 pts lower); this property's tenant base skews higher-income than the district average.
- Market conditions: Rents rising (+3.5%/yr); 38 active listings in the ZIP; 31 comparable units currently listed for rent nearby; rentals at typical pace (median 25d on market — plan ~3-4 weeks tenant-placement turnaround); 45% of comp listings sitting > 30 days — soft ceiling on asking rent; 5,365 units permitted in Oklahoma County in 2024 (569 in 5+ unit buildings).
Forward outlook
- Local home prices are declining (-3.0%/yr); year-one equity from $761 of loan paydown is wiped out by about $3k of value loss. Plan a longer hold.
- Oklahoma County population projected at +41% by 2050 — long-run rental-demand tailwind backs the buy-and-hold thesis.
- At projected returns (-3.0% appreciation + 3.5% rent growth), your $31k cash investment doubles in ~10 years — after that, you're playing with house money.
Negotiation context
- It's been on market 59 days — a 3% lower offer ($107k) is reasonable based on typical stale-listing flexibility.
- 3 sale attempts since 26y ago; this cycle's ask has dropped $10k (8%) from the opening price — seller is motivated, your offer sets the floor, not the list.
- Current owner paid $60k; list at $110k implies a 83% gain — meaningful room to come down on a strong offer.
Risks & watch-outs
- Watch-outs: built in 1959 — expect roof / HVAC / electrical / plumbing capex.
- Climate carrying-cost: extreme-heat days projected 7→19/yr by 2055 (HVAC capex compounding) — expect insurance premiums to compound above CPI over the hold.
Questions for the listing agent
- It's been on market 59 days. Have you received any prior offers? Is the seller open to a 3% concession, seller financing, or rate buy-down credit?
- Built in 1959 — when were the roof, HVAC, electrical panel, plumbing, and water heater last replaced?
- Is there a deadline driving the sale (1031 exchange, divorce, estate, relocation)? That informs how much negotiation room exists.
- Schools are F-rated, which usually means shorter tenancies and higher turnover. Who's the typical renter profile here, and what's been the actual vacancy rate?
- Crime grade is F in this area — have there been break-ins, vandalism, or insurance claims at this property in the last 3 years? What carrier currently insures it and at what premium?
- What's the average days-on-market for RENTAL listings here right now (not sales)? A rising rental-DOM trend means longer vacancies and softer asking-rent achievability than the comps imply.
- What's the recent tenant-quality profile in this submarket — average credit score on applications, eviction rate, late-payment / NSF rate, and stable-employment percentage? A property-management company in the area should have these aggregated.
- How much new for-sale + rental construction is in the pipeline within 1–3 miles? Heavy new supply typically softens prices + rents 12–24 months out; constrained supply supports both.
Investment metrics
- 1% rule
- 1.17% ✓
- Cap rate
- 9.34%
- Cash-on-cash
- 10.89%
- DSCR
- 1.48
- GRM
- 7.1
CMA / ARV
- ARV (median comp)
- $172,106
- List price
- $110,000
- Delta
- -36.09%
- Verdict
- UNDERPRICED
- Comps
- 20 within 1.0 mi
Show comp detail 12 sales within ~0.75 mi
| Address | Dist | Beds/Ba | Sqft | Sold | Price | $/sf | Match |
|---|---|---|---|---|---|---|---|
| 2813 SW 65th St | 0.20mi | 3/1.0 | 939 (+0%) | 8mo | $130,000 | $138 | 84 |
| 2821 SW 63rd St | 0.06mi | 3/1.0 | 870 (-7%) | 12mo | $80,000 | $92 | 75 |
| 2736 SW 65th St | 0.24mi | 3/1.0 | 900 (-4%) | 13mo | $168,500 | $187 | 71 |
| 2631 SW 57th Pl | 0.48mi | 3/1.0 | 954 (+2%) | 8mo | $149,000 | $156 | 68 |
| 3022 SW 57th St | 0.52mi | 3/1.5 | 1,004 (+7%) | 1mo | $175,000 | $174 | 62 |
| 2621 SW 70th St | 0.52mi | 3/1.5 | 1,032 (+10%) | 1mo | $150,000 | $145 | 57 |
| 6106 S Hillcrest Dr | 0.53mi | 2/1.5 (-1) | 998 (+6%) | 1mo | $125,000 | $125 | 56 |
| 2828 SW 54th Pl | 0.61mi | 3/1.0 | 993 (+6%) | 7mo | $103,000 | $104 | 56 |
| 2640 SW 57th St | 0.49mi | 3/1.5 | 1,032 (+10%) | 5mo | $175,000 | $170 | 55 |
| 5416 S Independence Ave | 0.72mi | 3/1.5 | 983 (+5%) | 10mo | $163,000 | $166 | 47 |
| 2504 SW 55th St | 0.69mi | 3/1.5 | 1,035 (+10%) | 6mo | $175,000 | $169 | 44 |
| 2836 SW 53rd St | 0.72mi | 3/1.0 | 1,044 (+11%) | 6mo | $167,900 | $161 | 42 |
Match score weights: distance 35% · size 25% · config 20% · recency 20%. Top-matched comps best support the ARV.
Projected returns pro-forma
-3.0% appreciation · 3.49% rent growth · sell at horizon
- IRR
- 0.5%
- Equity multiple
- 1.02×
- Total profit
- $625
- Equity at exit
- $16,401
- IRR
- 10.7%
- Equity multiple
- 1.85×
- Total profit
- $26,151
- Equity at exit
- $9,511
Cash invested: $30,800 (down + closing). Projections, not guarantees.
Landlord ↔ Tenant lean methodology
- Overall (STATE)
- 83 Strongly Landlord-Friendly
- State Oklahoma
- 83 Strongly Landlord-Friendly · R+20
- County
- — inherits STATE
- City
- — inherits STATE
ZIP-level market 73159
- Rents YoY
- 3.5%
- Active inventory
- 38
- Price-to-rent
- 7.1×
Monthly cashflow live
- Estimated rent
- $1,292 high interval (Pro) →
- Mortgage (P&I)
- −$577
- Tax from tax record
- −$118 /mo · $1,420/yr
- Insurance
- −$46
- HOA
- −$0
- Vacancy / Maint / Mgmt
- −$271
- Net cashflow
- $280
Break-even live
Sensitivity live
| Price | -10% $342 | -5% $311 | +0% $280 | +5% $248 | +10% $217 |
|---|---|---|---|---|---|
| Rent | -10% $177 | -5% $228 | +0% $280 | +5% $331 | +10% $382 |
| Rate | -1.0pp $335 | -0.5pp $307 | base $280 | +0.5pp $251 | +1.0pp $222 |
UW: 25.0% down · 7.5% · 30yr · 1.5% tax · 5.0% vac · 8.0% maint · 8.0% mgmt
Financing live
Cash to close
- Down payment
- $27,500
- Closing costs
- $3,300
- Reserves months
- —
- Total cash needed
- —
Loan-product check · same deal, 3 products live
Conventional
25% down · 7.5% · 30yr
- Down + closing
- —
- Monthly P&I
- —
- Monthly cashflow
- —
- DSCR
- —
- Eligible?
- —
Personal DTI + credit; lowest rate.
DSCR
20% down · 8.5% · 30yr
- Down + closing
- —
- Monthly P&I
- —
- Monthly cashflow
- —
- DSCR
- —
- Eligible?
- —
No personal income docs; deal must DSCR.
Hard money
10% down · 12.0% · 12mo
- Down + closing
- —
- Monthly P&I
- —
- Monthly cashflow
- —
- DSCR
- —
- Eligible?
- —
Short-term bridge; refi at stabilization.
Rent comps 31 comps
| Address | Beds | Baths | Sqft | Rent | $/sqft | DOM | Units | Dist |
|---|---|---|---|---|---|---|---|---|
| 2813 SW 62nd St Oklahoma City, OK | 3.0 | 1.5 | 1001 | $1,400 | $1.40 | 25d | 1 | 0.06mi |
| 2908 SW 62nd St Oklahoma City, OK | 3.0 | 1.5 | 936 | $1,450 | $1.55 | 4d | 1 | 0.10mi |
| 2728 SW 65th St Oklahoma City, OK | 3.0 | 1.0 | 863 | $1,250 | $1.45 | 5d | 1 | 0.29mi |
| 5901 S May Ave Unit 089 VLI Oklahoma City, OK | 2.0 | 2.0 | 859 | $999 | $1.16 | 45d | 1 | 0.39mi |
| 5901 S May Ave Unit 105 Oklahoma City, OK | 2.0 | 2.0 | 859 | $995 | $1.16 | 3d | 1 | 0.39mi |
| 5901 S May Ave Unit 086 LI Oklahoma City, OK | 2.0 | 2.0 | 859 | $945 | $1.10 | 22d | 1 | 0.39mi |
| 5901 S May Ave Unit 058- Up Oklahoma City, OK | 2.0 | 2.0 | 859 | $945 | $1.10 | 3d | 1 | 0.39mi |
| 5901 S May Ave Apt 38 Oklahoma City, OK | 2.0 | 2.0 | 859 | $1,288 | $1.50 | 45d | 1 | 0.39mi |
| 5901 S May Ave Unit 090 Oklahoma City, OK | 2.0 | 2.0 | 859 | $945 | $1.10 | 45d | 1 | 0.39mi |
| 5901 S May Ave Unit 006 Oklahoma City, OK | 2.0 | 2.0 | 859 | $949 | $1.10 | 45d | 1 | 0.39mi |
| 5901 S May Ave Apt 55 Oklahoma City, OK | 2.0 | 2.0 | 859 | $995 | $1.16 | 45d | 1 | 0.39mi |
| 5901 S May Ave Unit 004 VLI Up Oklahoma City, OK | 2.0 | 2.0 | 859 | $986 | $1.15 | 45d | 1 | 0.41mi |
| 2759 W I 240 Service Rd Oklahoma City, OK | 1.0–2.0 | 1.0–1.5 | 725 | $924 | $1.27 | 5d | 4 | 0.48mi |
| 5617 S May Ave Oklahoma City, OK | 1.0–3.0 | 1.5 | 1000 | $926 | $0.93 | 25d | 1 | 0.52mi |
| 2741 SW 54th Pl Oklahoma City, OK | 3.0 | 2.0 | 1059 | $1,249 | $1.18 | 3d | 1 | 0.62mi |
| 2600 W Interstate 240 Service Rd Unit 2729 Oklahoma City, OK | 2.0 | 1.5 | 1056 | $999 | $0.95 | 25d | 1 | 0.73mi |
| 2600 W Interstate 240 Service Rd Unit 2731 Oklahoma City, OK | 2.0 | 1.5 | 1056 | $999 | $0.95 | 45d | 1 | 0.73mi |
| 2801 SW 51st St Oklahoma City, OK | 2.0 | 1.0 | 840 | $1,025 | $1.22 | 3d | 1 | 0.83mi |
| 16 SW Duplex Units Oklahoma City, OK | 2.0 | 2.0 | 1000 | $1,502 | $1.50 | 5d | 5 | 0.87mi |
| 2120 SW 61st St Oklahoma City, OK | 3.0 | 1.0 | 1101 | $1,200 | $1.09 | 45d | 1 | 0.90mi |
| 2812 SW 48th St Oklahoma City, OK | 4.0 | 1.0 | 840 | $1,350 | $1.61 | 21d | 1 | 0.91mi |
| 2741 SW Murray Dr Oklahoma City, OK | 3.0 | 1.0 | 949 | $1,395 | $1.47 | 3d | 1 | 1.00mi |
| 2300 SW 74th St Oklahoma City, OK | 1.0–2.0 | 1.0–1.5 | 771 | $1,050 | $1.36 | 45d | 1 | 1.04mi |
| 2500 SW 48th St Oklahoma City, OK | 2.0 | 1.0 | 1096 | $1,050 | $0.96 | 45d | 1 | 1.11mi |
| 2412 SW 47th St Oklahoma City, OK | 3.0 | 1.0 | 638 | $1,150 | $1.80 | 25d | 1 | 1.20mi |
| 1432 SW 61st Ter Oklahoma City, OK | 3.0 | 1.5 | 891 | $1,145 | $1.29 | 45d | 1 | 1.22mi |
| 1433 SW 60th St Oklahoma City, OK | 3.0 | 2.0 | 942 | $1,400 | $1.49 | 45d | 1 | 1.23mi |
| 1402 SW 59th St Apt 1112 Oklahoma City, OK | 2.0 | 1.5 | 925 | $980 | $1.06 | 45d | 1 | 1.33mi |
| 1344 SW 62nd St Oklahoma City, OK | 3.0 | 1.0 | 878 | $1,300 | $1.48 | 4d | 1 | 1.33mi |
| 1402 SW 59th St Apt 3201 Oklahoma City, OK | 2.0 | 1.0 | 950 | $865 | $0.91 | 45d | 1 | 1.33mi |
| 1402 SW 59th St Unit 3202 Oklahoma City, OK | 2.0 | 1.0 | 950 | $865 | $0.91 | 25d | 1 | 1.33mi |
Listing history 9 events
-
2026-04-24price $110,000 327-char remark
Show marketing remark (327 chars)
Attention investors and flippers! This SW OKC property is ready for a full transformation. With a functional layout and strong upside potential, this is the perfect opportunity to add value and maximize returns. Located in an established area with convenient access to shopping, dining, and highways. Property to be sold as-is.
-
2026-03-23$120,000 Active 327-char remark
Show marketing remark (327 chars)
Attention investors and flippers! This SW OKC property is ready for a full transformation. With a functional layout and strong upside potential, this is the perfect opportunity to add value and maximize returns. Located in an established area with convenient access to shopping, dining, and highways. Property to be sold as-is.
-
2026-03-05soldstatus $60,000
-
2001-09-06soldstatus $62,000
-
2001-08-31soldstatus $61,900 278-char remark
Show marketing remark (278 chars)
Beautiful remodel. All new flooring, countertops, vanity, shower, texturing, paint, tile and painted woodwork. Heat and air appear to be recent. Siding on all trim-NO PAINTING! Oversized utility room. Modern colors just like the new homes. Must close at First American-Downtown.
-
2001-05-07$61,900 278-char remark
Show marketing remark (278 chars)
Beautiful remodel. All new flooring, countertops, vanity, shower, texturing, paint, tile and painted woodwork. Heat and air appear to be recent. Siding on all trim-NO PAINTING! Oversized utility room. Modern colors just like the new homes. Must close at First American-Downtown.
-
2001-02-23soldstatus $41,307
-
2000-10-26$45,900
-
1993-07-13soldstatus $32,000
ⓘ Source: listings_history table (triggers on properties + properties_extension) + one-shot
backfill from property_details.listing_events for pre-trigger history.
Tax reassessment forecast OK · Resets to sale price
- Current annual tax
- $1,420 · $118/mo
- Projected year-2 tax
- $1,420 · $118/mo
- Expected delta
- $0/yr ($0/mo · 0.0%)
ⓘ Screening estimate from a state-policy table — verify with the county assessor before closing.
Climate risk First Street
- Flood 1/10 Low FEMA zone X (unshaded) · 0% chance over 30 yrs
- Wildfire 4/10 Moderate
- Heat 6/10 Major 7 d/yr ≥107°F today · 19 d/yr by 30 yrs out
- Wind 3/10 Moderate 4% chance of damaging wind over 30 yrs
- Air quality 1/10 Low 0 unhealthy d/yr today · 0 by 30 yrs out
Nearby sold comps map
Loading sold comps map…
Walkable amenities ~0.75 mi
Loading nearby amenities…
Taxation est. · year 1
- Rental income
- $15,502
- − Mortgage interest
- −$6,162
- − Property taxes
- −$1,420
- − Insurance
- −$550
- − Repairs & maintenance
- −$1,240
- − Management
- −$1,240
- − Depreciation
- −$3,200
- Taxable income
- $1,690
- Est. tax owed @ 24.0%
- −$406
- After-tax cash flow
- $2,949/yr
For passive investors: Depreciation is non-cash, so a rental often shows a tax loss while cash-flowing — sheltering income. Rental losses are passive: they offset passive income freely, and up to $25,000/yr can offset ordinary (W-2) income if you actively participate and your MAGI is under $100k (phasing out to $0 by $150k); unused losses carry forward. On sale, claimed depreciation is recaptured at up to 25%, and gains may owe capital-gains tax (a 1031 exchange can defer both). Figures are a year-1 estimate at your 24.0% rate — not tax advice; consult a CPA.
Schools (NCES district)
- District
- Oklahoma City
- NCES district ID
- 4022770
- Math proficiency
- 7% ▼ -5.00%
- Reading proficiency
- 10% ▼ -6.00%
- Median HH income
- $35,606
- Composite
- 7.0/100
- National rank
- #9970
- State rank
- #254 of 270 in OK
Livability — Oklahoma City
- Score
- 80/100
- State rank
- #3
- US rank
- #1635
Category grades
Schools grade is shown separately in the Schools card above.
Census & demographics
- Census place
- Oklahoma City, OK
- County
- Oklahoma County · 771,644 people
- City population
- 498,656
- Metro
- Oklahoma City, OK
- Population (ZIP)
- 31,447
- Household income
- $54,642
- Rent vs Own
- Severe rent burden
- 1138.0
Population outlook (Oklahoma County) Hauer SSP2
- Today (2025)
- 911,875 people
- By 2030
- 982,413 · +7.7%
- By 2040
- 1,130,468 · +24.0%
- By 2050
- 1,288,422 · +41.3%
- By 2075
- 1,711,482 · +87.7%
- By 2100
- 2,088,448 · +129.0%
Race, ethnicity, and origin ACS 2023
- Neighborhood character
- Diverse neighborhood (Simpson 0.69)
- Race & ethnicity
- White 46% Hispanic / Latino 31% Two or more races 15% Black 9% Asian 5% Native American 5%
- Hispanic origin (detail)
- Mexican 27%
- Common ancestry
- Italian 2% Slovak 1% Serbian 1%
- Foreign-born
- 14% · Canada, Vietnam, Dominican Republic
- Languages at home
- 69% English-only · Spanish 24% Vietnamese 4% Other Asian/Pacific 1%
Political lean MEDSL · Oklahoma
- 2024 margin
- Toss-up / Even · D 48.0% · R 49.7% · Other 2.3%
- 2008→2024 swing
- +15.1pp toward D · 2008: -16.8pp · 2024: -1.7pp
- All cycles
- 2024: R+1.7 2020: R+1.1 2016: R+10.5 2012: R+16.7 2008: R+16.8
Not yet ingested
- Civics
- —
Market trends
- HPI YoY
- ▼ -142.40%
- Current HPI
- 245.4497
- Rent YoY
- ▲ 3.49%
- Metro
- Oklahoma City, OK
- State GDP YoY
- ▲ 1.55%
- F500 in state
- 6
Industry mix (Fortune 500 HQ in OK)
| Industry | F500 HQs | Revenue |
|---|---|---|
| Energy | 3 | $48B |
|
||
Price history
+243.8% since first listed9 events — show timeline
- 2026-04-24 Price Changed $110,000 MLSOK
- 2026-03-23 Listed $120,000 MLSOK
- 2026-03-05 Sold (Public Records) $60,000 Public Records
- 2001-09-06 Sold (Public Records) $62,000 Public Records
- 2001-08-31 Sold (MLS) $61,900 MLSOK
- 2001-05-07 Listed $61,900 MLSOK
- 2001-02-23 Sold (MLS) $41,307 MLSOK
- 2000-10-26 Listed $45,900 MLSOK
- 1993-07-13 Sold (Public Records) $32,000 Public Records
Property tax history
+4.2%/yrLatest (2025): $1,420 · +4.4% YoY. Source: county tax records.
Cash-flow waterfall
monthlySold comps — $/sqft
last 12 mo · ≤1 miLoading sold comps…