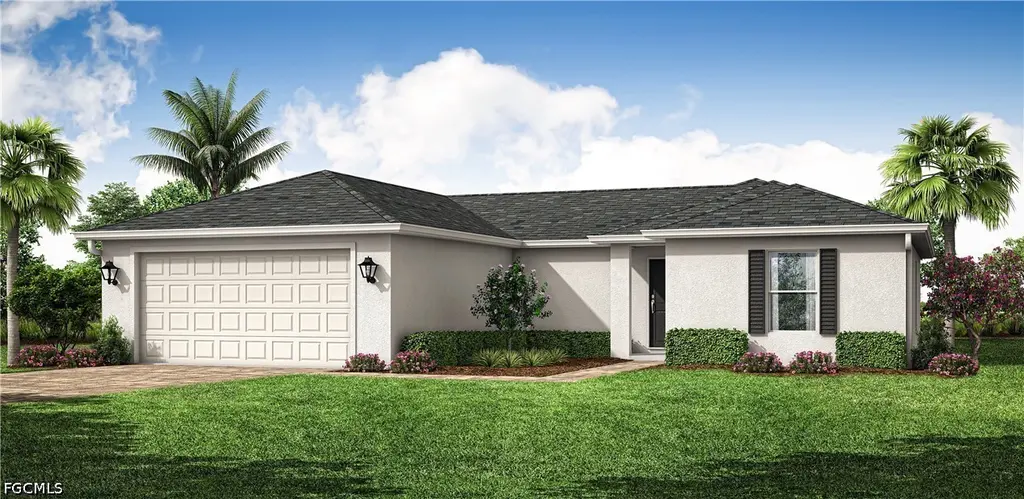
4102 NE 20th Pl · Cape Coral, FL
Flood risk 4/10 · Minor
- FEMA flood zone
- X (unshaded)
- Chance of flooding over 30 yrs
- 0.22%
- Est. flood insurance / yr
- $507 – $1,088
Fire risk 6/10 · Moderate
- Est. fire insurance / yr
- $947 – $1,759
Heat risk 10/10 · Severe
- Hot days now (above 107°F)
- 8 days/yr
- Hot days in 30 yrs
- 33 days/yr
Wind risk 10/10 · Severe
- Chance of severe wind over 30 yrs
- 99.0%
Air-quality risk 2/10 · Minimal
- Unhealthy air days now
- 1 days/yr
- Unhealthy air days in 30 yrs
- 1 days/yr
Risk factors via First Street. Map © Google.
Why this score? — see what drove the D- grade
The composite is a weighted blend of 9 inputs, each scored 0–100. Each bar is that input's sub-score; the figure is the points it added to the 100-point composite (weight × sub-score).
- Cash flow +11.4/30.0
- ARV discount +7.5/15.0
- Schools +4.1/10.0
- Livability +3.9/5.0
- DSCR +3.3/10.0
- Condition / age +2.5/5.0
- 1% rule +2.1/10.0
- Rent growth +1.1/5.0
- Appreciation +0.0/10.0
$298,990
🖨 Deal sheet (PDF) 📄 Offer letter ✓ Due diligence
Listing remarks MLS
Nice Corner Lot In Fast Growing Area.
Key facts
- Open floor plan
- Quartz countertops
- Vaulted ceilings
Tags
Property features AI
Finance
- Financial info: Pets allowed
- HOA & community: No association fee reported
Exterior
- Parking: Attached garage with 2 covered spaces and garage door opener
- Security: High impact doors
- Utilities: Cable available; Septic tank; Well water
- Home design: Single-story home; Entry level: 1; Faces northeast; Property currently under construction
- Construction: Built with block, concrete and stucco; Shingle roof
- Exterior features: Open porch; Security/high impact doors; Corner lot; Rectangular lot; Southwest exposure
Interior
- Kitchen: Dishwasher; Microwave; Range; Refrigerator
- Bedrooms: Bedrooms arranged in a split-bedroom layout
- Flooring: Carpet; Tile
- Bathrooms: 2 full bathrooms
- Heating & cooling: Central electric heating; Central electric cooling (air conditioning)
- Interior features: High ceilings; Living/dining room; Pantry; Cable TV; Walk-in closet(s); Split bedrooms; Unfurnished; Single hung windows with impact glass
- Laundry & utility: Washer (installed); Laundry room located inside
Neighborhood map
What this means for you Summary
Snapshot
- This is a 4-bed/2.0-bath land listed at $299k.
Deal economics
- At list price, monthly cash flow is $-105 ($-1k/yr) — negative.
- To cash-flow at today's rent, offer at most $280k (6.2% below list).
- To meet the 1% rule (rent ≥ 1% of price), the offer needs to be $213k (28.8% below list).
- Recommended offer: $213k (28.8% below list) — sets the bar for 1% rule.
- Cap rate 5.9% vs local median 3.1% in Cape Coral — top-decile yield for the area; either an underpriced asset or a hidden risk that comps aren't pricing in. Stress-test before assuming the spread holds.
Location & tenants
- Location reads 77/100 on livability (#208 in FL, #3,098 nationally) — a middle-class / working-renter tenant base. Strengths: housing A+, health & safety A+, amenities B+; Watch: commute F.
- Lee (suburban): math 47% / reading 50% proficiency, ranked #42 of 73 in FL (top 58%) — families likely to look elsewhere, expect single-tenant / working-renter base with shorter leases.
- Zoned schools: Diplomat Elementary School (math 67% / reading 60%, grade B, #564 of 2,144 statewide, top 27%, 1,069 students, 56% FRL); Mariner Middle School (math 50% / reading 47%, grade C-, #274 of 571 statewide, top 50%, 1,001 students, 53% FRL); Ida S. Baker High School (math 44% / reading 47%, grade D-, #223 of 667 statewide, top 34%, 1,933 students, 39% FRL).
- Market conditions: Rents falling (-5.6%/yr); 1604 active listings in the ZIP; 32 comparable units currently listed for rent nearby; rentals at typical pace (median 18d on market — plan ~3-4 weeks tenant-placement turnaround); 15,411 units permitted in Lee County in 2024 (4,686 in 5+ unit buildings).
- This rent runs 35% of the median local income ($73k/yr) — at the standard rent-burdened threshold; future hikes will face affordability resistance.
Forward outlook
- Local home prices are declining (-3.0%/yr); year-one equity from $2k of loan paydown is wiped out by about $9k of value loss. Plan a longer hold.
- Lee County population projected at +44% by 2050 — long-run rental-demand tailwind backs the buy-and-hold thesis.
Negotiation context
- It's been on market 50 days — a 3% lower offer ($290k) is reasonable based on typical stale-listing flexibility.
- Current owner paid $40k; list at $299k implies a 657% gain — meaningful room to come down on a strong offer.
Risks & watch-outs
- Climate carrying-cost: severe wind risk, 99% chance of damaging wind over 30y; major wildfire risk; extreme-heat days projected 8→33/yr by 2055 (HVAC capex compounding) — expect insurance premiums to compound above CPI over the hold.
Questions for the listing agent
- What do current leases actually rent for vs. the listed asking? Can we see a recent rent roll and the last 12 months of T-12 income?
- It's been on market 50 days. Have you received any prior offers? Is the seller open to a 29% concession, seller financing, or rate buy-down credit?
- Is there a deadline driving the sale (1031 exchange, divorce, estate, relocation)? That informs how much negotiation room exists.
- Schools are B-rated — typically a magnet for longer-tenancy family renters. What's the average tenant stay here, and is there a school-zone premium baked into asking?
- The area grade is low — what's the realistic commute time and amenity access for the typical tenant pool here? Any planned neighborhood developments (good or bad) we should know about?
- What's the average days-on-market for RENTAL listings here right now (not sales)? A rising rental-DOM trend means longer vacancies and softer asking-rent achievability than the comps imply.
- What's the recent tenant-quality profile in this submarket — average credit score on applications, eviction rate, late-payment / NSF rate, and stable-employment percentage? A property-management company in the area should have these aggregated.
- How much new for-sale + rental construction is in the pipeline within 1–3 miles? Heavy new supply typically softens prices + rents 12–24 months out; constrained supply supports both.
Investment metrics
- 1% rule
- 0.71% ✗
- Cap rate
- 5.87%
- Cash-on-cash
- -1.51%
- DSCR
- 0.93
- GRM
- 11.7
CMA / ARV
No comps found within radius.
Projected returns pro-forma
-3.0% appreciation · 0.0% rent growth · sell at horizon
- IRR
- -21.8%
- Equity multiple
- 0.27×
- Total profit
- $-61,530
- Equity at exit
- $44,580
- IRR
- -23.5%
- Equity multiple
- -0.04×
- Total profit
- $-86,881
- Equity at exit
- $25,851
Cash invested: $83,717 (down + closing). Projections, not guarantees.
Landlord ↔ Tenant lean methodology
- Overall (STATE)
- 87 Strongly Landlord-Friendly
- State Florida
- 87 Strongly Landlord-Friendly · R+3
- County
- — inherits STATE
- City
- — inherits STATE
ZIP-level market 33909
- Home prices YoY
- -23.1%
- Rents YoY
- -5.6%
- Active inventory
- 1604
- Price-to-rent
- 11.7×
Monthly cashflow live
- Estimated rent
- $2,128 high interval (Pro) →
- Mortgage (P&I)
- −$1,568
- Tax from tax record
- −$94 /mo · $1,125/yr
- Insurance
- −$125
- HOA
- −$0
- Vacancy / Maint / Mgmt
- −$447
- Net cashflow
- $-105
Break-even live
Sensitivity live
| Price | -10% $64 | -5% $-21 | +0% $-105 | +5% $-190 | +10% $-275 |
|---|---|---|---|---|---|
| Rent | -10% $-273 | -5% $-189 | +0% $-105 | +5% $-21 | +10% $63 |
| Rate | -1.0pp $45 | -0.5pp $-29 | base $-105 | +0.5pp $-183 | +1.0pp $-262 |
UW: 25.0% down · 7.5% · 30yr · 1.5% tax · 5.0% vac · 8.0% maint · 8.0% mgmt
Financing live
Cash to close
- Down payment
- $74,748
- Closing costs
- $8,970
- Reserves months
- —
- Total cash needed
- —
Loan-product check · same deal, 3 products live
Conventional
25% down · 7.5% · 30yr
- Down + closing
- —
- Monthly P&I
- —
- Monthly cashflow
- —
- DSCR
- —
- Eligible?
- —
Personal DTI + credit; lowest rate.
DSCR
20% down · 8.5% · 30yr
- Down + closing
- —
- Monthly P&I
- —
- Monthly cashflow
- —
- DSCR
- —
- Eligible?
- —
No personal income docs; deal must DSCR.
Hard money
10% down · 12.0% · 12mo
- Down + closing
- —
- Monthly P&I
- —
- Monthly cashflow
- —
- DSCR
- —
- Eligible?
- —
Short-term bridge; refi at stabilization.
Rent comps 32 comps
| Address | Beds | Baths | Sqft | Rent | $/sqft | DOM | Units | Dist |
|---|---|---|---|---|---|---|---|---|
| 2117 NE 40th St Cape Coral, FL | 3.0 | 3.0 | 1776 | $2,100 | $1.18 | 18d | 1 | 0.16mi |
| 4141 NE 19th Pl Cape Coral, FL | 4.0 | 2.0 | 1734 | $1,995 | $1.15 | 16d | 1 | 0.20mi |
| 4215 E Gator Cir Cape Coral, FL | 3.0 | 2.0 | 1385 | $1,725 | $1.25 | 5d | 1 | 0.30mi |
| 4309 NE 20th Ct Cape Coral, FL | 4.0 | 2.0 | 1774 | $2,000 | $1.13 | 23d | 1 | 0.37mi |
| 3928 NE 17th Ave Cape Coral, FL | 4.0 | 3.0 | 1683 | $2,100 | $1.25 | 25d | 1 | 0.43mi |
| 4020 Garden Blvd Cape Coral, FL | 4.0 | 2.0 | 1650 | $1,845 | $1.12 | 23d | 1 | 0.48mi |
| 4125 NE 15th Pl Cape Coral, FL | 3.0 | 2.0 | 1556 | $2,000 | $1.29 | 25d | 1 | 0.52mi |
| 3622 NE 19th Ave Cape Coral, FL | 3.0 | 2.0 | 1286 | $2,480 | $1.93 | 25d | 1 | 0.58mi |
| 1701 NE 44th Ter Cape Coral, FL | 3.0 | 2.0 | 1147 | $1,800 | $1.57 | 18d | 1 | 0.60mi |
| 1701 NE 44th Ter Cape Coral, FL | 3.0 | 2.0 | 1147 | $1,800 | $1.57 | 16d | 1 | 0.60mi |
| 3603 NE 19th Ave Cape Coral, FL | 3.0 | 2.0 | 1147 | $1,750 | $1.53 | 5d | 1 | 0.64mi |
| 3527 NE 19th Pl Cape Coral, FL | 3.0 | 2.0 | 1574 | $2,000 | $1.27 | 25d | 1 | 0.65mi |
| 1518 NE 43rd Ln Cape Coral, FL | 4.0 | 2.0 | 1756 | $2,200 | $1.25 | 18d | 1 | 0.69mi |
| 4421 NE 15th Pl Cape Coral, FL | 3.0 | 2.0 | 1240 | $2,000 | $1.61 | 25d | 1 | 0.71mi |
| 19152 Meadowbrook Ct North Fort Myers, FL | 3.0 | 2.0 | 1251 | $1,499 | $1.20 | 4d | 1 | 0.71mi |
| 3512 NE 17th Pl Cape Coral, FL | 4.0 | 3.0 | 1650 | $1,995 | $1.21 | 5d | 1 | 0.83mi |
| 3511 NE 17th Ave Cape Coral, FL | 4.0 | 2.0 | 1717 | $2,350 | $1.37 | 21d | 1 | 0.86mi |
| 2434 Laurentina Ln Cape Coral, FL | 3.0 | 2.5 | 1744 | $1,975 | $1.13 | 25d | 1 | 0.88mi |
| 3717 NE 13th Ave Cape Coral, FL | 3.0 | 2.0 | 1408 | $1,795 | $1.27 | 18d | 1 | 0.89mi |
| 19414 Bermuda Ct North Fort Myers, FL | 3.0 | 2.0 | 1251 | $1,499 | $1.20 | 4d | 1 | 0.91mi |
| 19421 Bermuda Ct North Fort Myers, FL | 3.0 | 2.0 | 1198 | $1,499 | $1.25 | 4d | 1 | 0.93mi |
| 19477 Bermuda Ct North Fort Myers, FL | 3.0 | 2.0 | 1460 | $1,499 | $1.03 | 4d | 1 | 0.97mi |
| 1532 NE 35th St Cape Coral, FL | 4.0 | 2.0 | 1809 | $1,995 | $1.10 | 25d | 1 | 0.99mi |
| 3732 NE 12th Pl Cape Coral, FL | 3.0 | 2.0 | 1408 | $1,950 | $1.38 | 25d | 1 | 1.00mi |
| 2217 NE 33rd Ln Cape Coral, FL | 3.0 | 2.0 | 1706 | $2,650 | $1.55 | 25d | 1 | 1.11mi |
| 19621 N Tamiami Trl North Fort Myers, FL | 3.0 | 2.0 | 1205 | $1,300 | $1.08 | 25d | 1 | 1.17mi |
| 4028 NE 10th Pl Cape Coral, FL | 3.0 | 2.0 | 1850 | $2,146 | $1.16 | 5d | 1 | 1.19mi |
| 2213 NE 33rd St Cape Coral, FL | 3.0 | 2.0 | 1385 | $1,800 | $1.30 | 25d | 1 | 1.24mi |
| 4109 NE 9th Pl Cape Coral, FL | 3.0 | 2.0 | 1690 | $1,835 | $1.09 | 5d | 1 | 1.28mi |
| 3804 NE 9th Pl Cape Coral, FL | 4.0 | 3.0 | 1683 | $1,995 | $1.19 | 16d | 1 | 1.33mi |
| 3462 NE 10th Pl Cape Coral, FL | 4.0 | 3.0 | 1665 | $3,000 | $1.80 | 25d | 1 | 1.43mi |
| 3610 NE 9th Pl Cape Coral, FL | 4.0 | 2.0 | 1774 | $1,995 | $1.12 | 16d | 1 | 1.45mi |
Listing history 13 events
-
2026-06-02statusdays on market $298,990 Pending 50 DOM
-
2026-06-01days on market $298,990 Active 49 DOM
-
2026-05-31days on market $298,990 Active 48 DOM
-
2026-05-13price $301,990
-
2026-04-13$304,990 Active
-
2025-12-04soldstatus $39,500
-
2025-11-24soldstatus $136,000
-
2022-04-28soldstatus $4,356,100
-
2021-12-10soldstatus $108,000
-
2009-11-17soldstatus $85,500
-
2009-10-28soldstatus $5,500
-
2005-03-01soldstatus $56,000
-
2005-02-14soldstatus $56,000 37-char remark
Show marketing remark (37 chars)
Nice Corner Lot In Fast Growing Area.
ⓘ Source: listings_history table (triggers on properties + properties_extension) + one-shot
backfill from property_details.listing_events for pre-trigger history.
Tax reassessment forecast FL · Resets to sale price
- Current annual tax
- $1,125 · $94/mo
- Projected year-2 tax
- $2,482 · $207/mo
- Expected delta
- +$1,357/yr (+$113/mo · 120.6%)
ⓘ Screening estimate from a state-policy table — verify with the county assessor before closing.
Climate risk First Street
- Flood 4/10 Moderate FEMA zone X (unshaded) · 22% chance over 30 yrs
- Wildfire 6/10 Major
- Heat 10/10 Extreme 8 d/yr ≥107°F today · 33 d/yr by 30 yrs out
- Wind 10/10 Extreme 99% chance of damaging wind over 30 yrs
- Air quality 2/10 Low 1 unhealthy d/yr today · 1 by 30 yrs out
Nearby sold comps map
Loading sold comps map…
Walkable amenities ~0.75 mi
Loading nearby amenities…
Taxation est. · year 1
- Rental income
- $25,534
- − Mortgage interest
- −$16,748
- − Property taxes
- −$1,125
- − Insurance
- −$1,495
- − Repairs & maintenance
- −$2,043
- − Management
- −$2,043
- − Depreciation
- −$8,698
- Taxable loss
- −$6,617
- Est. tax savings @ 24.0%
- +$1,588
- After-tax cash flow
- $325/yr
For passive investors: Depreciation is non-cash, so a rental often shows a tax loss while cash-flowing — sheltering income. Rental losses are passive: they offset passive income freely, and up to $25,000/yr can offset ordinary (W-2) income if you actively participate and your MAGI is under $100k (phasing out to $0 by $150k); unused losses carry forward. On sale, claimed depreciation is recaptured at up to 25%, and gains may owe capital-gains tax (a 1031 exchange can defer both). Figures are a year-1 estimate at your 24.0% rate — not tax advice; consult a CPA.
Schools (NCES district)
- District
- Lee
- NCES district ID
- 1201080
- Math proficiency
- 47% ▼ -11.00%
- Reading proficiency
- 50% ▼ -4.00%
- Median HH income
- $49,518
- Composite
- 41.49/100
- National rank
- #3458
- State rank
- #42 of 73 in FL
Livability — Cape Coral
- Score
- 77/100
- State rank
- #208
- US rank
- #3098
Category grades
Schools grade is shown separately in the Schools card above.
Census & demographics
- Census place
- Cape Coral, FL
- County
- Lee County · 788,662 people
- City population
- 217,388
- Metro
- Cape Coral-Fort Myers, FL
- Population (ZIP)
- 40,231
- Household income
- $73,053
- Rent vs Own
- Severe rent burden
- 1657.0
Population outlook (Lee County) Hauer SSP2
- Today (2025)
- 871,946 people
- By 2030
- 955,468 · +9.6%
- By 2040
- 1,113,587 · +27.7%
- By 2050
- 1,256,891 · +44.1%
- By 2075
- 1,560,270 · +78.9%
- By 2100
- 1,726,848 · +98.0%
Race, ethnicity, and origin ACS 2023
- Neighborhood character
- Diverse neighborhood (Simpson 0.55)
- Race & ethnicity
- White 56% Hispanic / Latino 36% Two or more races 24% Black 3% Asian 1%
- Hispanic origin (detail)
- Puerto Rican 7% Cuban 14% Dominican 4%
- Common ancestry
- Romanian 2% Lithuanian 2% Serbian 1%
- Foreign-born
- 20% · Canada, Jamaica
- Languages at home
- 69% English-only · Spanish 27% Other Indo-European 1% German/W. Germanic 1%
Political lean MEDSL · Lee
- 2024 margin
- Strong R (+28.4) · D 35.5% · R 63.9%
- 2008→2024 swing
- -18.0pp toward R · 2008: -10.4pp · 2024: -28.4pp
- All cycles
- 2024: R+28.4 2020: R+19.2 2016: R+20.4 2012: R+16.6 2008: R+10.4
Not yet ingested
- Civics
- —
Market trends
- HPI YoY
- ▼ -94.24%
- Current HPI
- 313.8761
- Rent YoY
- ▼ -5.60%
- Metro
- Cape Coral-Fort Myers, FL
- State GDP YoY
- ▲ 3.28%
- F500 in state
- 36
Industry mix (Fortune 500 HQ in FL)
| Industry | F500 HQs | Revenue |
|---|---|---|
| Industrial Technology | 2 | $29B |
|
||
| Insurance | 2 | $17B |
|
||
| Retail | 1 | $60B |
|
||
| Technology Distribution | 1 | $58B |
|
||
| Homebuilding | 1 | $35B |
|
||
| Technology Manufacturing | 1 | $35B |
|
||
Price history
+439.3% since first listed10 events — show timeline
- 2026-05-13 Price Changed $301,990 FORTMLS
- 2026-04-13 Listed $304,990 FORTMLS
- 2025-12-04 Sold (Public Records) $39,500 Public Records
- 2025-11-24 Sold (Public Records) $136,000 Public Records
- 2022-04-28 Sold (Public Records) $4,356,100 Public Records
- 2021-12-10 Sold (Public Records) $108,000 Public Records
- 2009-11-17 Sold (Public Records) $85,500 Public Records
- 2009-10-28 Sold (Public Records) $5,500 Public Records
- 2005-03-01 Sold (Public Records) $56,000 Public Records
- 2005-02-14 Sold (MLS) $56,000 FORTMLS
Property tax history
+11.6%/yrLatest (2025): $1,125 · +10.3% YoY. Source: county tax records.
Cash-flow waterfall
monthlySold comps — $/sqft
last 12 mo · ≤1 miLoading sold comps…