2399 NW 34th Pl · Lake Panasoffkee, FL
Flood risk 1/10 · Minimal
- FEMA flood zone
- AE
- Chance of flooding over 30 yrs
- 0.0%
- Est. flood insurance / yr
- $1,737 – $8,500
Fire risk 3/10 · Minor
- Est. fire insurance / yr
- $947 – $1,759
Heat risk 8/10 · Major
- Hot days now (above 108°F)
- 7 days/yr
- Hot days in 30 yrs
- 23 days/yr
Wind risk 9/10 · Severe
- Chance of severe wind over 30 yrs
- 99.0%
Air-quality risk 3/10 · Minor
- Unhealthy air days now
- 2 days/yr
- Unhealthy air days in 30 yrs
- 3 days/yr
Risk factors via First Street. Map © Google.
Why this score? — see what drove the C- grade
The composite is a weighted blend of 9 inputs, each scored 0–100. Each bar is that input's sub-score; the figure is the points it added to the 100-point composite (weight × sub-score).
- Cash flow +17.5/30.0
- Appreciation +7.5/10.0
- ARV discount +6.2/15.0
- DSCR +5.5/10.0
- Schools +5.2/10.0
- 1% rule +4.0/10.0
- Livability +3.6/5.0
- Rent growth +2.5/5.0
- Condition / age +2.5/5.0
$175,000
🖨 Deal sheet 📄 Offer letter ✓ Due diligence
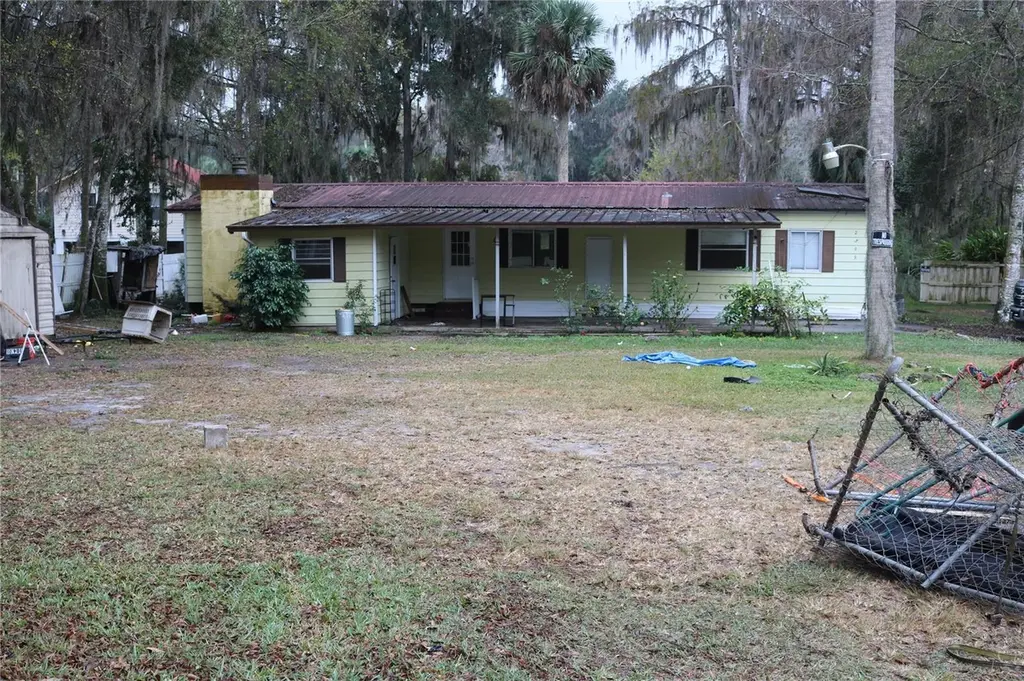
Listing remarks
Unlock incredible equity with this rare waterfront fixer-upper! Situated on a massive 0.89-acre lot, this 3-bedroom, 2-bathroom mobile home offers 1,440 square feet of living space waiting for your personal touch. This property is a true handyman special, perfect for investors, contractors, or DIY enthusiasts looking to build sweat equity. The standout feature is the 105.2 feet of canal frontage, offering direct water access to the famous fishing grounds of Lake Panasoffkee. Bring your tools, your vision, and your water toys to transform this hidden gem into your ultimate fish camp, vacation rental, or permanent peaceful retreat. Properties with this much acreage and waterfront potential do
Key facts
- Massive lot
- Canal frontage
- Direct water access
Tags
Property features AI
Finance
- Other: Lot size approximately 0.89 acres (0.5 to less than 1 acre)
- Financial info: No home warranty indicated
Exterior
- Parking: Carport (1 space)
- Utilities: Public water; Septic tank sewer; Electricity connected; Water connected
- Home design: Manufactured home (double wide); One story; Fixer condition; North-facing
- Construction: Metal siding; Metal roof; Pillar/Post/Pier foundation; Built as a double wide manufactured home
- Exterior features: Sliding doors; Storage; Oak trees on property; Dirt road access (public maintained road)
Interior
- Kitchen: Range; Refrigerator
- Bedrooms: 3 bedrooms
- Flooring: Vinyl
- Bathrooms: 2 full bathrooms
- Heating & cooling: Central heating; Ductless heating; Central air conditioning
- Interior features: Ceiling fans; Sliding doors; Storage
- Laundry & utility: No laundry room (none)
Neighborhood map
What this means for you Summary
Snapshot
- This is a 3-bed/2.0-bath manufactured listed at $175k.
Deal economics
- At list price, monthly cash flow is $-292 ($-4k/yr) — negative.
- To cash-flow at today's rent, offer at most $123k (29.5% below list).
- To meet the 1% rule (rent ≥ 1% of price), the offer needs to be $157k (10.3% below list).
- Recommended offer: $123k (29.5% below list) — sets the bar for cash-flow.
- Cap rate 7.2% vs local median 5.1% in Lake Panasoffkee — top-decile yield for the area; either an underpriced asset or a hidden risk that comps aren't pricing in. Stress-test before assuming the spread holds.
Location & tenants
- Location reads 72/100 on livability (#332 in FL) — a middle-class / working-renter tenant base. Strengths: cost of living A+, housing A+, health & safety A+; Watch: amenities F, commute F, employment D-.
- Sumter (rural): math 61% / reading 61% proficiency, ranked #11 of 73 in FL (top 15%) — acceptable for families but not a draw, mixed tenant base, ~2y average lease.
- Market conditions: 86 active listings in the ZIP; 3,961 units permitted in Sumter County in 2024 (248 in 5+ unit buildings).
Forward outlook
- In year one you build about $10k of equity ($1k loan paydown + $9k appreciation (5.0% local appreciation)).
- Sumter County population projected at +45% by 2050 — long-run rental-demand tailwind backs the buy-and-hold thesis.
- By year 4, paydown + projected appreciation supports a ~$34k cash-out refi (75% LTV) — recoverable capital for the next deal without selling this one.
Negotiation context
- It's been on market 32 days — a 3% lower offer ($170k) is reasonable based on typical stale-listing flexibility.
Risks & watch-outs
- Watch-outs: flood insurance adds $427/mo.
- Climate carrying-cost: in FEMA flood zone AE (mandatory federal flood insurance); severe wind risk, 99% chance of damaging wind over 30y; extreme-heat days projected 7→23/yr by 2055 (HVAC capex compounding) — expect insurance premiums to compound above CPI over the hold.
Questions for the listing agent
- What do current leases actually rent for vs. the listed asking? Can we see a recent rent roll and the last 12 months of T-12 income?
- It's been on market 32 days. Have you received any prior offers? Is the seller open to a 30% concession, seller financing, or rate buy-down credit?
- Built in 1979 — when were the roof, HVAC, electrical panel, plumbing, and water heater last replaced?
- What's the actual annual flood-insurance premium (NFIP or private), and is the property in a SFHA with mandatory coverage?
- Is there a deadline driving the sale (1031 exchange, divorce, estate, relocation)? That informs how much negotiation room exists.
- What's the average days-on-market for RENTAL listings here right now (not sales)? A rising rental-DOM trend means longer vacancies and softer asking-rent achievability than the comps imply.
- What's the recent tenant-quality profile in this submarket — average credit score on applications, eviction rate, late-payment / NSF rate, and stable-employment percentage? A property-management company in the area should have these aggregated.
- How much new for-sale + rental construction is in the pipeline within 1–3 miles? Heavy new supply typically softens prices + rents 12–24 months out; constrained supply supports both.
Investment metrics
- 1% rule
- 0.90% ✗
- Cap rate
- 7.21%
- Cash-on-cash
- 3.29%
- DSCR
- 1.15
- GRM
- 9.3
CMA / ARV
- ARV (on-the-fly)
- $169,920
- Comps found
- 4
Show comp detail 4 sales within ~0.75 mi
| Address | Dist | Beds/Ba | Sqft | Sold | Price | $/sf | Match |
|---|---|---|---|---|---|---|---|
| 3786 CR 405n | 0.31mi | 3/2.0 | 1,440 (0%) | 2mo | $169,900 | $118 | 84 |
| 3809 CR 405n | 0.38mi | 3/2.0 | 1,420 (-1%) | 3mo | $70,000 | $49 | 77 |
| 2890 CR 426e | 0.61mi | 3/2.0 | 1,387 (-4%) | 3mo | $194,900 | $141 | 63 |
| 2506 CR 405 | 0.29mi | 3/2.0 | 1,568 (+9%) | 13mo | $90,000 | $57 | 61 |
Match score weights: distance 35% · size 25% · config 20% · recency 20%. Top-matched comps best support the ARV.
Projected returns pro-forma
4.99% appreciation · 3.0% rent growth · sell at horizon
- IRR
- 6.9%
- Equity multiple
- 1.45×
- Total profit
- $21,815
- Equity at exit
- $99,036
- IRR
- 9.1%
- Equity multiple
- 2.68×
- Total profit
- $82,561
- Equity at exit
- $170,813
Cash invested: $49,000 (down + closing). Projections, not guarantees.
Landlord ↔ Tenant lean methodology
- Overall (STATE)
- 87 Strongly Landlord-Friendly
- State Florida
- 87 Strongly Landlord-Friendly · R+3
- County
- — inherits STATE
- City
- — inherits STATE
ZIP-level market 33538
- Home prices YoY
- 1.5%
- Active inventory
- 86
- Price-to-rent
- 9.3×
Monthly cashflow live
- Estimated rent
- $1,570 medium interval (Pro) →
- Mortgage (P&I)
- −$918
- Tax from tax record
- −$115 /mo · $1,383/yr
- Insurance
- −$73
- Flood insurance flood zone
- −$427 /mo · $5,118/yr
- HOA
- −$0
- Vacancy / Maint / Mgmt
- −$330
- Net cashflow
- $-292
Break-even live
UW: 25.0% down · 7.5% · 30yr · 1.5% tax · 5.0% vac · 8.0% maint · 8.0% mgmt
Financing live
Cash to close
- Down payment
- $43,750
- Closing costs
- $5,250
- Reserves months
- —
- Total cash needed
- —
Loan-product check · same deal, 3 products live
Conventional
25% down · 7.5% · 30yr
- Down + closing
- —
- Monthly P&I
- —
- Monthly cashflow
- —
- DSCR
- —
- Eligible?
- —
Personal DTI + credit; lowest rate.
DSCR
20% down · 8.5% · 30yr
- Down + closing
- —
- Monthly P&I
- —
- Monthly cashflow
- —
- DSCR
- —
- Eligible?
- —
No personal income docs; deal must DSCR.
Hard money
10% down · 12.0% · 12mo
- Down + closing
- —
- Monthly P&I
- —
- Monthly cashflow
- —
- DSCR
- —
- Eligible?
- —
Short-term bridge; refi at stabilization.
Listing history 16 events
-
2026-06-19days on market $175,000 Active 32 DOM
-
2026-06-18days on market $175,000 Active 31 DOM
-
2026-06-17days on market $175,000 Active 30 DOM
-
2026-06-16days on market $175,000 Active 29 DOM
-
2026-06-15days on market $175,000 Active 28 DOM
-
2026-06-14days on market $175,000 Active 26 DOM
-
2026-06-13days on market $175,000 Active 25 DOM
-
2026-06-10days on market $175,000 Active 23 DOM
-
2026-06-09days on market $175,000 Active 22 DOM
-
2026-06-08days on market $175,000 Active 21 DOM
-
2026-06-07days on market $175,000 Active 20 DOM
-
2026-06-02days on market $175,000 Active 15 DOM
-
2026-06-01days on market $175,000 Active 14 DOM
-
2026-05-31days on market $175,000 Active 13 DOM
-
2026-05-30days on market $175,000 Active 12 DOM
-
2026-05-18$175,000 Active
ⓘ Source: listings_history table (triggers on properties + properties_extension) + one-shot
backfill from property_details.listing_events for pre-trigger history.
Tax reassessment forecast FL · Resets to sale price
- Current annual tax
- $1,383 · $115/mo
- Projected year-2 tax
- $1,452 · $121/mo
- Expected delta
- +$69/yr (+$6/mo · 5.0%)
ⓘ Screening estimate from a state-policy table — verify with the county assessor before closing.
Climate risk First Street
- Flood 1/10 Low FEMA zone AE · 0% chance over 30 yrs
- Wildfire 3/10 Moderate
- Heat 8/10 Severe 7 d/yr ≥108°F today · 23 d/yr by 30 yrs out
- Wind 9/10 Extreme 99% chance of damaging wind over 30 yrs
- Air quality 3/10 Moderate 2 unhealthy d/yr today · 3 by 30 yrs out
Nearby sold comps map
Loading sold comps map…
Walkable amenities ~0.75 mi
Loading nearby amenities…
Taxation est. · year 1
- Rental income
- $18,838
- − Mortgage interest
- −$9,803
- − Property taxes
- −$1,383
- − Insurance
- −$5,994
- − Repairs & maintenance
- −$1,507
- − Management
- −$1,507
- − Depreciation
- −$5,091
- Taxable loss
- −$6,447
- Est. tax savings @ 24.0%
- +$1,547
- After-tax cash flow
- $-1,960/yr
For passive investors: Depreciation is non-cash, so a rental often shows a tax loss while cash-flowing — sheltering income. Rental losses are passive: they offset passive income freely, and up to $25,000/yr can offset ordinary (W-2) income if you actively participate and your MAGI is under $100k (phasing out to $0 by $150k); unused losses carry forward. On sale, claimed depreciation is recaptured at up to 25%, and gains may owe capital-gains tax (a 1031 exchange can defer both). Figures are a year-1 estimate at your 24.0% rate — not tax advice; consult a CPA.
Schools (NCES district)
- District
- Sumter
- NCES district ID
- 1201800
- Math proficiency
- 61% ▼ -4.00%
- Reading proficiency
- 61% ▼ -2.00%
- Median HH income
- $48,240
- Composite
- 51.74/100
- National rank
- #1682
- State rank
- #11 of 73 in FL
Livability — Lake Panasoffkee
- Score
- 72/100
- State rank
- #332
- US rank
- #5777
Category grades
Schools grade is shown separately in the Schools card above.
Census & demographics
- Census place
- Lake Panasoffkee, FL
- Population (ZIP)
- 5,748
Population outlook (Sumter County) Hauer SSP2
- Today (2025)
- 161,172 people
- By 2030
- 180,083 · +11.7%
- By 2040
- 209,892 · +30.2%
- By 2050
- 234,186 · +45.3%
- By 2075
- 284,602 · +76.6%
- By 2100
- 317,039 · +96.7%
Race, ethnicity, and origin ACS 2023
- Neighborhood character
- Predominantly White (87%)
- Race & ethnicity
- White 87% Black 7% Hispanic / Latino 3% Two or more races 3%
- Common ancestry
- Lithuanian 2% Slovak 1% Italian 1%
- Foreign-born
- 1% · Canada
Political lean MEDSL · Sumter
- 2024 margin
- Solid R (+37.6) · D 30.9% · R 68.6%
- 2008→2024 swing
- -10.6pp toward R · 2008: -27.0pp · 2024: -37.6pp
- All cycles
- 2024: R+37.6 2020: R+36.1 2016: R+39.2 2012: R+34.9 2008: R+27.0
Not yet ingested
- Civics
- —
Market trends
- HPI YoY
- ▲ 4.99%
- Current HPI
- 329.8431
- Rent YoY
- —
- Metro
- —
- State GDP YoY
- ▲ 3.28%
- F500 in state
- 36
Industry mix (Fortune 500 HQ in FL)
| Industry | F500 HQs | Revenue |
|---|---|---|
| Industrial Technology | 2 | $29B |
|
||
| Insurance | 2 | $17B |
|
||
| Retail | 1 | $60B |
|
||
| Technology Distribution | 1 | $58B |
|
||
| Homebuilding | 1 | $35B |
|
||
| Technology Manufacturing | 1 | $35B |
|
||
Price history
1 event — show timeline
- 2026-05-18 Listed $175,000 Stellar MLS as Distributed by MLS Grid
Property tax history
+4.7%/yrLatest (2025): $1,383 · +4.3% YoY. Source: county tax records.
Cash-flow waterfall
monthlySold comps — $/sqft
last 12 mo · ≤1 miLoading sold comps…