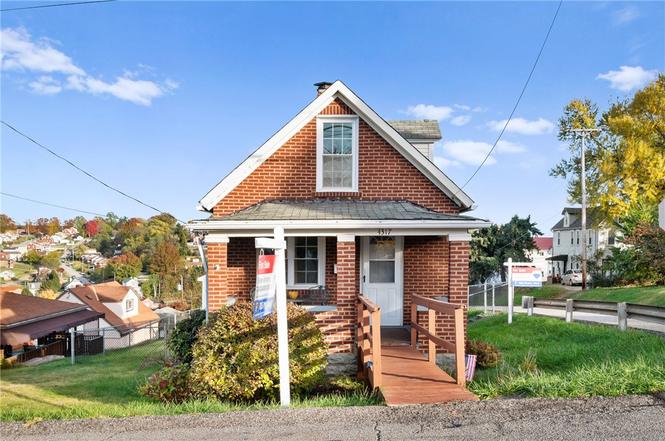
4317 Home St · West Mifflin, PA
Flood risk 1/10 · Minimal
- FEMA flood zone
- X (unshaded)
- Chance of flooding over 30 yrs
- 0.0%
- Est. flood insurance / yr
- $473 – $860
Fire risk 1/10 · Minimal
- Est. fire insurance / yr
- $511 – $949
Heat risk 4/10 · Minor
- Hot days now (above 97°F)
- 7 days/yr
- Hot days in 30 yrs
- 17 days/yr
Wind risk 2/10 · Minimal
- Chance of severe wind over 30 yrs
- —
Air-quality risk 4/10 · Minor
- Unhealthy air days now
- 4 days/yr
- Unhealthy air days in 30 yrs
- 5 days/yr
Risk factors via First Street. Map © Google.
Why this score? — see what drove the B- grade
The composite is a weighted blend of 9 inputs, each scored 0–100. Each bar is that input's sub-score; the figure is the points it added to the 100-point composite (weight × sub-score).
- Cash flow +30.0/30.0
- DSCR +10.0/10.0
- 1% rule +9.4/10.0
- ARV discount +7.6/15.0
- Livability +3.7/5.0
- Schools +2.6/10.0
- Rent growth +2.5/5.0
- Condition / age +2.5/5.0
- Appreciation +0.0/10.0
$89,900
🖨 Deal sheet 📄 Offer letter ✓ Due diligence
Listing remarks
Welcome to 4317 Home Street in West Mifflin — a charming, solid brick home situated on a peaceful corner lot. This property offers easy ramp access to the main level, making entry effortless and convenient. Inside, you’ll find a comfortable one-bedroom, one-bath layout that’s ideal for low-maintenance living or a perfect first-time investment. The attic space provides generous storage or the potential to create an additional bedroom, office, or hobby area. Outside, enjoy a beautiful fenced-in yard that’s perfect for pets, gardening, or relaxing evenings outdoors. Quiet setting, classic brick construction, and space to make it your own — come see the possibiliti
Key facts
- Attic space
- Ramp access
- Fenced-in yard
Tags
Property features AI
Finance
- HOA & community: Public transportation access
Exterior
- Parking: On-street parking
- Utilities: Public water; Public sewer
- Home design: 2-story; Resale property
- Construction: Brick construction; Asphalt roof
- Exterior features: On-street parking
Interior
- Kitchen: Refrigerator; Stove
- Flooring: Vinyl flooring; Carpet
- Bathrooms: 1 full bathroom
- Heating & cooling: Gas heating; Central air conditioning
- Interior features: Screens on windows; Walk-out basement
- Laundry & utility: Washer; Dryer
Neighborhood map
What this means for you Summary
Snapshot
- This is a 1-bed/1.0-bath single-family listed at $90k.
Deal economics
- At list price, monthly cash flow is $379 ($5k/yr) — positive.
- The deal already cash-flows at list — no discount required.
- Meets the 1% rule at list price ($1k rent vs $90k).
- Recommended offer: $79k (12.0% below list) — sets the bar for market timing.
- Cap rate 11.4% vs local median 5.2% in West Mifflin — top-decile yield for the area; either an underpriced asset or a hidden risk that comps aren't pricing in. Stress-test before assuming the spread holds.
Location & tenants
- Location reads 73/100 on livability (#539 in PA) — a middle-class / working-renter tenant base. Strengths: cost of living A+, housing A+, schools B+; Watch: health & safety D, crime D-, amenities F.
- West Mifflin Area SD (suburban): math 19% / reading 41% proficiency, ranked #443 of 539 in PA (top 82%) — families likely to look elsewhere, expect single-tenant / working-renter base with shorter leases.
- Market conditions: 58 active listings in the ZIP; 3 comparable units currently listed for rent nearby; rentals lingering (median 44d on market — plan ~5-8 weeks vacancy on turnover, expect pricing pressure); 67% of comp listings sitting > 30 days — soft ceiling on asking rent; 2,996 units permitted in Allegheny County in 2024 (1,588 in 5+ unit buildings).
Forward outlook
- Local home prices are declining (-3.0%/yr); year-one equity from $622 of loan paydown is wiped out by about $3k of value loss. Plan a longer hold.
- At projected returns (-3.0% appreciation + 3.0% rent growth), your $25k cash investment doubles in ~7 years — after that, you're playing with house money.
Negotiation context
- It's been on market 166 days — a 12% lower offer ($79k) is reasonable based on typical stale-listing flexibility.
- 2 sale attempts; this cycle's ask has dropped $35k (28%) from the opening price — seller is motivated, your offer sets the floor, not the list.
- Current owner paid $10k; list at $90k implies a 799% gain — meaningful room to come down on a strong offer.
Risks & watch-outs
- Watch-outs: built in 1930 — expect roof / HVAC / electrical / plumbing capex.
Questions for the listing agent
- It's been on market 166 days. Have you received any prior offers? Is the seller open to a 12% concession, seller financing, or rate buy-down credit?
- Built in 1930 — when were the roof, HVAC, electrical panel, plumbing, and water heater last replaced?
- Why hasn't it sold? Are there any deal-killer items the seller is aware of (foundation, flood, title, zoning, code violations)?
- Is there a deadline driving the sale (1031 exchange, divorce, estate, relocation)? That informs how much negotiation room exists.
- Schools are B-rated — typically a magnet for longer-tenancy family renters. What's the average tenant stay here, and is there a school-zone premium baked into asking?
- Crime grade is D in this area — have there been break-ins, vandalism, or insurance claims at this property in the last 3 years? What carrier currently insures it and at what premium?
- What's the average days-on-market for RENTAL listings here right now (not sales)? A rising rental-DOM trend means longer vacancies and softer asking-rent achievability than the comps imply.
- What's the recent tenant-quality profile in this submarket — average credit score on applications, eviction rate, late-payment / NSF rate, and stable-employment percentage? A property-management company in the area should have these aggregated.
- How much new for-sale + rental construction is in the pipeline within 1–3 miles? Heavy new supply typically softens prices + rents 12–24 months out; constrained supply supports both.
Investment metrics
- 1% rule
- 1.44% ✓
- Cap rate
- 11.35%
- Cash-on-cash
- 18.07%
- DSCR
- 1.80
- GRM
- 5.8
CMA / ARV
- ARV (on-the-fly)
- $90,168
- Comps found
- 6
Show comp detail 6 sales within ~0.75 mi
| Address | Dist | Beds/Ba | Sqft | Sold | Price | $/sf | Match |
|---|---|---|---|---|---|---|---|
| 4317 Home St | 0.00mi | 1/1.0 | 663 (0%) | 0mo | $89,900 | $136 | 100 |
| 628 Hazel St | 0.29mi | 2/1.0 (+1) | 706 (+6%) | 1mo | $140,000 | $198 | 70 |
| 620 Glencairn St | 0.28mi | 2/1.0 (+1) | 696 (+5%) | 6mo | $42,000 | $60 | 69 |
| 501 Division St | 0.49mi | 2/1.0 (+1) | 700 (+6%) | 7mo | $155,000 | $221 | 57 |
| 4632 Greensprings Ave | 0.28mi | 2/1.0 (+1) | 752 (+13%) | 8mo | $80,000 | $106 | 53 |
| 509 Oak St | 0.67mi | 1/1.0 | 754 (+14%) | 12mo | $37,000 | $49 | 36 |
Match score weights: distance 35% · size 25% · config 20% · recency 20%. Top-matched comps best support the ARV.
Projected returns pro-forma
-3.0% appreciation · 3.0% rent growth · sell at horizon
- IRR
- 9.7%
- Equity multiple
- 1.38×
- Total profit
- $9,609
- Equity at exit
- $13,404
- IRR
- 18.8%
- Equity multiple
- 2.57×
- Total profit
- $39,590
- Equity at exit
- $7,773
Cash invested: $25,172 (down + closing). Projections, not guarantees.
Landlord ↔ Tenant lean methodology
- Overall (STATE)
- 62 Landlord-Friendly
- State Pennsylvania
- 62 Landlord-Friendly · EVEN
- County
- — inherits STATE
- City
- — inherits STATE
ZIP-level market 15122
- Home prices YoY
- -30.4%
- Active inventory
- 58
- Price-to-rent
- 5.8×
Monthly cashflow live
- Estimated rent
- $1,294 medium interval (Pro) →
- Mortgage (P&I)
- −$471
- Tax from tax record
- −$134 /mo · $1,608/yr
- Insurance
- −$37
- HOA
- −$0
- Vacancy / Maint / Mgmt
- −$272
- Net cashflow
- $379
Break-even live
UW: 25.0% down · 7.5% · 30yr · 1.5% tax · 5.0% vac · 8.0% maint · 8.0% mgmt
Financing live
Cash to close
- Down payment
- $22,475
- Closing costs
- $2,697
- Reserves months
- —
- Total cash needed
- —
Loan-product check · same deal, 3 products live
Conventional
25% down · 7.5% · 30yr
- Down + closing
- —
- Monthly P&I
- —
- Monthly cashflow
- —
- DSCR
- —
- Eligible?
- —
Personal DTI + credit; lowest rate.
DSCR
20% down · 8.5% · 30yr
- Down + closing
- —
- Monthly P&I
- —
- Monthly cashflow
- —
- DSCR
- —
- Eligible?
- —
No personal income docs; deal must DSCR.
Hard money
10% down · 12.0% · 12mo
- Down + closing
- —
- Monthly P&I
- —
- Monthly cashflow
- —
- DSCR
- —
- Eligible?
- —
Short-term bridge; refi at stabilization.
Rent comps 3 comps
| Address | Beds | Baths | Sqft | Rent | $/sqft | DOM | Units | Dist |
|---|---|---|---|---|---|---|---|---|
| 4 St Therese Ct Munhall, PA | 1.0 | 1.0 | 620 | $1,275 | $2.06 | 43d | 1 | 0.86mi |
| 4511 Main St Unit B Munhall, PA | 1.0 | 1.0 | 700 | $1,100 | $1.57 | 43d | 1 | 1.35mi |
| 640 Braddock Ave Braddock, PA | — | 1.0 | 522 | $1,899 | $3.64 | 1d | 1 | 1.36mi |
Listing history 15 events
-
2026-06-07statusdays on market $89,900 Pending 166 DOM
-
2026-06-03days on market $89,900 Contingent 163 DOM
-
2026-06-02days on market $89,900 Contingent 162 DOM
-
2026-06-01days on market $89,900 Contingent 161 DOM
-
2026-05-31days on market $89,900 Contingent 160 DOM
-
2026-04-26historical Contingent
-
2026-04-06price $89,900
-
2026-03-31price $97,000
-
2026-03-23price $99,000
-
2026-03-04status Active
-
2025-12-23price $100,000
-
2025-11-20price $109,500
-
2025-11-11price $119,900
-
2025-10-30$124,900 Active
-
2013-02-12soldstatus $10,000
ⓘ Source: listings_history table (triggers on properties + properties_extension) + one-shot
backfill from property_details.listing_events for pre-trigger history.
Tax reassessment forecast PA · Partial reset (capped growth)
- Current annual tax
- $1,608 · $134/mo
- Projected year-2 tax
- $1,608 · $134/mo
- Expected delta
- $0/yr ($0/mo · 0.0%)
ⓘ Screening estimate from a state-policy table — verify with the county assessor before closing.
Climate risk First Street
- Flood 1/10 Low FEMA zone X (unshaded) · 0% chance over 30 yrs
- Wildfire 1/10 Low
- Heat 4/10 Moderate 7 d/yr ≥97°F today · 17 d/yr by 30 yrs out
- Wind 2/10 Low
- Air quality 4/10 Moderate 4 unhealthy d/yr today · 5 by 30 yrs out
Nearby sold comps map
Loading sold comps map…
Walkable amenities ~0.75 mi
Loading nearby amenities…
Taxation est. · year 1
- Rental income
- $15,524
- − Mortgage interest
- −$5,036
- − Property taxes
- −$1,608
- − Insurance
- −$450
- − Repairs & maintenance
- −$1,242
- − Management
- −$1,242
- − Depreciation
- −$2,615
- Taxable income
- $3,331
- Est. tax owed @ 24.0%
- −$800
- After-tax cash flow
- $3,749/yr
For passive investors: Depreciation is non-cash, so a rental often shows a tax loss while cash-flowing — sheltering income. Rental losses are passive: they offset passive income freely, and up to $25,000/yr can offset ordinary (W-2) income if you actively participate and your MAGI is under $100k (phasing out to $0 by $150k); unused losses carry forward. On sale, claimed depreciation is recaptured at up to 25%, and gains may owe capital-gains tax (a 1031 exchange can defer both). Figures are a year-1 estimate at your 24.0% rate — not tax advice; consult a CPA.
Schools (NCES district)
- District
- West Mifflin Area SD
- NCES district ID
- 4225680
- Math proficiency
- 19% ▼ -19.00%
- Reading proficiency
- 41% ▼ -14.00%
- Median HH income
- $46,532
- Composite
- 25.78/100
- National rank
- #7371
- State rank
- #443 of 539 in PA
Livability — West Mifflin
- Score
- 73/100
- State rank
- #539
- US rank
- #5042
Category grades
Schools grade is shown separately in the Schools card above.
Census & demographics
- Census place
- West Mifflin, PA
- County
- Allegheny County · 1,022,028 people
- City population
- 18,816
- Metro
- Pittsburgh, PA
- Population (ZIP)
- 18,816
- Household income
- $72,485
- Rent vs Own
- Severe rent burden
- 334.0
Population outlook (Allegheny County) Hauer SSP2
- Today (2025)
- 1,250,282 people
- By 2030
- 1,256,482 · +0.5%
- By 2040
- 1,256,318 · +0.5%
- By 2050
- 1,244,169 · -0.5%
- By 2075
- 1,197,693 · -4.2%
- By 2100
- 1,093,187 · -12.6%
Race, ethnicity, and origin ACS 2023
- Neighborhood character
- Predominantly White (81%)
- Race & ethnicity
- White 81% Black 9% Two or more races 7% Hispanic / Latino 2% Asian 1%
- Common ancestry
- Romanian 9% Slovak 1% Scotch-Irish 1%
- Foreign-born
- 1% · South Korea
- Languages at home
- 93% English-only · Spanish 4% Other Indo-European 1%
Political lean MEDSL · Allegheny
- 2024 margin
- Strong D (+20.3) · D 59.7% · R 39.4%
- 2008→2024 swing
- +4.8pp toward D · 2008: 15.5pp · 2024: 20.3pp
- All cycles
- 2024: D+20.3 2020: D+20.4 2016: D+16.4 2012: D+14.4 2008: D+15.5
Not yet ingested
- Civics
- —
Market trends
- HPI YoY
- ▼ -107.69%
- Current HPI
- 246.2486
- Rent YoY
- —
- Metro
- Pittsburgh, PA
- State GDP YoY
- ▲ 1.68%
- F500 in state
- 34
Industry mix (Fortune 500 HQ in PA)
| Industry | F500 HQs | Revenue |
|---|---|---|
| Healthcare | 2 | $309B |
|
||
| Insurance | 2 | $27B |
|
||
| Telecommunications / Media | 1 | $124B |
|
||
| Industrial Distribution | 1 | $22B |
|
||
| Financial Services | 1 | $20B |
|
||
| Chemicals / Materials | 1 | $18B |
|
||
Price history
+799.0% since first listed10 events — show timeline
- 2026-04-26 Contingent — West Penn MLS
- 2026-04-06 Price Changed $89,900 West Penn MLS
- 2026-03-31 Price Changed $97,000 West Penn MLS
- 2026-03-23 Price Changed $99,000 West Penn MLS
- 2026-03-04 Relisted — West Penn MLS
- 2025-12-23 Price Changed $100,000 West Penn MLS
- 2025-11-20 Price Changed $109,500 West Penn MLS
- 2025-11-11 Price Changed $119,900 West Penn MLS
- 2025-10-30 Listed $124,900 West Penn MLS
- 2013-02-12 Sold (Public Records) $10,000 Public Records
Property tax history
+1.3%/yrLatest (2026): $1,608 · +4.2% YoY. Source: county tax records.
Cash-flow waterfall
monthlySold comps — $/sqft
last 12 mo · ≤1 miLoading sold comps…