583 Union Ridge Rd · Benton, KY
Flood risk 1/10 · Minimal
- FEMA flood zone
- X (unshaded)
- Chance of flooding over 30 yrs
- 0.0%
- Est. flood insurance / yr
- $507 – $1,088
Fire risk 3/10 · Minor
- Est. fire insurance / yr
- $839 – $1,559
Heat risk 5/10 · Moderate
- Hot days now (above 109°F)
- 7 days/yr
- Hot days in 30 yrs
- 20 days/yr
Wind risk 4/10 · Minor
- Chance of severe wind over 30 yrs
- 8.0%
Air-quality risk 1/10 · Minimal
- Unhealthy air days now
- 0 days/yr
- Unhealthy air days in 30 yrs
- 0 days/yr
Risk factors via First Street. Map © Google.
Why this score? — see what drove the B+ grade
The composite is a weighted blend of 9 inputs, each scored 0–100. Each bar is that input's sub-score; the figure is the points it added to the 100-point composite (weight × sub-score).
- Cash flow +30.0/30.0
- DSCR +10.0/10.0
- Appreciation +10.0/10.0
- 1% rule +7.9/10.0
- ARV discount +7.5/15.0
- Livability +3.5/5.0
- Schools +2.9/10.0
- Rent growth +2.5/5.0
- Condition / age +2.5/5.0
$125,000
🖨 Deal sheet (PDF) 📄 Offer letter ✓ Due diligence
Listing remarks
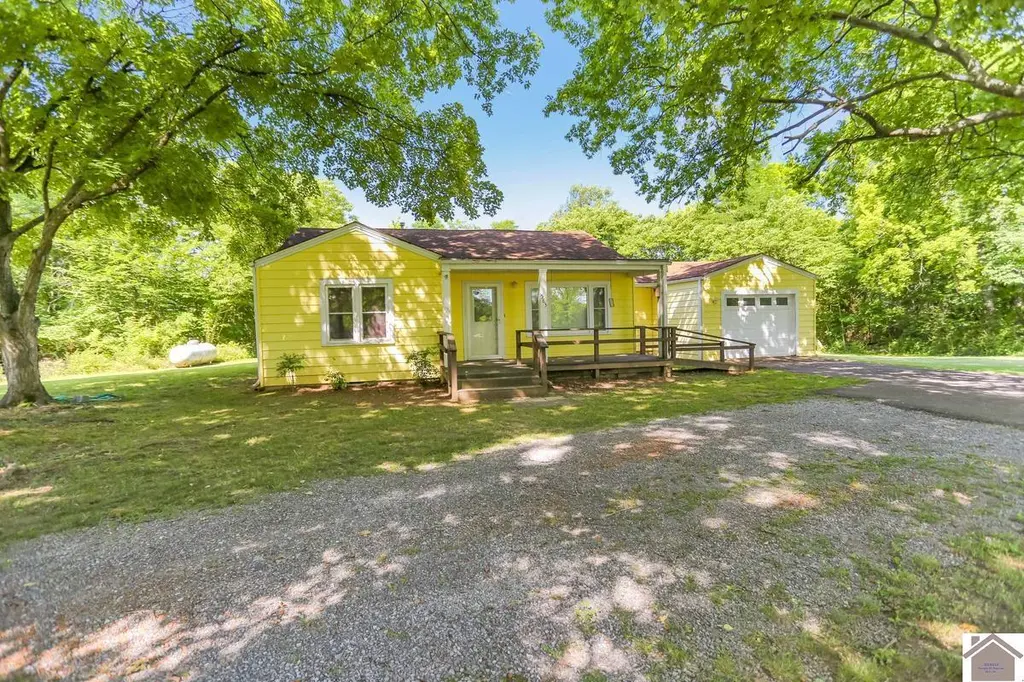
Charming cottage near KY Lake in the heart of Aurora! Situated on 1.61 acres with amazing 100 yr old shade trees, this inviting home offers a spacious layout with 2 bedrooms and 1 bath. Features include a convenient mudroom, oversized laundry room with pantry area and a 1 car garage. Enjoy relaxing mornings on the covered front porch while taking in the peaceful surroundings. Updates include new shower, replacement windows, HVAC system, and breaker panel. Whether you're searching for a full time residence, weekend getaway, or investment property, this property offers the perfect combination of charm, space and a desirable location just minutes from Kentucky Lake amenities.
Key facts
- Covered front porch
- Mudroom
- Breaker panel
Tags
Property features AI
Exterior
- Parking: Attached garage (1 car); Circular driveway
- Utilities: Public water; Septic tank; Cable available
- Home design: Single-family residence; One story
- Construction: Frame construction with aluminum siding; Shingle roof
- Exterior features: Level lot; Outbuilding
Interior
- Kitchen: Cooktop; Refrigerator
- Flooring: Carpet; Vinyl
- Bathrooms: 1 full bathroom
- Heating & cooling: Central air conditioning
- Interior features: Insulated windows; Covered patio/porch
- Laundry & utility: Dryer
Neighborhood map
What this means for you Summary
Snapshot
- This is a 2-bed/1.0-bath single-family listed at $125k.
Deal economics
- At list price, monthly cash flow is $531 ($6k/yr) — positive.
- The deal already cash-flows at list — no discount required.
- Meets the 1% rule at list price ($2k rent vs $125k).
- Cap rate 11.4% vs local median 4.9% in Benton — top-decile yield for the area; either an underpriced asset or a hidden risk that comps aren't pricing in. Stress-test before assuming the spread holds.
Location & tenants
- Location reads 69/100 on livability (#171 in KY) — a middle-class / working-renter tenant base. Strengths: crime A+, cost of living A+, housing A+; Watch: amenities F, commute F.
- Marshall County (rural): math 29% / reading 38% proficiency, ranked #73 of 165 in KY (top 44%) — families likely to look elsewhere, expect single-tenant / working-renter base with shorter leases.
- Zoned schools: Jonathan Elementary School (math 17% / reading 32%, grade F, #489 of 676 statewide, top 76%, 238 students, 72% FRL); South Marshall Middle (math 21% / reading 39%, grade F, #146 of 217 statewide, top 69%, 462 students, 55% FRL); Marshall County High School (math 26% / reading 30%, grade F, #151 of 254 statewide, top 61%, 1,256 students, 43% FRL).
- Market conditions: 178 active listings in the ZIP; 121 units permitted in Marshall County in 2024 (5 in 5+ unit buildings).
Forward outlook
- In year one you build about $13k of equity ($864 loan paydown + $12k appreciation (10.0% local appreciation)).
- Marshall County population projected to shrink 9% by 2050 — rents likely to lag national; underwrite the cash flow, not the appreciation.
- At projected returns (10.0% appreciation + 3.0% rent growth), your $35k cash investment doubles in ~2 years — after that, you're playing with house money.
- By year 3, paydown + projected appreciation supports a ~$34k cash-out refi (75% LTV) — recoverable capital for the next deal without selling this one.
Negotiation context
- Only 11 days on market — expect competitive offers; lowballing is unlikely to land.
Risks & watch-outs
- Watch-outs: built in 1955 — expect roof / HVAC / electrical / plumbing capex.
- Climate carrying-cost: extreme-heat days projected 7→20/yr by 2055 (HVAC capex compounding) — expect insurance premiums to compound above CPI over the hold.
Questions for the listing agent
- Built in 1955 — when were the roof, HVAC, electrical panel, plumbing, and water heater last replaced?
- Is there a deadline driving the sale (1031 exchange, divorce, estate, relocation)? That informs how much negotiation room exists.
- Schools are D-rated, which usually means shorter tenancies and higher turnover. Who's the typical renter profile here, and what's been the actual vacancy rate?
- What's the average days-on-market for RENTAL listings here right now (not sales)? A rising rental-DOM trend means longer vacancies and softer asking-rent achievability than the comps imply.
- What's the recent tenant-quality profile in this submarket — average credit score on applications, eviction rate, late-payment / NSF rate, and stable-employment percentage? A property-management company in the area should have these aggregated.
- How much new for-sale + rental construction is in the pipeline within 1–3 miles? Heavy new supply typically softens prices + rents 12–24 months out; constrained supply supports both.
Investment metrics
- 1% rule
- 1.29% ✓
- Cap rate
- 11.39%
- Cash-on-cash
- 18.20%
- DSCR
- 1.81
- GRM
- 6.5
CMA / ARV
No comps found within radius.
Projected returns pro-forma
10.0% appreciation · 3.0% rent growth · sell at horizon
- IRR
- 37.8%
- Equity multiple
- 3.91×
- Total profit
- $101,837
- Equity at exit
- $112,610
- IRR
- 32.5%
- Equity multiple
- 8.81×
- Total profit
- $273,206
- Equity at exit
- $242,848
Cash invested: $35,000 (down + closing). Projections, not guarantees.
Landlord ↔ Tenant lean methodology
- Overall (STATE)
- 83 Strongly Landlord-Friendly
- State Kentucky
- 83 Strongly Landlord-Friendly · R+16
- County
- — inherits STATE
- City
- — inherits STATE
ZIP-level market 42025
- Home prices YoY
- 7.1%
- Active inventory
- 178
- Price-to-rent
- 6.5×
Monthly cashflow live
- Estimated rent
- $1,612 medium interval (Pro) →
- Mortgage (P&I)
- −$656
- Tax from tax record
- −$35 /mo · $423/yr
- Insurance
- −$52
- HOA
- −$0
- Vacancy / Maint / Mgmt
- −$339
- Net cashflow
- $531
Break-even live
Sensitivity live
| Price | -10% $602 | -5% $566 | +0% $531 | +5% $495 | +10% $460 |
|---|---|---|---|---|---|
| Rent | -10% $403 | -5% $467 | +0% $531 | +5% $595 | +10% $658 |
| Rate | -1.0pp $594 | -0.5pp $563 | base $531 | +0.5pp $498 | +1.0pp $465 |
UW: 25.0% down · 7.5% · 30yr · 1.5% tax · 5.0% vac · 8.0% maint · 8.0% mgmt
Financing live
Cash to close
- Down payment
- $31,250
- Closing costs
- $3,750
- Reserves months
- —
- Total cash needed
- —
Loan-product check · same deal, 3 products live
Conventional
25% down · 7.5% · 30yr
- Down + closing
- —
- Monthly P&I
- —
- Monthly cashflow
- —
- DSCR
- —
- Eligible?
- —
Personal DTI + credit; lowest rate.
DSCR
20% down · 8.5% · 30yr
- Down + closing
- —
- Monthly P&I
- —
- Monthly cashflow
- —
- DSCR
- —
- Eligible?
- —
No personal income docs; deal must DSCR.
Hard money
10% down · 12.0% · 12mo
- Down + closing
- —
- Monthly P&I
- —
- Monthly cashflow
- —
- DSCR
- —
- Eligible?
- —
Short-term bridge; refi at stabilization.
Listing history 9 events
-
2026-06-21days on market $125,000 Active 11 DOM
-
2026-06-19days on market $125,000 Active 9 DOM
-
2026-06-18days on market $125,000 Active 8 DOM
-
2026-06-17days on market $125,000 Active 7 DOM
-
2026-06-16days on market $125,000 Active 6 DOM
-
2026-06-15days on market $125,000 Active 5 DOM
-
2026-06-14days on market $125,000 Active 3 DOM
-
2026-06-12remarks 681-char remark
-
2026-06-12$125,000 Active 2 DOM
ⓘ Source: listings_history table (triggers on properties + properties_extension) + one-shot
backfill from property_details.listing_events for pre-trigger history.
Tax reassessment forecast KY · Resets to sale price
- Current annual tax
- $423 · $35/mo
- Projected year-2 tax
- $1,075 · $90/mo
- Expected delta
- +$652/yr (+$54/mo · 154.1%)
ⓘ Screening estimate from a state-policy table — verify with the county assessor before closing.
Climate risk First Street
- Flood 1/10 Low FEMA zone X (unshaded) · 0% chance over 30 yrs
- Wildfire 3/10 Moderate
- Heat 5/10 Major 7 d/yr ≥109°F today · 20 d/yr by 30 yrs out
- Wind 4/10 Moderate 8% chance of damaging wind over 30 yrs
- Air quality 1/10 Low 0 unhealthy d/yr today · 0 by 30 yrs out
Nearby sold comps map
Loading sold comps map…
Walkable amenities ~0.75 mi
Loading nearby amenities…
Taxation est. · year 1
- Rental income
- $19,347
- − Mortgage interest
- −$7,002
- − Property taxes
- −$423
- − Insurance
- −$625
- − Repairs & maintenance
- −$1,548
- − Management
- −$1,548
- − Depreciation
- −$3,636
- Taxable income
- $4,565
- Est. tax owed @ 24.0%
- −$1,096
- After-tax cash flow
- $5,274/yr
For passive investors: Depreciation is non-cash, so a rental often shows a tax loss while cash-flowing — sheltering income. Rental losses are passive: they offset passive income freely, and up to $25,000/yr can offset ordinary (W-2) income if you actively participate and your MAGI is under $100k (phasing out to $0 by $150k); unused losses carry forward. On sale, claimed depreciation is recaptured at up to 25%, and gains may owe capital-gains tax (a 1031 exchange can defer both). Figures are a year-1 estimate at your 24.0% rate — not tax advice; consult a CPA.
Schools (NCES district)
- District
- Marshall County
- NCES district ID
- 2103810
- Math proficiency
- 29% ▼ -7.00%
- Reading proficiency
- 38% ▼ -16.00%
- Median HH income
- $45,324
- Composite
- 28.62/100
- National rank
- #6710
- State rank
- #73 of 165 in KY
Livability — Benton
- Score
- 69/100
- State rank
- #171
- US rank
- #8655
Category grades
Schools grade is shown separately in the Schools card above.
Census & demographics
- Population (ZIP)
- 19,238
Population outlook (Marshall County) Hauer SSP2
- Today (2025)
- 30,647 people
- By 2030
- 30,276 · -1.2%
- By 2040
- 29,232 · -4.6%
- By 2050
- 27,940 · -8.8%
- By 2075
- 25,289 · -17.5%
- By 2100
- 21,188 · -30.9%
Race, ethnicity, and origin ACS 2023
- Neighborhood character
- Predominantly White (95%)
- Race & ethnicity
- White 95% Two or more races 2% Hispanic / Latino 2%
- Common ancestry
- Iranian 2% Slovak 2% Lithuanian 2%
- Foreign-born
- 1% · Canada
- Languages at home
- 98% English-only · Spanish 1%
Political lean MEDSL · Marshall
- 2024 margin
- Solid R (+56.7) · D 21.0% · R 77.7% · Other 1.3%
- 2008→2024 swing
- -32.0pp toward R · 2008: -24.7pp · 2024: -56.7pp
- All cycles
- 2024: R+56.7 2020: R+52.4 2016: R+51.9 2012: R+34.2 2008: R+24.7
Not yet ingested
- Civics
- —
Market trends
- HPI YoY
- ▲ 19.11%
- Current HPI
- 288.75
- Rent YoY
- —
- Metro
- —
- State GDP YoY
- ▲ 1.81%
- F500 in state
- 4
Industry mix (Fortune 500 HQ in KY)
| Industry | F500 HQs | Revenue |
|---|---|---|
| Healthcare | 1 | $118B |
|
||
| Food / Beverage | 1 | $7B |
|
||
Price history
1 event — show timeline
- 2026-06-10 Listed $125,000 WKRMLS
Property tax history
+14.4%/yrLatest (2025): $423 · +1057.6% YoY. Source: county tax records.
Cash-flow waterfall
monthlySold comps — $/sqft
last 12 mo · ≤1 miLoading sold comps…