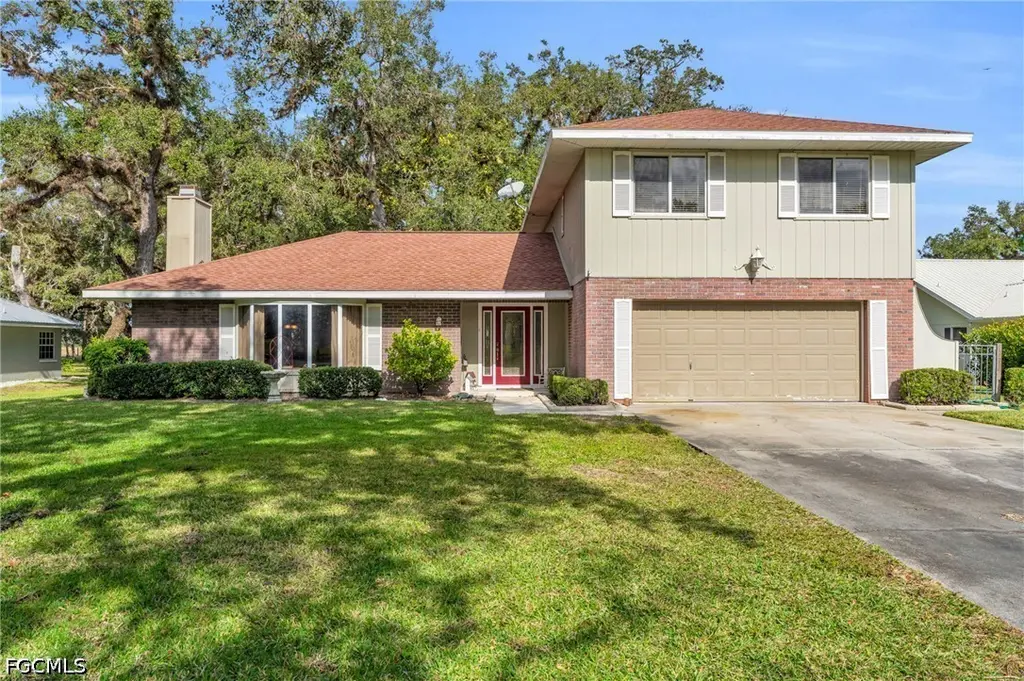
1210 Riverbend Dr · LaBelle, FL
Flood risk 1/10 · Minimal
- FEMA flood zone
- X (unshaded)
- Chance of flooding over 30 yrs
- 0.0%
- Est. flood insurance / yr
- $507 – $1,088
Fire risk 6/10 · Moderate
- Est. fire insurance / yr
- $947 – $1,759
Heat risk 9/10 · Severe
- Hot days now (above 108°F)
- 7 days/yr
- Hot days in 30 yrs
- 25 days/yr
Wind risk 10/10 · Severe
- Chance of severe wind over 30 yrs
- 99.0%
Air-quality risk 2/10 · Minimal
- Unhealthy air days now
- 2 days/yr
- Unhealthy air days in 30 yrs
- 2 days/yr
Risk factors via First Street. Map © Google.
Why this score? — see what drove the F grade
The composite is a weighted blend of 9 inputs, each scored 0–100. Each bar is that input's sub-score; the figure is the points it added to the 100-point composite (weight × sub-score).
- Appreciation +10.0/10.0
- Cash flow +7.2/30.0
- Livability +3.6/5.0
- Schools +3.1/10.0
- Rent growth +2.5/5.0
- Condition / age +2.5/5.0
- 1% rule +2.1/10.0
- DSCR +1.4/10.0
- ARV discount +0.0/15.0
$404,900
🖨 Deal sheet 📄 Offer letter ✓ Due diligence
Listing remarks
This peaceful retreat in the gated Riverbend Estates community sits on a spacious 1.02-acre wooded lot, offering privacy and natural surroundings. The two-story home features 3 spacious bedrooms, a versatile den, and 2.5 baths. The bright living room is filled with natural light and anchored by a cozy fireplace. A formal dining room provides the perfect setting for meals, while the kitchen offers ample cabinet and counter space, making it ideal for cooking and entertaining. Upstairs, the master suite offers a private retreat with picturesque views of the property. The enclosed Florida room provides a serene spot to relax while staying connected to nature. Riverbend Estates, surrounded by ma
Key facts
- Community amenities
- Spacious wooded lot
- Cozy fireplace
Tags
Property features AI
Finance
- Financial info: Pets allowed
- HOA & community: Homeowners association with monthly fee; Association fee includes irrigation water, grounds maintenance, sewer and water; Community amenities: clubhouse, pool, tennis courts, billiards/billiard room, RV/boat storage
Exterior
- Parking: Attached garage with 2 covered spaces
- Security: Gated community
- Utilities: Public water; Public sewer; Cable available; Underground utilities
- Home design: 2-story residence; Entry level: 0; Faces south; Resale condition
- Construction: Built with brick, block, concrete and wood frame; Shingle roof
- Exterior features: Patio; Room for pool; Sprinkler/irrigation (automatic); Irrigation source: lake; Oversized lot; North exposure
Interior
- Kitchen: Dishwasher; Range; Refrigerator; Freezer; Disposal; Water purifier
- Bedrooms: Includes a den and a Florida room (additional room types on property)
- Flooring: Carpet; Wood
- Bathrooms: 2 full bathrooms; 1 half bathroom
- Heating & cooling: Central heating (electric); Central air conditioning (electric)
- Interior features: Separate/formal dining room; Fireplace; Tub with shower; Walk-in closets
- Laundry & utility: Washer; Dryer; Laundry tub
Neighborhood map
What this means for you Summary
Snapshot
- This is a 3-bed/2.0-bath single-family listed at $405k.
Deal economics
- At list price, monthly cash flow is $-561 ($-7k/yr) — negative.
- To cash-flow at today's rent, offer at most $306k (24.5% below list).
- To meet the 1% rule (rent ≥ 1% of price), the offer needs to be $289k (28.5% below list).
- Recommended offer: $289k (28.5% below list) — sets the bar for 1% rule.
Location & tenants
- Location reads 72/100 on livability (#324 in FL) — a middle-class / working-renter tenant base. Strengths: cost of living A+, housing A+, health & safety A+; Watch: schools C-, commute F, employment F.
- Hendry (town): math 35% / reading 40% proficiency, ranked #65 of 73 in FL (top 89%) — families likely to look elsewhere, expect single-tenant / working-renter base with shorter leases; 75% free/reduced lunch — lower-income household profile, screen leases tightly.
- Market conditions: 942 active listings in the ZIP; 2 comparable units currently listed for rent nearby; 557 units permitted in Hendry County in 2024 (45 in 5+ unit buildings).
- At $2,894/mo this rent would consume 61% of the median local household income ($57k/yr) (locally 498% of renters already pay >50% of income on rent) — very limited rent-growth headroom before tenants either downsize or default.
Forward outlook
- In year one you build about $43k of equity ($3k loan paydown + $40k appreciation (10.0% local appreciation)).
- Hendry County population projected to shrink 7% by 2050 — rents likely to lag national; underwrite the cash flow, not the appreciation.
- By year 2, paydown + projected appreciation supports a ~$70k cash-out refi (75% LTV) — recoverable capital for the next deal without selling this one.
Negotiation context
- It's been on market 71 days — a 6% lower offer ($381k) is reasonable based on typical stale-listing flexibility.
- 4 sale attempts since 3y ago with the ask held roughly flat each time — persistent listings suggest the price (not the market) is what's stuck; bring a comps-based counter.
Risks & watch-outs
- Climate carrying-cost: severe wind risk, 99% chance of damaging wind over 30y; major wildfire risk; extreme-heat days projected 7→25/yr by 2055 (HVAC capex compounding) — expect insurance premiums to compound above CPI over the hold.
Questions for the listing agent
- What do current leases actually rent for vs. the listed asking? Can we see a recent rent roll and the last 12 months of T-12 income?
- It's been on market 71 days. Have you received any prior offers? Is the seller open to a 29% concession, seller financing, or rate buy-down credit?
- What does the HOA fee cover, when was the last increase, and are there any pending special assessments or reserve-fund shortfalls?
- Why hasn't it sold? Are there any deal-killer items the seller is aware of (foundation, flood, title, zoning, code violations)?
- Is there a deadline driving the sale (1031 exchange, divorce, estate, relocation)? That informs how much negotiation room exists.
- The area grade is low — what's the realistic commute time and amenity access for the typical tenant pool here? Any planned neighborhood developments (good or bad) we should know about?
- What's the average days-on-market for RENTAL listings here right now (not sales)? A rising rental-DOM trend means longer vacancies and softer asking-rent achievability than the comps imply.
- What's the recent tenant-quality profile in this submarket — average credit score on applications, eviction rate, late-payment / NSF rate, and stable-employment percentage? A property-management company in the area should have these aggregated.
- How much new for-sale + rental construction is in the pipeline within 1–3 miles? Heavy new supply typically softens prices + rents 12–24 months out; constrained supply supports both.
Investment metrics
- 1% rule
- 0.71% ✗
- Cap rate
- 4.63%
- Cash-on-cash
- -5.94%
- DSCR
- 0.74
- GRM
- 11.7
CMA / ARV
- ARV (on-the-fly)
- $331,350
- Comps found
- 2
Show comp detail 2 sales within ~0.75 mi
| Address | Dist | Beds/Ba | Sqft | Sold | Price | $/sf | Match |
|---|---|---|---|---|---|---|---|
| 1250 Riverbend Dr | 0.04mi | 3/2.0 | 2,297 (+4%) | 10mo | $325,000 | $141 | 83 |
| 823 Fort Thompson Ave | 0.66mi | 3/2.5 | 2,496 (+13%) | 15mo | $375,000 | $150 | 33 |
Match score weights: distance 35% · size 25% · config 20% · recency 20%. Top-matched comps best support the ARV.
Projected returns pro-forma
10.0% appreciation · 3.0% rent growth · sell at horizon
- IRR
- 20.1%
- Equity multiple
- 2.63×
- Total profit
- $184,878
- Equity at exit
- $364,766
- IRR
- 18.4%
- Equity multiple
- 6.05×
- Total profit
- $572,667
- Equity at exit
- $786,632
Cash invested: $113,372 (down + closing). Projections, not guarantees.
Landlord ↔ Tenant lean methodology
- Overall (STATE)
- 87 Strongly Landlord-Friendly
- State Florida
- 87 Strongly Landlord-Friendly · R+3
- County
- — inherits STATE
- City
- — inherits STATE
ZIP-level market 33935
- Home prices YoY
- 16.3%
- Active inventory
- 942
- Price-to-rent
- 11.7×
Monthly cashflow live
- Estimated rent
- $2,894 medium interval (Pro) →
- Mortgage (P&I)
- −$2,123
- Tax from tax record
- −$225 /mo · $2,702/yr
- Insurance
- −$169
- HOA
- −$330
- Vacancy / Maint / Mgmt
- −$608
- Net cashflow
- $-561
Break-even live
UW: 25.0% down · 7.5% · 30yr · 1.5% tax · 5.0% vac · 8.0% maint · 8.0% mgmt
Financing live
Cash to close
- Down payment
- $101,225
- Closing costs
- $12,147
- Reserves months
- —
- Total cash needed
- —
Loan-product check · same deal, 3 products live
Conventional
25% down · 7.5% · 30yr
- Down + closing
- —
- Monthly P&I
- —
- Monthly cashflow
- —
- DSCR
- —
- Eligible?
- —
Personal DTI + credit; lowest rate.
DSCR
20% down · 8.5% · 30yr
- Down + closing
- —
- Monthly P&I
- —
- Monthly cashflow
- —
- DSCR
- —
- Eligible?
- —
No personal income docs; deal must DSCR.
Hard money
10% down · 12.0% · 12mo
- Down + closing
- —
- Monthly P&I
- —
- Monthly cashflow
- —
- DSCR
- —
- Eligible?
- —
Short-term bridge; refi at stabilization.
Rent comps 2 comps
| Address | Beds | Baths | Sqft | Rent | $/sqft | DOM | Units | Dist |
|---|---|---|---|---|---|---|---|---|
| 1250 Riverbend Dr Labelle, FL | 3.0 | 2.0 | 2297 | $3,370 | $1.47 | 3d | 1 | 0.03mi |
| 1092 Riverbend Dr Labelle, FL | 2.0 | 2.5 | 2100 | $2,900 | $1.38 | 21d | 1 | 0.13mi |
HOA detail
- Monthly dues
- $330 · $3,960/yr
- Likely covers
- security
Listing history 34 events
-
2026-06-18days on market $404,900 Active 71 DOM
-
2026-06-17days on market $404,900 Active 70 DOM
-
2026-06-16days on market $404,900 Active 69 DOM
-
2026-06-15days on market $404,900 Active 68 DOM
-
2026-06-13days on market $404,900 Active 66 DOM
-
2026-06-13days on market $404,900 Active 65 DOM
-
2026-06-10days on market $404,900 Active 63 DOM
-
2026-06-09days on market $404,900 Active 62 DOM
-
2026-06-08days on market $404,900 Active 61 DOM
-
2026-06-07days on market $404,900 Active 60 DOM
-
2026-06-03days on market $404,900 Active 56 DOM
-
2026-06-02days on market $404,900 Active 55 DOM
-
2026-06-01days on market $404,900 Active 54 DOM
-
2026-05-31days on market $404,900 Active 53 DOM
-
2026-05-11price $404,900
-
2026-04-08$424,900 Active
-
2025-06-18historical
-
2025-03-18price $451,400
-
2025-01-22$454,900 Active
-
2024-08-12historical
-
2024-07-11price $455,000
-
2024-01-22price $459,000
-
2023-11-09$474,900 Active
-
2023-10-31historical
-
2023-09-18price $474,000
-
2023-08-18price $499,000
-
2023-07-19$549,500 Active
-
2006-05-22soldstatus $359,900
-
2006-05-08soldstatus $359,900
-
2004-07-19soldstatus $222,500
-
2004-07-14soldstatus $222,500
-
2004-07-12price $229,000
-
1995-11-28soldstatus $23,100
-
1984-08-01soldstatus $30,000
ⓘ Source: listings_history table (triggers on properties + properties_extension) + one-shot
backfill from property_details.listing_events for pre-trigger history.
Tax reassessment forecast FL · Resets to sale price
- Current annual tax
- $2,702 · $225/mo
- Projected year-2 tax
- $3,361 · $280/mo
- Expected delta
- +$659/yr (+$55/mo · 24.4%)
ⓘ Screening estimate from a state-policy table — verify with the county assessor before closing.
Climate risk First Street
- Flood 1/10 Low FEMA zone X (unshaded) · 0% chance over 30 yrs
- Wildfire 6/10 Major
- Heat 9/10 Extreme 7 d/yr ≥108°F today · 25 d/yr by 30 yrs out
- Wind 10/10 Extreme 99% chance of damaging wind over 30 yrs
- Air quality 2/10 Low 2 unhealthy d/yr today · 2 by 30 yrs out
Nearby sold comps map
Loading sold comps map…
Walkable amenities ~0.75 mi
Loading nearby amenities…
Taxation est. · year 1
- Rental income
- $34,731
- − Mortgage interest
- −$22,681
- − Property taxes
- −$2,702
- − Insurance
- −$2,024
- − Repairs & maintenance
- −$2,778
- − Management
- −$2,778
- − HOA
- −$3,960
- − Depreciation
- −$11,779
- Taxable loss
- −$13,972
- Est. tax savings @ 24.0%
- +$3,353
- After-tax cash flow
- $-3,376/yr
For passive investors: Depreciation is non-cash, so a rental often shows a tax loss while cash-flowing — sheltering income. Rental losses are passive: they offset passive income freely, and up to $25,000/yr can offset ordinary (W-2) income if you actively participate and your MAGI is under $100k (phasing out to $0 by $150k); unused losses carry forward. On sale, claimed depreciation is recaptured at up to 25%, and gains may owe capital-gains tax (a 1031 exchange can defer both). Figures are a year-1 estimate at your 24.0% rate — not tax advice; consult a CPA.
Schools (NCES district)
- District
- Hendry
- NCES district ID
- 1200780
- Math proficiency
- 35% ▼ -11.00%
- Reading proficiency
- 40% ▼ -4.00%
- Median HH income
- $37,043
- Composite
- 31.16/100
- National rank
- #6054
- State rank
- #65 of 73 in FL
Livability — LaBelle
- Score
- 72/100
- State rank
- #324
- US rank
- #5736
Category grades
Schools grade is shown separately in the Schools card above.
Census & demographics
- County
- Hendry County · 23,186 people
- City population
- 23,186
- Metro
- Clewiston, FL
- Population (ZIP)
- 23,186
- Household income
- $57,009
- Rent vs Own
- Severe rent burden
- 498.0
Population outlook (Hendry County) Hauer SSP2
- Today (2025)
- 38,866 people
- By 2030
- 38,558 · -0.8%
- By 2040
- 37,743 · -2.9%
- By 2050
- 36,117 · -7.1%
- By 2075
- 30,070 · -22.6%
- By 2100
- 21,966 · -43.5%
Race, ethnicity, and origin ACS 2023
- Neighborhood character
- Majority Hispanic (56%)
- Race & ethnicity
- Hispanic / Latino 56% White 39% Two or more races 21% Black 2% Native American 2%
- Hispanic origin (detail)
- Mexican 40% Puerto Rican 3% Cuban 5%
- Common ancestry
- Lithuanian 2% Serbian 2% Slovak 1%
- Foreign-born
- 27% · Canada, Jamaica
- Languages at home
- 50% English-only · Spanish 50%
Political lean MEDSL · Hendry
- 2024 margin
- Solid R (+38.3) · D 30.4% · R 68.7%
- 2008→2024 swing
- -31.1pp toward R · 2008: -7.2pp · 2024: -38.3pp
- All cycles
- 2024: R+38.3 2020: R+23.0 2016: R+14.2 2012: R+5.9 2008: R+7.2
Not yet ingested
- Civics
- —
Market trends
- HPI YoY
- ▲ 75.20%
- Current HPI
- 537.4928
- Rent YoY
- —
- Metro
- Clewiston, FL
- State GDP YoY
- ▲ 3.28%
- F500 in state
- 36
Industry mix (Fortune 500 HQ in FL)
| Industry | F500 HQs | Revenue |
|---|---|---|
| Industrial Technology | 2 | $29B |
|
||
| Insurance | 2 | $17B |
|
||
| Retail | 1 | $60B |
|
||
| Technology Distribution | 1 | $58B |
|
||
| Homebuilding | 1 | $35B |
|
||
| Technology Manufacturing | 1 | $35B |
|
||
Price history
+1249.7% since first listed20 events — show timeline
- 2026-05-11 Price Changed $404,900 FORTMLS
- 2026-04-08 Listed $424,900 FORTMLS
- 2025-06-18 Listing Removed — FORTMLS
- 2025-03-18 Price Changed $451,400 FORTMLS
- 2025-01-22 Listed $454,900 FORTMLS
- 2024-08-12 Listing Removed — FORTMLS
- 2024-07-11 Price Changed $455,000 FORTMLS
- 2024-01-22 Price Changed $459,000 FORTMLS
- 2023-11-09 Listed $474,900 FORTMLS
- 2023-10-31 Listing Removed — FORTMLS
- 2023-09-18 Price Changed $474,000 FORTMLS
- 2023-08-18 Price Changed $499,000 FORTMLS
- 2023-07-19 Listed $549,500 FORTMLS
- 2006-05-22 Sold (Public Records) $359,900 Public Records
- 2006-05-08 Sold (MLS) $359,900 FORTMLS
- 2004-07-19 Sold (Public Records) $222,500 Public Records
- 2004-07-14 Sold (MLS) $222,500 FORTMLS
- 2004-07-12 Price Changed $229,000 FORTMLS
- 1995-11-28 Sold (Public Records) $23,100 Public Records
- 1984-08-01 Sold (Public Records) $30,000 Public Records
Property tax history
+2.1%/yrLatest (2025): $2,702 · +7.4% YoY. Source: county tax records.
Cash-flow waterfall
monthlySold comps — $/sqft
last 12 mo · ≤1 miLoading sold comps…