 🏗️ New Construction
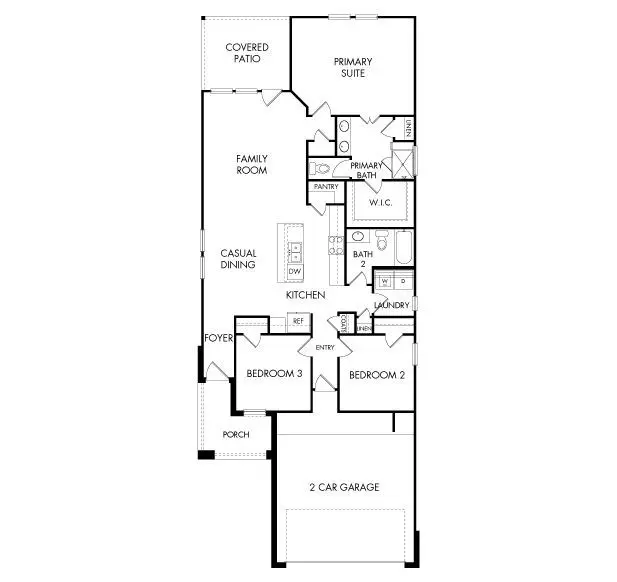
The Glacier (N304) Plan · Plum Grove, TX
Flood risk No data
- FEMA flood zone
- —
- Chance of flooding over 30 yrs
- —
- Est. flood insurance / yr
- —
Fire risk No data
- Est. fire insurance / yr
- —
Heat risk No data
- Hot days now (above threshold)
- —
- Hot days in 30 yrs
- —
Wind risk No data
- Chance of severe wind over 30 yrs
- —
Air-quality risk No data
- Unhealthy air days now
- —
- Unhealthy air days in 30 yrs
- —
Risk factors via First Street. Map © Google.
Why this score? — see what drove the D grade
The composite is a weighted blend of 9 inputs, each scored 0–100. Each bar is that input's sub-score; the figure is the points it added to the 100-point composite (weight × sub-score).
- Cash flow +14.0/30.0
- ARV discount +7.5/15.0
- DSCR +4.2/10.0
- 1% rule +3.9/10.0
- Schools +3.1/10.0
- Livability +2.9/5.0
- Rent growth +2.5/5.0
- Condition / age +2.0/5.0
- Appreciation +0.7/10.0
$199,540
🖨 Deal sheet 📄 Offer letter ✓ Due diligence
Listing remarks MLS
Unwind after a long day in the Glacier's relaxing primary suite, complete with a spa-like primary bathroom. Purpose the flex space located just off the foyer into a useful office or convenient third bedroom.
Key facts
- Flex space
- Useful office
- 2 parking spots
Tags
Neighborhood map
What this means for you Summary
Snapshot
- This is a 3-bed/2.0-bath single-family listed at $200k. Condition is rated fair.
Deal economics
- At list price, monthly cash flow is $29 ($344/yr) — positive.
- The deal already cash-flows at list — no discount required.
- Meets the 1% rule at list price ($2k rent vs $200k).
- Recommended offer: $176k (12.0% below list) — sets the bar for market timing.
- Cap rate 6.4% vs local median 5.0% in Plum Grove — meaningfully above typical; check what's discounted (condition, days-on-market, listing class) to confirm the premium yield is real.
Location & tenants
- Location reads 58/100 on livability (#1,206 in TX) — a working-class tenant base; expect higher turnover. Strengths: crime A+, cost of living A+, housing A+; Watch: schools F, amenities F, commute F.
- Huffman ISD (rural): math 32% / reading 35% proficiency, ranked #500 of 826 in TX (top 60%) — families likely to look elsewhere, expect single-tenant / working-renter base with shorter leases.
- Market conditions: 585 active listings in the ZIP; 2 comparable units currently listed for rent nearby; solid renter incomes; 29,883 units permitted in Harris County in 2024 (8,621 in 5+ unit buildings).
Forward outlook
- Local home prices are declining (-3.0%/yr); year-one equity from $2k of loan paydown is wiped out by about $7k of value loss. Plan a longer hold.
- Harris County population projected at +47% by 2050 — long-run rental-demand tailwind backs the buy-and-hold thesis.
Negotiation context
- It's been on market 193 days — a 12% lower offer ($176k) is reasonable based on typical stale-listing flexibility.
Questions for the listing agent
- It's been on market 193 days. Have you received any prior offers? Is the seller open to a 12% concession, seller financing, or rate buy-down credit?
- Have any recent inspections been done? Can we get a copy of the seller's disclosures and any deferred-maintenance estimates?
- Why hasn't it sold? Are there any deal-killer items the seller is aware of (foundation, flood, title, zoning, code violations)?
- Is there a deadline driving the sale (1031 exchange, divorce, estate, relocation)? That informs how much negotiation room exists.
- Schools are F-rated, which usually means shorter tenancies and higher turnover. Who's the typical renter profile here, and what's been the actual vacancy rate?
- The area grade is low — what's the realistic commute time and amenity access for the typical tenant pool here? Any planned neighborhood developments (good or bad) we should know about?
- What's the average days-on-market for RENTAL listings here right now (not sales)? A rising rental-DOM trend means longer vacancies and softer asking-rent achievability than the comps imply.
- What's the recent tenant-quality profile in this submarket — average credit score on applications, eviction rate, late-payment / NSF rate, and stable-employment percentage? A property-management company in the area should have these aggregated.
- How much new for-sale + rental construction is in the pipeline within 1–3 miles? Heavy new supply typically softens prices + rents 12–24 months out; constrained supply supports both.
Investment metrics
- 1% rule
- 0.89% ✗
- Cap rate
- 6.44%
- Cash-on-cash
- 0.54%
- DSCR
- 1.02
- GRM
- 9.4
CMA / ARV
- ARV (median comp)
- $226,590
- List price
- $199,540
- Delta
- -11.94%
- Verdict
- UNDERPRICED
- Comps
- 20 within 1.0 mi
Show comp detail 8 sales within ~0.75 mi
| Address | Dist | Beds/Ba | Sqft | Sold | Price | $/sf | Match |
|---|---|---|---|---|---|---|---|
| 31027 Perdido Valley Ln | 0.15mi | 3/2.0 | 1,405 (0%) | 3mo | $209,540 | $149 | 90 |
| 31032 Perdido Valley Ln | 0.18mi | 3/2.0 | 1,405 (0%) | 3mo | $209,540 | $149 | 89 |
| 31029 Perdido Valley Ln | 0.15mi | 3/2.0 | 1,426 (+2%) | 3mo | $209,590 | $147 | 88 |
| 31024 Perdido Valley Ln | 0.18mi | 3/2.0 | 1,426 (+2%) | 3mo | $204,940 | $144 | 86 |
| 1242 Minorca St | 0.21mi | 3/2.0 | 1,283 (-9%) | 1mo | $210,990 | $164 | 75 |
| 31031 Perdido Valley Ln | 0.15mi | 4/2.0 (+1) | 1,557 (+11%) | 1mo | $224,040 | $144 | 69 |
| 1216 Peter Pine St | 0.29mi | 3/2.0 | 1,606 (+14%) | 5mo | $259,000 | $161 | 58 |
| 7 Magnolia Ln | 0.60mi | 2/1.0 (-1) | 1,570 (+12%) | 13mo | $299,000 | $190 | 33 |
Match score weights: distance 35% · size 25% · config 20% · recency 20%. Top-matched comps best support the ARV.
Projected returns pro-forma
-3.0% appreciation · 3.0% rent growth · sell at horizon
- IRR
- -15.4%
- Equity multiple
- 0.45×
- Total profit
- $-34,861
- Equity at exit
- $33,785
- IRR
- -6.9%
- Equity multiple
- 0.56×
- Total profit
- $-27,882
- Equity at exit
- $19,591
Cash invested: $63,445 (down + closing). Projections, not guarantees.
Landlord ↔ Tenant lean methodology
- Overall (STATE)
- 87 Strongly Landlord-Friendly
- State Texas
- 87 Strongly Landlord-Friendly · R+5
- County
- — inherits STATE
- City
- — inherits STATE
ZIP-level market 77336
- Home prices YoY
- -1.8%
- Active inventory
- 585
- Price-to-rent
- 8.2×
Monthly cashflow live
- Estimated rent
- $2,018 medium interval (Pro) →
- Mortgage (P&I)
- −$1,188
- Tax est. 1.5%
- −$283 /mo · $3,399/yr
- Insurance
- −$94
- HOA
- −$0
- Vacancy / Maint / Mgmt
- −$424
- Net cashflow
- $29
Break-even live
UW: 25.0% down · 7.5% · 30yr · 1.5% tax · 5.0% vac · 8.0% maint · 8.0% mgmt
Financing live
Cash to close
- Down payment
- $56,648
- Closing costs
- $6,798
- Reserves months
- —
- Total cash needed
- —
Loan-product check · same deal, 3 products live
Conventional
25% down · 7.5% · 30yr
- Down + closing
- —
- Monthly P&I
- —
- Monthly cashflow
- —
- DSCR
- —
- Eligible?
- —
Personal DTI + credit; lowest rate.
DSCR
20% down · 8.5% · 30yr
- Down + closing
- —
- Monthly P&I
- —
- Monthly cashflow
- —
- DSCR
- —
- Eligible?
- —
No personal income docs; deal must DSCR.
Hard money
10% down · 12.0% · 12mo
- Down + closing
- —
- Monthly P&I
- —
- Monthly cashflow
- —
- DSCR
- —
- Eligible?
- —
Short-term bridge; refi at stabilization.
Rent comps 2 comps
| Address | Beds | Baths | Sqft | Rent | $/sqft | DOM | Units | Dist |
|---|---|---|---|---|---|---|---|---|
| 934 Pertuso Ln Huffman, TX | 3.0 | 2.0 | 1360 | $1,800 | $1.32 | 24d | 1 | 0.85mi |
| 31416 Pratola Serra Cir Huffman, TX | 3.0 | 2.0 | 1461 | $1,675 | $1.15 | 2d | 1 | 0.90mi |
Listing history 18 events
-
2026-06-18days on market $199,540 Active 193 DOM
-
2026-06-17price $199,540 Active 192 DOM
-
2026-06-17days on market $201,540 Active 192 DOM
-
2026-06-16days on market $201,540 Active 191 DOM
-
2026-06-15days on market $201,540 Active 190 DOM
-
2026-06-13days on market $201,540 Active 188 DOM
-
2026-06-09days on market $201,540 Active 184 DOM
-
2026-06-08days on market $201,540 Active 183 DOM
-
2026-06-07days on market $201,540 Active 182 DOM
-
2026-06-04days on market $201,540 Active 179 DOM
-
2026-06-03pricedays on market $201,540 Active 178 DOM
-
2026-06-02days on market $200,540 Active 177 DOM
-
2026-06-01days on market $200,540 Active 176 DOM
-
2026-05-31days on market $200,540 Active 175 DOM
-
2026-05-02price $202,540 207-char remark
Show marketing remark (207 chars)
Unwind after a long day in the Glacier's relaxing primary suite, complete with a spa-like primary bathroom. Purpose the flex space located just off the foyer into a useful office or convenient third bedroom.
-
2026-02-12price $199,540 207-char remark
Show marketing remark (207 chars)
Unwind after a long day in the Glacier's relaxing primary suite, complete with a spa-like primary bathroom. Purpose the flex space located just off the foyer into a useful office or convenient third bedroom.
-
2026-02-06price $218,540 207-char remark
Show marketing remark (207 chars)
Unwind after a long day in the Glacier's relaxing primary suite, complete with a spa-like primary bathroom. Purpose the flex space located just off the foyer into a useful office or convenient third bedroom.
-
2025-12-07$209,540 Active 207-char remark
Show marketing remark (207 chars)
Unwind after a long day in the Glacier's relaxing primary suite, complete with a spa-like primary bathroom. Purpose the flex space located just off the foyer into a useful office or convenient third bedroom.
ⓘ Source: listings_history table (triggers on properties + properties_extension) + one-shot
backfill from property_details.listing_events for pre-trigger history.
Nearby sold comps map
Loading sold comps map…
Walkable amenities ~0.75 mi
Loading nearby amenities…
Taxation est. · year 1
- Rental income
- $24,221
- − Mortgage interest
- −$12,693
- − Property taxes
- −$3,399
- − Insurance
- −$1,133
- − Repairs & maintenance
- −$1,938
- − Management
- −$1,938
- − Depreciation
- −$6,592
- Taxable loss
- −$3,470
- Est. tax savings @ 24.0%
- +$833
- After-tax cash flow
- $1,177/yr
For passive investors: Depreciation is non-cash, so a rental often shows a tax loss while cash-flowing — sheltering income. Rental losses are passive: they offset passive income freely, and up to $25,000/yr can offset ordinary (W-2) income if you actively participate and your MAGI is under $100k (phasing out to $0 by $150k); unused losses carry forward. On sale, claimed depreciation is recaptured at up to 25%, and gains may owe capital-gains tax (a 1031 exchange can defer both). Figures are a year-1 estimate at your 24.0% rate — not tax advice; consult a CPA.
Condition & rehab AI · 1 photo
The home requires significant updates to the kitchen and bathrooms, but the rest of the property appears to be in good condition. Potential buyers and renters would benefit from fresh paint, updated appliances, and landscaping improvements.
Repairs flagged
- Major kitchen — No photos provided.
- Major bathrooms — No photos provided.
Value-add opportunities
- Both Painting and updating kitchen and bathrooms — Fresh paint and updated fixtures would enhance the home's appeal and functionality.
- Both Upgrading kitchen appliances — Modern appliances would improve the kitchen's functionality and attract more buyers/renters.
- Both Updating bathroom fixtures and tiles — Fresh, updated bathrooms would significantly improve the home's appeal and functionality.
- Both Landscaping and curb appeal improvements — A well-maintained yard and landscaping would enhance the home's curb appeal and attract more buyers/renters.
Renovation cost estimate screening
| Repair item | Severity | Est. cost |
|---|---|---|
| kitchen · No photos provided. | Major | $15,000–50,000 |
| bathrooms · No photos provided. | Major | $15,000–50,000 |
| Total estimated repair cost · 2 items | $30,000–100,000 |
Value-add ROI direction
- Both Painting and updating kitchen and bathrooms — Fresh paint and updated fixtures would enhance the home's appeal and functionality. ↑
- Both Upgrading kitchen appliances — Modern appliances would improve the kitchen's functionality and attract more buyers/renters. ↑
- Both Updating bathroom fixtures and tiles — Fresh, updated bathrooms would significantly improve the home's appeal and functionality. ↑
- Both Landscaping and curb appeal improvements — A well-maintained yard and landscaping would enhance the home's curb appeal and attract more buyers/renters. ↑
ⓘ Cost ranges are severity-bucket heuristics (US national rule-of-thumb). Get contractor quotes + a written scope before underwriting a rehab budget.
Schools (NCES district)
- District
- Huffman ISD
- NCES district ID
- 4823820
- Math proficiency
- 32% ▼ -9.00%
- Reading proficiency
- 35% ▼ -9.00%
- Median HH income
- $65,848
- Composite
- 30.61/100
- National rank
- #6195
- State rank
- #500 of 826 in TX
Livability — Plum Grove
- Score
- 58/100
- State rank
- #1206
- US rank
- #21049
Category grades
Schools grade is shown separately in the Schools card above.
Census & demographics
- County
- Harris County · 4,702,590 people
- City population
- 3,226,434
- Metro
- Houston-The Woodlands-Sugar Land, TX
- Population (ZIP)
- 14,342
- Household income
- $96,404
- Rent vs Own
- Severe rent burden
- 377.0
Population outlook (Harris County) Hauer SSP2
- Today (2025)
- 5,571,493 people
- By 2030
- 6,089,821 · +9.3%
- By 2040
- 7,142,806 · +28.2%
- By 2050
- 8,185,864 · +46.9%
- By 2075
- 10,574,329 · +89.8%
- By 2100
- 12,109,958 · +117.4%
Race, ethnicity, and origin ACS 2023
- Neighborhood character
- Majority White (65%)
- Race & ethnicity
- White 65% Hispanic / Latino 23% Two or more races 9% Black 5% Native American 4%
- Hispanic origin (detail)
- Mexican 20%
- Common ancestry
- Lithuanian 4% Slovak 2% Romanian 2%
- Foreign-born
- 9% · Canada
- Languages at home
- 79% English-only · Spanish 18% Other Indo-European 2%
Political lean MEDSL · Harris
- 2024 margin
- Lean D (+5.5) · D 52.0% · R 46.4% · Other 1.6%
- 2008→2024 swing
- +3.9pp toward D · 2008: 1.6pp · 2024: 5.5pp
- All cycles
- 2024: D+5.5 2020: D+13.3 2016: D+12.4 2012: D+0.1 2008: D+1.6
Not yet ingested
- Civics
- —
Market trends
- HPI YoY
- ▼ -8.59%
- Current HPI
- 472.03
- Rent YoY
- —
- Metro
- Houston-The Woodlands-Sugar Land, TX
- State GDP YoY
- ▲ 3.95%
- F500 in state
- 110
Industry mix (Fortune 500 HQ in TX)
| Industry | F500 HQs | Revenue |
|---|---|---|
| Energy | 16 | $1,198B |
|
||
| Technology | 5 | $198B |
|
||
| Engineering / Construction | 4 | $72B |
|
||
| Energy Services | 3 | $60B |
|
||
| Utilities | 3 | $41B |
|
||
| Healthcare | 2 | $330B |
|
||
Price history
-3.3% since first listed4 events — show timeline
- 2026-05-02 Price Changed $202,540 Zillow
- 2026-02-12 Price Changed $199,540 Zillow
- 2026-02-06 Price Changed $218,540 Zillow
- 2025-12-07 Listed $209,540 Zillow
Cash-flow waterfall
monthlySold comps — $/sqft
last 12 mo · ≤1 miLoading sold comps…