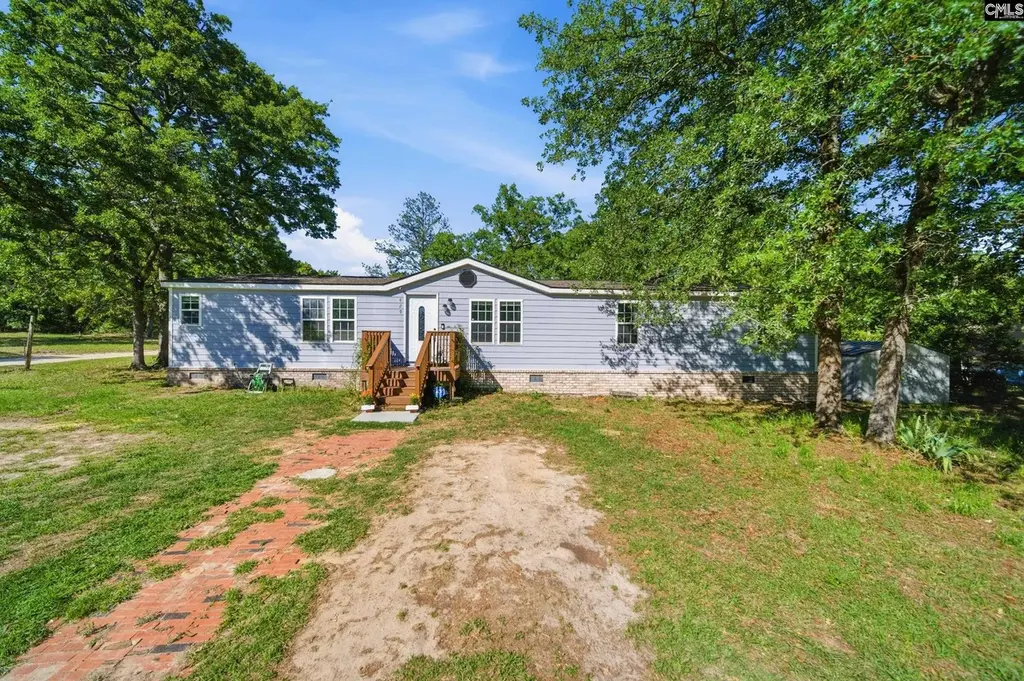
429 Fallaw Rd · Gaston, SC
Flood risk 4/10 · Minor
- FEMA flood zone
- X (unshaded)
- Chance of flooding over 30 yrs
- 0.22%
- Est. flood insurance / yr
- $507 – $1,088
Fire risk 6/10 · Moderate
- Est. fire insurance / yr
- $783 – $1,453
Heat risk 7/10 · Major
- Hot days now (above 107°F)
- 7 days/yr
- Hot days in 30 yrs
- 16 days/yr
Wind risk 6/10 · Moderate
- Chance of severe wind over 30 yrs
- 68.0%
Air-quality risk 3/10 · Minor
- Unhealthy air days now
- 2 days/yr
- Unhealthy air days in 30 yrs
- 2 days/yr
Risk factors via First Street. Map © Google.
Why this score? — see what drove the D grade
The composite is a weighted blend of 9 inputs, each scored 0–100. Each bar is that input's sub-score; the figure is the points it added to the 100-point composite (weight × sub-score).
- Cash flow +17.4/30.0
- ARV discount +7.5/15.0
- DSCR +5.4/10.0
- 1% rule +3.5/10.0
- Livability +3.2/5.0
- Rent growth +2.5/5.0
- Condition / age +2.5/5.0
- Schools +1.6/10.0
- Appreciation +0.9/10.0
$195,000
🖨 Deal sheet (PDF) 📄 Offer letter ✓ Due diligence
Listing remarks
This inviting home at 429 Fallaw Road in Gaston offers the space and serenity many families dream of finding. Set on a peaceful, tree shaded lot, the 1,976 square foot residence provides five bedrooms and three full bathrooms, creating a flexible layout that easily adapts to growing households, remote work needs, or multi generational living. Inside, the thoughtfully designed floor plan flows with ease. Multiple living areas give everyone room to gather or retreat, while generously sized bedrooms extend comfort and privacy. Natural light fills the spaces, highlighting the home's practical yet welcoming character, perfect for both relaxed weekends and lively gatherings with friends and famil
Key facts
- 0.7 acre lot
- Built 2002
- Listed 10 days
Tags
Property features AI
Exterior
- Utilities: Public water; Septic sewer
- Home design: Single-story home
- Construction: Crawlspace foundation
- Exterior features: Vinyl exterior; Paved road access; 0.7-acre lot
Interior
- Bedrooms: Master bedroom on the main level
- Bathrooms: Three full bathrooms
- Heating & cooling: Central heating; Central air conditioning
- Interior features: Central heating and central air
Neighborhood map
What this means for you Summary
Snapshot
- This is a 3-bed/2.0-bath manufactured listed at $195k.
Deal economics
- At list price, monthly cash flow is $145 ($2k/yr) — positive.
- The deal already cash-flows at list — no discount required.
- To meet the 1% rule (rent ≥ 1% of price), the offer needs to be $165k (15.4% below list).
- Recommended offer: $165k (15.4% below list) — sets the bar for 1% rule.
Location & tenants
- Location reads 65/100 on livability (#142 in SC) — a middle-class / working-renter tenant base. Strengths: cost of living A+, housing A+, health & safety B; Watch: crime F, amenities F, commute F.
- Lexington 04 (rural): math 14% / reading 25% proficiency, ranked #70 of 80 in SC (top 88%) — low school quality limits family demand, transient renter base, plan for 1-2y turnover; 69% free/reduced lunch — lower-income household profile, screen leases tightly.
- Zoned schools: Sandhills Primary (506 students, 100% FRL); Frances F. Mack Intermediate (math 14% / reading 18%, grade F, #196 of 229 statewide, top 87%, 538 students, 100% FRL); Swansea High (math 10% / reading 72%, grade F, #177 of 196 statewide, top 91%, 683 students, 100% FRL) — zoned schools average 100% FRL vs 69% district-wide (31 pts higher); higher-poverty schools than district average — tighter screening recommended.
- Market conditions: 140 active listings in the ZIP; 1,712 units permitted in Lexington County in 2024 (0 in 5+ unit buildings).
Forward outlook
- Local home prices are declining (-3.0%/yr); year-one equity from $1k of loan paydown is wiped out by about $6k of value loss. Plan a longer hold.
- Lexington County population projected at +26% by 2050 — long-run rental-demand tailwind backs the buy-and-hold thesis.
Negotiation context
- Only 10 days on market — expect competitive offers; lowballing is unlikely to land.
- 4 sale attempts since 5y ago with the ask held roughly flat each time — persistent listings suggest the price (not the market) is what's stuck; bring a comps-based counter.
Risks & watch-outs
- Climate carrying-cost: major wind risk, 68% chance of damaging wind over 30y; major wildfire risk; extreme-heat days projected 7→16/yr by 2055 (HVAC capex compounding) — expect insurance premiums to compound above CPI over the hold.
Questions for the listing agent
- Is there a deadline driving the sale (1031 exchange, divorce, estate, relocation)? That informs how much negotiation room exists.
- Schools are F-rated, which usually means shorter tenancies and higher turnover. Who's the typical renter profile here, and what's been the actual vacancy rate?
- Crime grade is F in this area — have there been break-ins, vandalism, or insurance claims at this property in the last 3 years? What carrier currently insures it and at what premium?
- The area grade is low — what's the realistic commute time and amenity access for the typical tenant pool here? Any planned neighborhood developments (good or bad) we should know about?
- What's the average days-on-market for RENTAL listings here right now (not sales)? A rising rental-DOM trend means longer vacancies and softer asking-rent achievability than the comps imply.
- What's the recent tenant-quality profile in this submarket — average credit score on applications, eviction rate, late-payment / NSF rate, and stable-employment percentage? A property-management company in the area should have these aggregated.
- How much new for-sale + rental construction is in the pipeline within 1–3 miles? Heavy new supply typically softens prices + rents 12–24 months out; constrained supply supports both.
Investment metrics
- 1% rule
- 0.85% ✗
- Cap rate
- 7.18%
- Cash-on-cash
- 3.18%
- DSCR
- 1.14
- GRM
- 9.9
CMA / ARV
No comps found within radius.
Projected returns pro-forma
-3.0% appreciation · 3.0% rent growth · sell at horizon
- IRR
- -11.3%
- Equity multiple
- 0.59×
- Total profit
- $-22,471
- Equity at exit
- $29,075
- IRR
- -2.2%
- Equity multiple
- 0.85×
- Total profit
- $-8,067
- Equity at exit
- $16,860
Cash invested: $54,600 (down + closing). Projections, not guarantees.
Landlord ↔ Tenant lean methodology
- Overall (STATE)
- 90 Strongly Landlord-Friendly
- State South Carolina
- 90 Strongly Landlord-Friendly · R+6
- County
- — inherits STATE
- City
- — inherits STATE
ZIP-level market 29053
- Home prices YoY
- -2.9%
- Active inventory
- 140
- Price-to-rent
- 9.9×
Monthly cashflow live
- Estimated rent
- $1,650 medium interval (Pro) →
- Mortgage (P&I)
- −$1,023
- Tax from tax record
- −$55 /mo · $656/yr
- Insurance
- −$81
- HOA
- −$0
- Vacancy / Maint / Mgmt
- −$346
- Net cashflow
- $145
Break-even live
Sensitivity live
| Price | -10% $255 | -5% $200 | +0% $145 | +5% $90 | +10% $34 |
|---|---|---|---|---|---|
| Rent | -10% $14 | -5% $80 | +0% $145 | +5% $210 | +10% $275 |
| Rate | -1.0pp $243 | -0.5pp $194 | base $145 | +0.5pp $94 | +1.0pp $43 |
UW: 25.0% down · 7.5% · 30yr · 1.5% tax · 5.0% vac · 8.0% maint · 8.0% mgmt
Financing live
Cash to close
- Down payment
- $48,750
- Closing costs
- $5,850
- Reserves months
- —
- Total cash needed
- —
Loan-product check · same deal, 3 products live
Conventional
25% down · 7.5% · 30yr
- Down + closing
- —
- Monthly P&I
- —
- Monthly cashflow
- —
- DSCR
- —
- Eligible?
- —
Personal DTI + credit; lowest rate.
DSCR
20% down · 8.5% · 30yr
- Down + closing
- —
- Monthly P&I
- —
- Monthly cashflow
- —
- DSCR
- —
- Eligible?
- —
No personal income docs; deal must DSCR.
Hard money
10% down · 12.0% · 12mo
- Down + closing
- —
- Monthly P&I
- —
- Monthly cashflow
- —
- DSCR
- —
- Eligible?
- —
Short-term bridge; refi at stabilization.
Listing history 11 events
-
2026-05-15$195,000 Active
-
2022-02-23soldstatus $179,999
-
2022-01-21historical
-
2022-01-11status Active
-
2021-12-26historical
-
2021-12-21status Active
-
2021-12-12historical
-
2021-12-09price $179,999
-
2021-11-18$180,000 Active
-
2004-12-17soldstatus $69,000
-
2004-04-09soldstatus $14,900
ⓘ Source: listings_history table (triggers on properties + properties_extension) + one-shot
backfill from property_details.listing_events for pre-trigger history.
Tax reassessment forecast SC · Resets to sale price
- Current annual tax
- $656 · $55/mo
- Projected year-2 tax
- $1,112 · $93/mo
- Expected delta
- +$455/yr (+$38/mo · 69.4%)
ⓘ Screening estimate from a state-policy table — verify with the county assessor before closing.
Climate risk First Street
- Flood 4/10 Moderate FEMA zone X (unshaded) · 22% chance over 30 yrs
- Wildfire 6/10 Major
- Heat 7/10 Severe 7 d/yr ≥107°F today · 16 d/yr by 30 yrs out
- Wind 6/10 Major 68% chance of damaging wind over 30 yrs
- Air quality 3/10 Moderate 2 unhealthy d/yr today · 2 by 30 yrs out
Nearby sold comps map
Loading sold comps map…
Walkable amenities ~0.75 mi
Loading nearby amenities…
Taxation est. · year 1
- Rental income
- $19,797
- − Mortgage interest
- −$10,923
- − Property taxes
- −$656
- − Insurance
- −$975
- − Repairs & maintenance
- −$1,584
- − Management
- −$1,584
- − Depreciation
- −$5,673
- Taxable loss
- −$1,598
- Est. tax savings @ 24.0%
- +$383
- After-tax cash flow
- $2,120/yr
For passive investors: Depreciation is non-cash, so a rental often shows a tax loss while cash-flowing — sheltering income. Rental losses are passive: they offset passive income freely, and up to $25,000/yr can offset ordinary (W-2) income if you actively participate and your MAGI is under $100k (phasing out to $0 by $150k); unused losses carry forward. On sale, claimed depreciation is recaptured at up to 25%, and gains may owe capital-gains tax (a 1031 exchange can defer both). Figures are a year-1 estimate at your 24.0% rate — not tax advice; consult a CPA.
Schools (NCES district)
- District
- Lexington 04
- NCES district ID
- 4502790
- Math proficiency
- 14% ▼ -2.00%
- Reading proficiency
- 25% ▼ -1.00%
- Median HH income
- $38,722
- Composite
- 16.38/100
- National rank
- #9198
- State rank
- #70 of 80 in SC
Livability — Gaston
- Score
- 65/100
- State rank
- #142
- US rank
- #13451
Category grades
Schools grade is shown separately in the Schools card above.
Census & demographics
- City population
- 20,818
- Population (ZIP)
- 20,818
Population outlook (Lexington County) Hauer SSP2
- Today (2025)
- 322,999 people
- By 2030
- 342,356 · +6.0%
- By 2040
- 377,715 · +16.9%
- By 2050
- 406,984 · +26.0%
- By 2075
- 465,447 · +44.1%
- By 2100
- 485,674 · +50.4%
Race, ethnicity, and origin ACS 2023
- Neighborhood character
- Diverse neighborhood (Simpson 0.63)
- Race & ethnicity
- White 53% Black 21% Hispanic / Latino 21% Two or more races 11%
- Hispanic origin (detail)
- Mexican 14% Puerto Rican 3%
- Common ancestry
- Slovak 2% Serbian 2% Lithuanian 1%
- Foreign-born
- 9% · Canada, Dominican Republic
- Languages at home
- 81% English-only · Spanish 18%
Political lean MEDSL · Lexington
- 2024 margin
- Solid R (+33.5) · D 32.5% · R 66.0% · Other 1.4%
- 2008→2024 swing
- +4.6pp toward D · 2008: -38.0pp · 2024: -33.5pp
- All cycles
- 2024: R+33.5 2020: R+30.1 2016: R+36.7 2012: R+37.8 2008: R+38.0
Not yet ingested
- Civics
- —
Market trends
- HPI YoY
- ▼ -8.19%
- Current HPI
- 272.1711
- Rent YoY
- —
- Metro
- —
- State GDP YoY
- ▲ 4.51%
- F500 in state
- 2
Industry mix (Fortune 500 HQ in SC)
| Industry | F500 HQs | Revenue |
|---|---|---|
| Packaging | 1 | $7B |
|
||
Price history
+1208.7% since first listed11 events — show timeline
- 2026-05-15 Listed $195,000 Consolidated MLS
- 2022-02-23 Sold (Public Records) $179,999 Public Records
- 2022-01-21 Delisted — Consolidated MLS
- 2022-01-11 Relisted — Consolidated MLS
- 2021-12-26 Delisted — Consolidated MLS
- 2021-12-21 Relisted — Consolidated MLS
- 2021-12-12 Delisted — Consolidated MLS
- 2021-12-09 Price Changed $179,999 Consolidated MLS
- 2021-11-18 Listed $180,000 Consolidated MLS
- 2004-12-17 Sold (Public Records) $69,000 Public Records
- 2004-04-09 Sold (Public Records) $14,900 Public Records
Property tax history
+9.0%/yrLatest (2024): $656 · -86.5% YoY. Source: county tax records.
Cash-flow waterfall
monthlySold comps — $/sqft
last 12 mo · ≤1 miLoading sold comps…