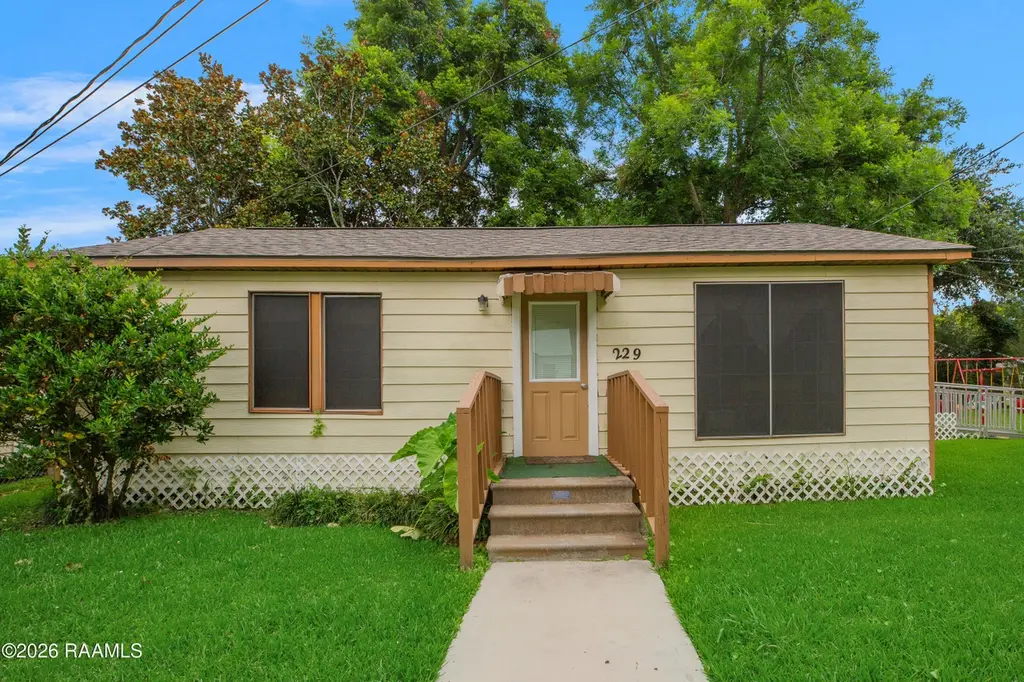
229 St De Porres St · Broussard, LA
Flood risk 4/10 · Minor
- FEMA flood zone
- X (unshaded)
- Chance of flooding over 30 yrs
- 0.22%
- Est. flood insurance / yr
- $507 – $1,088
Fire risk 1/10 · Minimal
- Est. fire insurance / yr
- $1,269 – $2,357
Heat risk 9/10 · Severe
- Hot days now (above 108°F)
- 7 days/yr
- Hot days in 30 yrs
- 21 days/yr
Wind risk 9/10 · Severe
- Chance of severe wind over 30 yrs
- 99.0%
Air-quality risk 1/10 · Minimal
- Unhealthy air days now
- 0 days/yr
- Unhealthy air days in 30 yrs
- 0 days/yr
Risk factors via First Street. Map © Google.
Why this score? — see what drove the B- grade
The composite is a weighted blend of 9 inputs, each scored 0–100. Each bar is that input's sub-score; the figure is the points it added to the 100-point composite (weight × sub-score).
- Cash flow +30.0/30.0
- DSCR +10.0/10.0
- 1% rule +8.2/10.0
- ARV discount +7.5/15.0
- Schools +3.6/10.0
- Livability +3.6/5.0
- Rent growth +2.5/5.0
- Condition / age +2.5/5.0
- Appreciation +0.0/10.0
$170,000
🖨 Deal sheet 📄 Offer letter ✓ Due diligence
Listing remarks MLS
Investor special! 2 single family homes on one large lot. One home 1,600 SF and the other 1,900 SF. Previously used a child care facility these dwellings could be refurbished to rental units. Could be sold separately or collectively. Situated 1 block from Katharine Drexel Elementary School in Broussard. Ownerwould consider subdividing for an acceptable offer.
Key facts
- Large lot
- 0.34 acre lot
- Listed 63 days
Tags
Neighborhood map
What this means for you Summary
Snapshot
- This is a 4-bed/4.0-bath single-family listed at $170k.
Deal economics
- At list price, monthly cash flow is $650 ($8k/yr) — positive.
- The deal already cash-flows at list — no discount required.
- Meets the 1% rule at list price ($2k rent vs $170k).
- Recommended offer: $160k (6.0% below list) — sets the bar for market timing.
- Cap rate 10.9% vs local median 4.7% in Broussard — top-decile yield for the area; either an underpriced asset or a hidden risk that comps aren't pricing in. Stress-test before assuming the spread holds.
Location & tenants
- Location reads 71/100 on livability (#49 in LA) — a middle-class / working-renter tenant base. Strengths: housing A+, cost of living A-, schools B+; Watch: amenities F, commute F, health & safety F.
- Lafayette Parish (urban): math 38% / reading 46% proficiency, ranked #19 of 98 in LA (top 19%) — families likely to look elsewhere, expect single-tenant / working-renter base with shorter leases.
- Market conditions: 339 active listings in the ZIP; 9 comparable units currently listed for rent nearby; rentals at typical pace (median 21d on market — plan ~3-4 weeks tenant-placement turnaround); 44% of comp listings sitting > 30 days — soft ceiling on asking rent; solid renter incomes; 1,585 units permitted in Lafayette Parish in 2024 (10 in 5+ unit buildings).
Forward outlook
- Local home prices are declining (-3.0%/yr); year-one equity from $1k of loan paydown is wiped out by about $5k of value loss. Plan a longer hold.
- Lafayette County population projected at +34% by 2050 — long-run rental-demand tailwind backs the buy-and-hold thesis.
- At projected returns (-3.0% appreciation + 3.0% rent growth), your $48k cash investment doubles in ~8 years — after that, you're playing with house money.
Negotiation context
- It's been on market 63 days — a 6% lower offer ($160k) is reasonable based on typical stale-listing flexibility.
Risks & watch-outs
- Watch-outs: built in 1955 — expect roof / HVAC / electrical / plumbing capex.
- Climate carrying-cost: severe wind risk, 99% chance of damaging wind over 30y; extreme-heat days projected 7→21/yr by 2055 (HVAC capex compounding) — expect insurance premiums to compound above CPI over the hold.
Questions for the listing agent
- It's been on market 63 days. Have you received any prior offers? Is the seller open to a 6% concession, seller financing, or rate buy-down credit?
- Built in 1955 — when were the roof, HVAC, electrical panel, plumbing, and water heater last replaced?
- Why hasn't it sold? Are there any deal-killer items the seller is aware of (foundation, flood, title, zoning, code violations)?
- Is there a deadline driving the sale (1031 exchange, divorce, estate, relocation)? That informs how much negotiation room exists.
- Schools are B-rated — typically a magnet for longer-tenancy family renters. What's the average tenant stay here, and is there a school-zone premium baked into asking?
- What's the average days-on-market for RENTAL listings here right now (not sales)? A rising rental-DOM trend means longer vacancies and softer asking-rent achievability than the comps imply.
- What's the recent tenant-quality profile in this submarket — average credit score on applications, eviction rate, late-payment / NSF rate, and stable-employment percentage? A property-management company in the area should have these aggregated.
- How much new for-sale + rental construction is in the pipeline within 1–3 miles? Heavy new supply typically softens prices + rents 12–24 months out; constrained supply supports both.
Investment metrics
- 1% rule
- 1.32% ✓
- Cap rate
- 10.88%
- Cash-on-cash
- 16.40%
- DSCR
- 1.73
- GRM
- 6.3
CMA / ARV
- ARV (median comp)
- $640,241
- List price
- $170,000
- Delta
- -73.45%
- Verdict
- UNDERPRICED
- Comps
- 11 within 1.0 mi
Show comp detail 12 sales within ~0.75 mi
| Address | Dist | Beds/Ba | Sqft | Sold | Price | $/sf | Match |
|---|---|---|---|---|---|---|---|
| 106 Willowview Dr | 0.19mi | 3/2.0 (-1) | 1,655 (+5%) | 11mo | $229,000 | $138 | 61 |
| 304 W Broussard St | 0.59mi | 4/2.0 | 1,426 (-10%) | 2mo | $152,000 | $107 | 47 |
| 811 Flambant Dr | 0.70mi | 3/2.0 (-1) | 1,648 (+4%) | 1mo | $245,000 | $149 | 46 |
| 311 S Morgan Ave | 0.47mi | 3/2.0 (-1) | 1,705 (+8%) | 11mo | $117,500 | $69 | 43 |
| 114 Fallow Ln | 0.48mi | 3/2.0 (-1) | 1,703 (+8%) | 13mo | $312,000 | $183 | 41 |
| 507 Huval Dr | 0.69mi | 3/2.0 (-1) | 1,644 (+4%) | 10mo | $250,000 | $152 | 40 |
| 100 Village Square Dr | 0.40mi | 3/2.5 (-1) | 1,373 (-13%) | 11mo | $185,000 | $135 | 39 |
| 809 Flambant Dr | 0.69mi | 3/2.0 (-1) | 1,692 (+7%) | 9mo | $260,000 | $154 | 36 |
| 813 Flambant Dr | 0.71mi | 3/2.0 (-1) | 1,720 (+9%) | 5mo | $295,000 | $172 | 35 |
| 504 E 3rd St | 0.44mi | 3/1.0 (-1) | 1,350 (-15%) | 6mo | $150,000 | $111 | 33 |
| 302 Avenue C | 0.56mi | 3/2.0 (-1) | 1,800 (+14%) | 12mo | $165,000 | $92 | 28 |
| 112 N St Pierre St | 0.70mi | 3/1.5 (-1) | 1,345 (-15%) | 14mo | $125,000 | $93 | 16 |
Match score weights: distance 35% · size 25% · config 20% · recency 20%. Top-matched comps best support the ARV.
Projected returns pro-forma
-3.0% appreciation · 3.0% rent growth · sell at horizon
- IRR
- 7.5%
- Equity multiple
- 1.29×
- Total profit
- $13,875
- Equity at exit
- $25,348
- IRR
- 16.7%
- Equity multiple
- 2.37×
- Total profit
- $65,427
- Equity at exit
- $14,698
Cash invested: $47,600 (down + closing). Projections, not guarantees.
Landlord ↔ Tenant lean methodology
- Overall (STATE)
- 90 Strongly Landlord-Friendly
- State Louisiana
- 90 Strongly Landlord-Friendly · R+12
- County
- — inherits STATE
- City
- — inherits STATE
ZIP-level market 70518
- Home prices YoY
- -16.0%
- Active inventory
- 339
- Price-to-rent
- 6.3×
Monthly cashflow live
- Estimated rent
- $2,245 high interval (Pro) →
- Mortgage (P&I)
- −$891
- Tax from tax record
- −$161 /mo · $1,929/yr
- Insurance
- −$71
- HOA
- −$0
- Vacancy / Maint / Mgmt
- −$471
- Net cashflow
- $650
Break-even live
UW: 25.0% down · 7.5% · 30yr · 1.5% tax · 5.0% vac · 8.0% maint · 8.0% mgmt
Financing live
Cash to close
- Down payment
- $42,500
- Closing costs
- $5,100
- Reserves months
- —
- Total cash needed
- —
Loan-product check · same deal, 3 products live
Conventional
25% down · 7.5% · 30yr
- Down + closing
- —
- Monthly P&I
- —
- Monthly cashflow
- —
- DSCR
- —
- Eligible?
- —
Personal DTI + credit; lowest rate.
DSCR
20% down · 8.5% · 30yr
- Down + closing
- —
- Monthly P&I
- —
- Monthly cashflow
- —
- DSCR
- —
- Eligible?
- —
No personal income docs; deal must DSCR.
Hard money
10% down · 12.0% · 12mo
- Down + closing
- —
- Monthly P&I
- —
- Monthly cashflow
- —
- DSCR
- —
- Eligible?
- —
Short-term bridge; refi at stabilization.
Rent comps 9 comps
| Address | Beds | Baths | Sqft | Rent | $/sqft | DOM | Units | Dist |
|---|---|---|---|---|---|---|---|---|
| 711 E Main St #100 Broussard, LA | 3.0 | 2.0 | 1644 | $2,750 | $1.67 | 43d | 1 | 0.26mi |
| 106 Padre Dr Broussard, LA | 3.0 | 2.0 | 1180 | $1,500 | $1.27 | 21d | 1 | 0.37mi |
| 620 W Main St Broussard, LA | 3.0 | 2.0 | 1587 | $1,600 | $1.01 | 43d | 1 | 1.02mi |
| 213 Longleaf Dr Broussard, LA | 3.0 | 2.0 | 1653 | $2,000 | $1.21 | 21d | 1 | 1.07mi |
| 232 Saint Nazaire Rd Broussard, LA | 1.0–3.0 | 1.0–2.0 | 1080 | $1,715 | $1.59 | 13d | 9 | 1.09mi |
| 106 Clearwater Dr Broussard, LA | 3.0 | 2.5 | 1838 | $2,200 | $1.20 | 21d | 1 | 1.16mi |
| 231 Saint Nazaire Rd Broussard, LA | 1.0–3.0 | 1.0–2.0 | 1080 | $1,715 | $1.59 | 13d | 27 | 1.17mi |
| 425 Heart D Farm Rd Youngsville, LA | 3.0 | 2.5 | 1778 | $3,250 | $1.83 | 43d | 1 | 1.31mi |
| 126 Heathwood Dr Broussard, LA | 4.0 | 3.0 | 1989 | $2,500 | $1.26 | 43d | 1 | 1.37mi |
Listing history 18 events
-
2026-06-18days on market $170,000 Active 63 DOM
-
2026-06-17days on market $170,000 Active 62 DOM
-
2026-06-16days on market $170,000 Active 61 DOM
-
2026-06-15days on market $170,000 Active 60 DOM
-
2026-06-14days on market $170,000 Active 58 DOM
-
2026-06-13days on market $170,000 Active 57 DOM
-
2026-06-10days on market $170,000 Active 55 DOM
-
2026-06-09days on market $170,000 Active 54 DOM
-
2026-06-08days on market $170,000 Active 53 DOM
-
2026-06-07days on market $170,000 Active 52 DOM
-
2026-06-05days on market $170,000 Active 49 DOM
-
2026-06-03days on market $170,000 Active 48 DOM
-
2026-06-02days on market $170,000 Active 47 DOM
-
2026-06-01days on market $170,000 Active 46 DOM
-
2026-05-31days on market $170,000 Active 45 DOM
-
2026-05-30days on market $170,000 Active 44 DOM
-
2026-04-16price $170,000 361-char remark
Show marketing remark (361 chars)
Investor special! 2 single family homes on one large lot. One home 1,600 SF and the other 1,900 SF. Previously used a child care facility these dwellings could be refurbished to rental units. Could be sold separately or collectively. Situated 1 block from Katharine Drexel Elementary School in Broussard. Ownerwould consider subdividing for an acceptable offer.
-
2026-04-16$230,000 Active 361-char remark
Show marketing remark (361 chars)
Investor special! 2 single family homes on one large lot. One home 1,600 SF and the other 1,900 SF. Previously used a child care facility these dwellings could be refurbished to rental units. Could be sold separately or collectively. Situated 1 block from Katharine Drexel Elementary School in Broussard. Ownerwould consider subdividing for an acceptable offer.
ⓘ Source: listings_history table (triggers on properties + properties_extension) + one-shot
backfill from property_details.listing_events for pre-trigger history.
Tax reassessment forecast LA · Resets to sale price
- Current annual tax
- $1,929 · $161/mo
- Projected year-2 tax
- $1,929 · $161/mo
- Expected delta
- $0/yr ($0/mo · 0.0%)
ⓘ Screening estimate from a state-policy table — verify with the county assessor before closing.
Climate risk First Street
- Flood 4/10 Moderate FEMA zone X (unshaded) · 22% chance over 30 yrs
- Wildfire 1/10 Low
- Heat 9/10 Extreme 7 d/yr ≥108°F today · 21 d/yr by 30 yrs out
- Wind 9/10 Extreme 99% chance of damaging wind over 30 yrs
- Air quality 1/10 Low 0 unhealthy d/yr today · 0 by 30 yrs out
Nearby sold comps map
Loading sold comps map…
Walkable amenities ~0.75 mi
Loading nearby amenities…
Taxation est. · year 1
- Rental income
- $26,938
- − Mortgage interest
- −$9,523
- − Property taxes
- −$1,929
- − Insurance
- −$850
- − Repairs & maintenance
- −$2,155
- − Management
- −$2,155
- − Depreciation
- −$4,945
- Taxable income
- $5,381
- Est. tax owed @ 24.0%
- −$1,291
- After-tax cash flow
- $6,513/yr
For passive investors: Depreciation is non-cash, so a rental often shows a tax loss while cash-flowing — sheltering income. Rental losses are passive: they offset passive income freely, and up to $25,000/yr can offset ordinary (W-2) income if you actively participate and your MAGI is under $100k (phasing out to $0 by $150k); unused losses carry forward. On sale, claimed depreciation is recaptured at up to 25%, and gains may owe capital-gains tax (a 1031 exchange can defer both). Figures are a year-1 estimate at your 24.0% rate — not tax advice; consult a CPA.
Schools (NCES district)
- District
- Lafayette Parish
- NCES district ID
- 2200870
- Math proficiency
- 38% ▼ -32.00%
- Reading proficiency
- 46% ▼ -24.00%
- Median HH income
- $50,238
- Composite
- 36.15/100
- National rank
- #4741
- State rank
- #19 of 98 in LA
Livability — Broussard
- Score
- 71/100
- State rank
- #49
- US rank
- #7184
Category grades
Schools grade is shown separately in the Schools card above.
Census & demographics
- Census place
- Broussard, LA
- County
- Lafayette Parish · 207,544 people
- City population
- 17,263
- Metro
- Lafayette, LA
- Population (ZIP)
- 17,263
- Household income
- $106,710
- Rent vs Own
- Severe rent burden
- 117.0
Population outlook (Lafayette County) Hauer SSP2
- Today (2025)
- 280,930 people
- By 2030
- 301,092 · +7.2%
- By 2040
- 339,456 · +20.8%
- By 2050
- 375,156 · +33.5%
- By 2075
- 451,672 · +60.8%
- By 2100
- 497,203 · +77.0%
Race, ethnicity, and origin ACS 2023
- Neighborhood character
- Predominantly White (74%)
- Race & ethnicity
- White 74% Black 15% Two or more races 5% Hispanic / Latino 5% Asian 3%
- Hispanic origin (detail)
- Mexican 1%
- Common ancestry
- Lithuanian 20% Romanian 2% Portuguese 1%
- Foreign-born
- 4% · Canada
- Languages at home
- 93% English-only · Spanish 3% Other Asian/Pacific 2% French/Haitian/Cajun 1%
Political lean MEDSL · Lafayette
- 2024 margin
- Solid R (+31.4) · D 33.5% · R 64.8% · Other 1.7%
- 2008→2024 swing
- -0.1pp no change · 2008: -31.3pp · 2024: -31.4pp
- All cycles
- 2024: R+31.4 2020: R+28.7 2016: R+33.6 2012: R+33.7 2008: R+31.3
Not yet ingested
- Civics
- —
Market trends
- HPI YoY
- ▼ -30.65%
- Current HPI
- 160.4167
- Rent YoY
- —
- Metro
- Lafayette, LA
- State GDP YoY
- ▲ 3.29%
- F500 in state
- 10
Industry mix (Fortune 500 HQ in LA)
| Industry | F500 HQs | Revenue |
|---|---|---|
| Telecommunications | 2 | $23B |
|
||
| Utilities | 1 | $12B |
|
||
| Wholesale / Distribution | 1 | $5B |
|
||
| Advertising | 1 | $2B |
|
||
Price history
-26.1% since first listed2 events — show timeline
- 2026-04-16 Price Changed $170,000 AcadianaMLS
- 2026-04-16 Listed $230,000 AcadianaMLS
Property tax history
+0.5%/yrLatest (2025): $1,929 · -1.4% YoY. Source: county tax records.
Cash-flow waterfall
monthlySold comps — $/sqft
last 12 mo · ≤1 miLoading sold comps…