 40-Plex
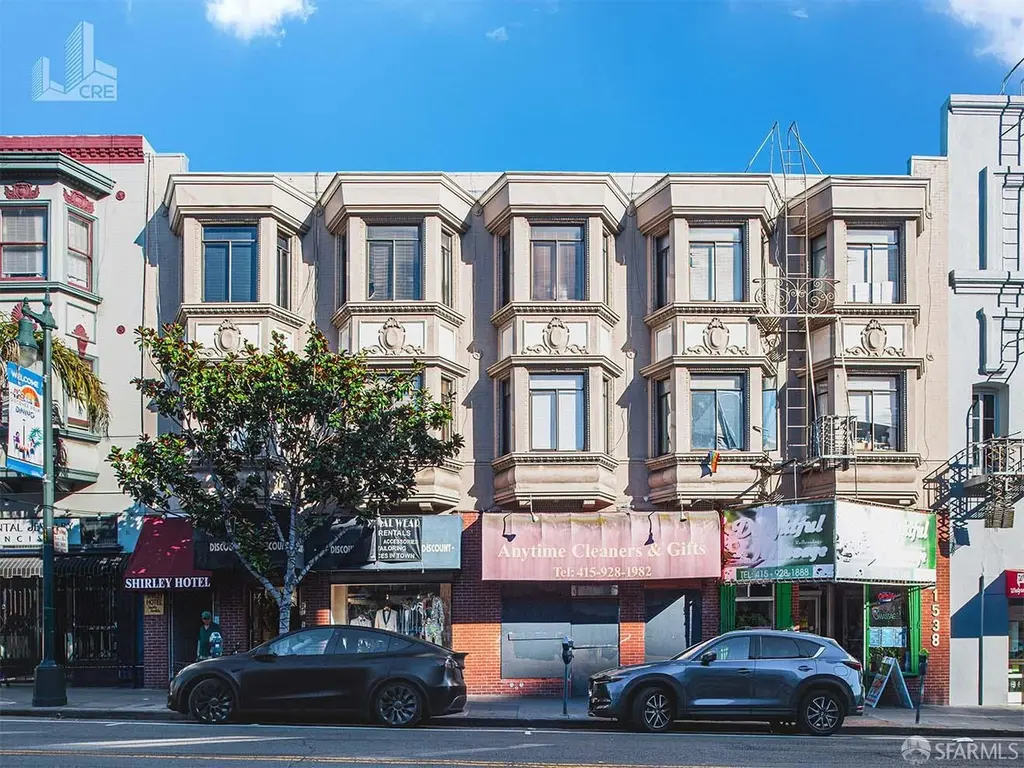
1538-1544 Polk St · San Francisco, CA
Flood risk No data
- FEMA flood zone
- —
- Chance of flooding over 30 yrs
- —
- Est. flood insurance / yr
- —
Fire risk No data
- Est. fire insurance / yr
- —
Heat risk No data
- Hot days now (above threshold)
- —
- Hot days in 30 yrs
- —
Wind risk No data
- Chance of severe wind over 30 yrs
- —
Air-quality risk No data
- Unhealthy air days now
- —
- Unhealthy air days in 30 yrs
- —
Risk factors via First Street. Map © Google.
Why this score? — see what drove the A- grade
The composite is a weighted blend of 9 inputs, each scored 0–100. Each bar is that input's sub-score; the figure is the points it added to the 100-point composite (weight × sub-score).
- Cash flow +30.0/30.0
- 1% rule +10.0/10.0
- DSCR +10.0/10.0
- ARV discount +7.5/15.0
- Appreciation +7.5/10.0
- Rent growth +5.0/5.0
- Schools +5.0/10.0
- Livability +3.8/5.0
- Condition / age +2.2/5.0
$4,500,000
🖨 Deal sheet 📄 Offer letter ✓ Due diligence
Multi-family units
County records classify this as Multi-Family (5+ Unit). Listing-text estimate: 40 units. confirmed
5+ unit building — per-unit beds/baths from public records are typically unavailable; the breakdown below (if shown) is an estimate from the listing text.
Listing remarks MLS
1538-1544 Polk Street is a mixed-use (hotel + retail) property in the Nob Hill/Polk Gulch neighborhood of San Francisco. The three-story property features three (3) retail units on the ground floor and a 40-unit SRO/hotel above that is master leased to an operator, Shirley Hotels. Of the 40 rooms, 21 are SRO units, 7 are SRO with partial baths, 9 are tourist/transient and 3 are for manager use. The SRO units without bathrooms share 3 common area bathrooms. Two of three retail units are occupied by a tuxedo retailer and a foot massage service. The 40 room hotel is currently month-month. A savvy investor may renegotiate the lease or operate the hotel to significantly increase cash flow. The property is in a central location of the Polk Street commercial corridor in Nob Hill. The street is famous for its historic architecture, Michelin-rated cuisine, and abundant retail amenities. It is an exceptional location for this type of property due to its walkability and easy access to public transit. The investment appeal of this property is its location in San Francisco's most desirable neighborhood and its significant upside potential. Proforma CAP 5% based on vacant units rented at market rents.
Key facts
- Retail units
- Central location
- Mixed-use property
Tags
Neighborhood map
What this means for you Summary
Snapshot
- This is a 40 × 1-bed/?-bath units multifamily listed at $4.50M. Condition is rated fair.
Deal economics
- At list price, monthly cash flow is $52k ($622k/yr) — positive. Per door: $1k/mo.
- The deal already cash-flows at list — no discount required.
- Meets the 1% rule at list price ($105k rent vs $4.50M).
- Recommended offer: $4.37M (3.0% below list) — sets the bar for market timing.
- Cap rate 20.1% vs local median 2.1% in San Francisco — top-decile yield for the area; either an underpriced asset or a hidden risk that comps aren't pricing in. Stress-test before assuming the spread holds.
Location & tenants
- Location reads 76/100 on livability (#90 in CA, #3,143 nationally) — a middle-class / working-renter tenant base. Strengths: amenities A+, commute A+, employment A+; Watch: crime F, cost of living F.
- San Francisco Unified (urban): math 50% / reading 56% proficiency, ranked #322 of 1,400 in CA (top 23%) — acceptable for families but not a draw, mixed tenant base, ~2y average lease.
- Market conditions: Rents rising fast (+15.6%/yr); 155 active listings in the ZIP; solid renter incomes; 750 units permitted in San Francisco County in 2024 (688 in 5+ unit buildings).
- At $105,014/mo this rent would consume 1189% of the median local household income ($106k/yr) (locally 5272% of renters already pay >50% of income on rent) — very limited rent-growth headroom before tenants either downsize or default.
Forward outlook
- In year one you build about $257k of equity ($31k loan paydown + $226k appreciation (5.0% local appreciation)).
- San Francisco County population projected at +39% by 2050 — long-run rental-demand tailwind backs the buy-and-hold thesis.
- At projected returns (5.0% appreciation + 8.0% rent growth), your $1.26M cash investment doubles in ~2 years — after that, you're playing with house money.
- By year 2, paydown + projected appreciation supports a ~$412k cash-out refi (75% LTV) — recoverable capital for the next deal without selling this one.
Negotiation context
- It's been on market 56 days — a 3% lower offer ($4.37M) is reasonable based on typical stale-listing flexibility.
- 3 sale attempts since 4y ago with the ask held roughly flat each time — persistent listings suggest the price (not the market) is what's stuck; bring a comps-based counter.
Risks & watch-outs
- Watch-outs: built in 1907 — expect roof / HVAC / electrical / plumbing capex.
Questions for the listing agent
- It's been on market 56 days. Have you received any prior offers? Is the seller open to a 3% concession, seller financing, or rate buy-down credit?
- Can we see the unit-by-unit rent roll, current vacancy, and any below-market leases? What's the average tenancy length?
- What capital expenditures (roof, boiler, parking lot, exteriors) have been made in the last 5 years, and what's planned in the next 2?
- Have any recent inspections been done? Can we get a copy of the seller's disclosures and any deferred-maintenance estimates?
- Built in 1907 — when were the roof, HVAC, electrical panel, plumbing, and water heater last replaced?
- Is there a deadline driving the sale (1031 exchange, divorce, estate, relocation)? That informs how much negotiation room exists.
- Schools are B-rated — typically a magnet for longer-tenancy family renters. What's the average tenant stay here, and is there a school-zone premium baked into asking?
- Crime grade is F in this area — have there been break-ins, vandalism, or insurance claims at this property in the last 3 years? What carrier currently insures it and at what premium?
- What's the average days-on-market for RENTAL listings here right now (not sales)? A rising rental-DOM trend means longer vacancies and softer asking-rent achievability than the comps imply.
- What's the recent tenant-quality profile in this submarket — average credit score on applications, eviction rate, late-payment / NSF rate, and stable-employment percentage? A property-management company in the area should have these aggregated.
- How much new apartment / multifamily construction is in the pipeline within 1–3 miles? Heavy new supply (>2% of stock underway) typically softens rents 12–24 months out; light construction supports rent growth.
Investment metrics
- 1% rule
- 2.33% ✓
- Cap rate
- 20.12%
- Cash-on-cash
- 49.39%
- DSCR
- 3.20
- GRM
- 3.6
CMA / ARV
- ARV (median comp)
- $4,495,946
- List price
- $4,500,000
- Delta
- 0.09%
- Verdict
- FAIR
- Comps
- 20 within 1.0 mi
Show comp detail 4 sales within ~0.75 mi
| Address | Dist | Beds/Ba | Sqft | Sold | Price | $/sf | Match |
|---|---|---|---|---|---|---|---|
| 1400 Jones St | 0.39mi | 30/— | 15,045 (+6%) | 1mo | $7,225,000 | $480 | 70 |
| 1373 Clay St | 0.30mi | 22/18.0 | 16,155 (+14%) | 4mo | $7,280,000 | $451 | 59 |
| 2240 Pacific Ave | 0.67mi | 12/— | 12,138 (-14%) | 2mo | $6,500,000 | $536 | 43 |
| 1715 Webster St | 0.70mi | 26/— | 16,046 (+13%) | 8mo | $6,115,000 | $381 | 39 |
Match score weights: distance 35% · size 25% · config 20% · recency 20%. Top-matched comps best support the ARV.
Projected returns pro-forma
5.02% appreciation · 8.0% rent growth · sell at horizon
- IRR
- 61.4%
- Equity multiple
- 4.89×
- Total profit
- $4,902,379
- Equity at exit
- $2,555,920
- IRR
- 61.2%
- Equity multiple
- 11.55×
- Total profit
- $13,297,002
- Equity at exit
- $4,415,998
Cash invested: $1,260,000 (down + closing). Projections, not guarantees.
Landlord ↔ Tenant lean methodology
- Overall (CITY)
- 0 Strongly Tenant-Friendly
- State California
- 18 Strongly Tenant-Friendly · D+13
- County
- — inherits STATE
- City San Francisco
- 0 Strongly Tenant-Friendly · D+57
ZIP-level market 94109
- Home prices YoY
- 2.9%
- Rents YoY
- 15.6%
- Active inventory
- 155
- Price-to-rent
- 142.8×
Monthly cashflow live
- Estimated rent
- $105,014 high interval (Pro) →
- Mortgage (P&I)
- −$23,598
- Tax est. 1.5%
- −$5,625 /mo · $67,500/yr
- Insurance
- −$1,875
- HOA
- −$0
- Vacancy / Maint / Mgmt
- −$22,053
- Net cashflow
- $51,863
Break-even live
40-unit breakdown (identical units grouped — click to expand)
| Units | Beds | Baths | Est. rent |
|---|---|---|---|
| 40× units | 1 | 0 | $105,000 |
| #1 | 1 | 0 | $2,625 |
| #2 | 1 | 0 | $2,625 |
| #3 | 1 | 0 | $2,625 |
| #4 | 1 | 0 | $2,625 |
| #5 | 1 | 0 | $2,625 |
| #6 | 1 | 0 | $2,625 |
| #7 | 1 | 0 | $2,625 |
| #8 | 1 | 0 | $2,625 |
| #9 | 1 | 0 | $2,625 |
| #10 | 1 | 0 | $2,625 |
| #11 | 1 | 0 | $2,625 |
| #12 | 1 | 0 | $2,625 |
| #13 | 1 | 0 | $2,625 |
| #14 | 1 | 0 | $2,625 |
| #15 | 1 | 0 | $2,625 |
| #16 | 1 | 0 | $2,625 |
| #17 | 1 | 0 | $2,625 |
| #18 | 1 | 0 | $2,625 |
| #19 | 1 | 0 | $2,625 |
| #20 | 1 | 0 | $2,625 |
| #21 | 1 | 0 | $2,625 |
| #22 | 1 | 0 | $2,625 |
| #23 | 1 | 0 | $2,625 |
| #24 | 1 | 0 | $2,625 |
| #25 | 1 | 0 | $2,625 |
| #26 | 1 | 0 | $2,625 |
| #27 | 1 | 0 | $2,625 |
| #28 | 1 | 0 | $2,625 |
| #29 | 1 | 0 | $2,625 |
| #30 | 1 | 0 | $2,625 |
| #31 | 1 | 0 | $2,625 |
| #32 | 1 | 0 | $2,625 |
| #33 | 1 | 0 | $2,625 |
| #34 | 1 | 0 | $2,625 |
| #35 | 1 | 0 | $2,625 |
| #36 | 1 | 0 | $2,625 |
| #37 | 1 | 0 | $2,625 |
| #38 | 1 | 0 | $2,625 |
| #39 | 1 | 0 | $2,625 |
| #40 | 1 | 0 | $2,625 |
| Total (40 units) | $105,014 | ||
UW: 25.0% down · 7.5% · 30yr · 1.5% tax · 5.0% vac · 8.0% maint · 8.0% mgmt
Financing live
Cash to close
- Down payment
- $1,125,000
- Closing costs
- $135,000
- Reserves months
- —
- Total cash needed
- —
Loan-product check · same deal, 3 products live
Conventional
25% down · 7.5% · 30yr
- Down + closing
- —
- Monthly P&I
- —
- Monthly cashflow
- —
- DSCR
- —
- Eligible?
- —
Personal DTI + credit; lowest rate.
DSCR
20% down · 8.5% · 30yr
- Down + closing
- —
- Monthly P&I
- —
- Monthly cashflow
- —
- DSCR
- —
- Eligible?
- —
No personal income docs; deal must DSCR.
Hard money
10% down · 12.0% · 12mo
- Down + closing
- —
- Monthly P&I
- —
- Monthly cashflow
- —
- DSCR
- —
- Eligible?
- —
Short-term bridge; refi at stabilization.
Listing history 17 events
-
2026-06-18days on market $4,500,000 Active 56 DOM
-
2026-06-17days on market $4,500,000 Active 55 DOM
-
2026-06-16days on market $4,500,000 Active 54 DOM
-
2026-06-15days on market $4,500,000 Active 53 DOM
-
2026-06-13days on market $4,500,000 Active 51 DOM
-
2026-06-13days on market $4,500,000 Active 50 DOM
-
2026-06-09days on market $4,500,000 Active 47 DOM
-
2026-06-08days on market $4,500,000 Active 46 DOM
-
2026-06-07days on market $4,500,000 Active 45 DOM
-
2026-06-04days on market $4,500,000 Active 42 DOM
-
2026-06-03days on market $4,500,000 Active 41 DOM
-
2026-06-02days on market $4,500,000 Active 40 DOM
-
2026-06-01days on market $4,500,000 Active 39 DOM
-
2026-05-31days on market $4,500,000 Active 38 DOM
-
2026-04-23$4,500,000 Active 1206-char remark
Show marketing remark (1206 chars)
1538-1544 Polk Street is a mixed-use (hotel + retail) property in the Nob Hill/Polk Gulch neighborhood of San Francisco. The three-story property features three (3) retail units on the ground floor and a 40-unit SRO/hotel above that is master leased to an operator, Shirley Hotels. Of the 40 rooms, 21 are SRO units, 7 are SRO with partial baths, 9 are tourist/transient and 3 are for manager use. The SRO units without bathrooms share 3 common area bathrooms. Two of three retail units are occupied by a tuxedo retailer and a foot massage service. The 40 room hotel is currently month-month. A savvy investor may renegotiate the lease or operate the hotel to significantly increase cash flow. The property is in a central location of the Polk Street commercial corridor in Nob Hill. The street is famous for its historic architecture, Michelin-rated cuisine, and abundant retail amenities. It is an exceptional location for this type of property due to its walkability and easy access to public transit. The investment appeal of this property is its location in San Francisco's most desirable neighborhood and its significant upside potential. Proforma CAP 5% based on vacant units rented at market rents.
-
2025-01-30$5,950,000 Active
-
2022-11-28$5,950,000 Active
ⓘ Source: listings_history table (triggers on properties + properties_extension) + one-shot
backfill from property_details.listing_events for pre-trigger history.
Nearby sold comps map
Loading sold comps map…
Walkable amenities ~0.75 mi
Loading nearby amenities…
Taxation est. · year 1
- Rental income
- $1,260,168
- − Mortgage interest
- −$252,070
- − Property taxes
- −$67,500
- − Insurance
- −$22,500
- − Repairs & maintenance
- −$100,813
- − Management
- −$100,813
- − Depreciation
- −$130,909
- Taxable income
- $585,562
- Est. tax owed @ 24.0%
- −$140,535
- After-tax cash flow
- $481,816/yr
For passive investors: Depreciation is non-cash, so a rental often shows a tax loss while cash-flowing — sheltering income. Rental losses are passive: they offset passive income freely, and up to $25,000/yr can offset ordinary (W-2) income if you actively participate and your MAGI is under $100k (phasing out to $0 by $150k); unused losses carry forward. On sale, claimed depreciation is recaptured at up to 25%, and gains may owe capital-gains tax (a 1031 exchange can defer both). Figures are a year-1 estimate at your 24.0% rate — not tax advice; consult a CPA.
Condition & rehab AI · 8 photos
The property presents as a moderate renovation opportunity with average condition. It requires updates to the interior and exterior to improve its curb appeal and functionality, which can significantly increase its resale and rental value.
Repairs flagged
- Minor Kitchen cabinets — Worn and dated appearance.
- Minor Bathroom fixtures — Basic and dated appearance.
- Minor Exterior paint — Some discoloration and wear visible.
- Minor Interior paint — Signs of wear and could benefit from a fresh coat.
- Minor HVAC maintenance — Functional but may need maintenance.
Value-add opportunities
- Both Painting and updating the interior and exterior — Fresh paint and updated decor can significantly enhance the property's curb appeal and interior aesthetics, attracting more potential buyers or renters.
- Both Upgrading the kitchen and bathrooms — Modernizing the kitchen and bathrooms can improve functionality and appeal, making the property more attractive to potential buyers or renters.
- Both Landscaping and curb appeal improvements — Enhancing the landscaping and curb appeal can make the property more attractive and increase its overall value.
Renovation cost estimate screening
| Repair item | Severity | Est. cost |
|---|---|---|
| Kitchen cabinets · Worn and dated appearance. | Minor | $500–3,000 |
| Bathroom fixtures · Basic and dated appearance. | Minor | $500–3,000 |
| Exterior paint · Some discoloration and wear visible. | Minor | $500–3,000 |
| Interior paint · Signs of wear and could benefit from a fresh coat. | Minor | $500–3,000 |
| HVAC maintenance · Functional but may need maintenance. | Minor | $500–3,000 |
| Total estimated repair cost · 5 items | $2,500–15,000 |
Value-add ROI direction
- Both Painting and updating the interior and exterior — Fresh paint and updated decor can significantly enhance the property's curb appeal and interior aesthetics, attracting more potential buyers or renters. ↑
- Both Upgrading the kitchen and bathrooms — Modernizing the kitchen and bathrooms can improve functionality and appeal, making the property more attractive to potential buyers or renters. ↑
- Both Landscaping and curb appeal improvements — Enhancing the landscaping and curb appeal can make the property more attractive and increase its overall value. ↑
ⓘ Cost ranges are severity-bucket heuristics (US national rule-of-thumb). Get contractor quotes + a written scope before underwriting a rehab budget.
Schools (NCES district)
- District
- San Francisco Unified
- NCES district ID
- 0634410
- Math proficiency
- 50% ▬ 0.00%
- Reading proficiency
- 56% ▲ 1.00%
- Median HH income
- $81,249
- Composite
- 50.14/100
- National rank
- #4088
- State rank
- #322 of 1400 in CA
Livability — San Francisco
- Score
- 76/100
- State rank
- #90
- US rank
- #3143
Category grades
Schools grade is shown separately in the Schools card above.
Census & demographics
- Census place
- San Francisco, CA
- County
- San Francisco County · 827,552 people
- City population
- 827,552
- Metro
- San Francisco-Oakland-Berkeley, CA
- Population (ZIP)
- 54,553
- Household income
- $106,018
- Rent vs Own
- Severe rent burden
- 5272.0
Population outlook (San Francisco County) Hauer SSP2
- Today (2025)
- 1,030,936 people
- By 2030
- 1,110,409 · +7.7%
- By 2040
- 1,270,010 · +23.2%
- By 2050
- 1,435,001 · +39.2%
- By 2075
- 1,779,074 · +72.6%
- By 2100
- 1,966,767 · +90.8%
Race, ethnicity, and origin ACS 2023
- Neighborhood character
- Diverse neighborhood (Simpson 0.66)
- Race & ethnicity
- White 50% Asian 27% Hispanic / Latino 13% Two or more races 10% Black 4%
- Hispanic origin (detail)
- Mexican 7% Puerto Rican 1%
- Common ancestry
- Lithuanian 3% Italian 3% Romanian 2%
- Foreign-born
- 31% · China, Canada, Vietnam
- Languages at home
- 64% English-only · Chinese 10% Spanish 7% Other Asian/Pacific 4%
Political lean MEDSL · San Francisco
- 2024 margin
- Solid D (+64.8) · D 80.3% · R 15.5% · Other 4.1%
- 2008→2024 swing
- -5.7pp toward R · 2008: 70.5pp · 2024: 64.8pp
- All cycles
- 2024: D+64.8 2020: D+72.5 2016: D+76.1 2012: D+70.2 2008: D+70.5
Not yet ingested
- Civics
- —
Market trends
- HPI YoY
- ▲ 5.02%
- Current HPI
- 175.8886
- Rent YoY
- ▲ 15.60%
- Metro
- San Francisco-Oakland-Berkeley, CA
- State GDP YoY
- ▲ 3.21%
- F500 in state
- 116
Industry mix (Fortune 500 HQ in CA)
| Industry | F500 HQs | Revenue |
|---|---|---|
| Technology | 27 | $1,492B |
|
||
| Financial Services | 3 | $174B |
|
||
| Retail | 3 | $44B |
|
||
| Insurance | 3 | $26B |
|
||
| Media / Entertainment | 2 | $115B |
|
||
| Pharmaceuticals / Biotech | 2 | $62B |
|
||
Price history
-24.4% since first listed3 events — show timeline
- 2026-04-23 Listed $4,500,000 San Francisco MLS
- 2025-01-30 Listed $5,950,000 San Francisco MLS
- 2022-11-28 Listed $5,950,000 San Francisco MLS
Cash-flow waterfall
monthlySold comps — $/sqft
last 12 mo · ≤1 miLoading sold comps…