 9-Plex
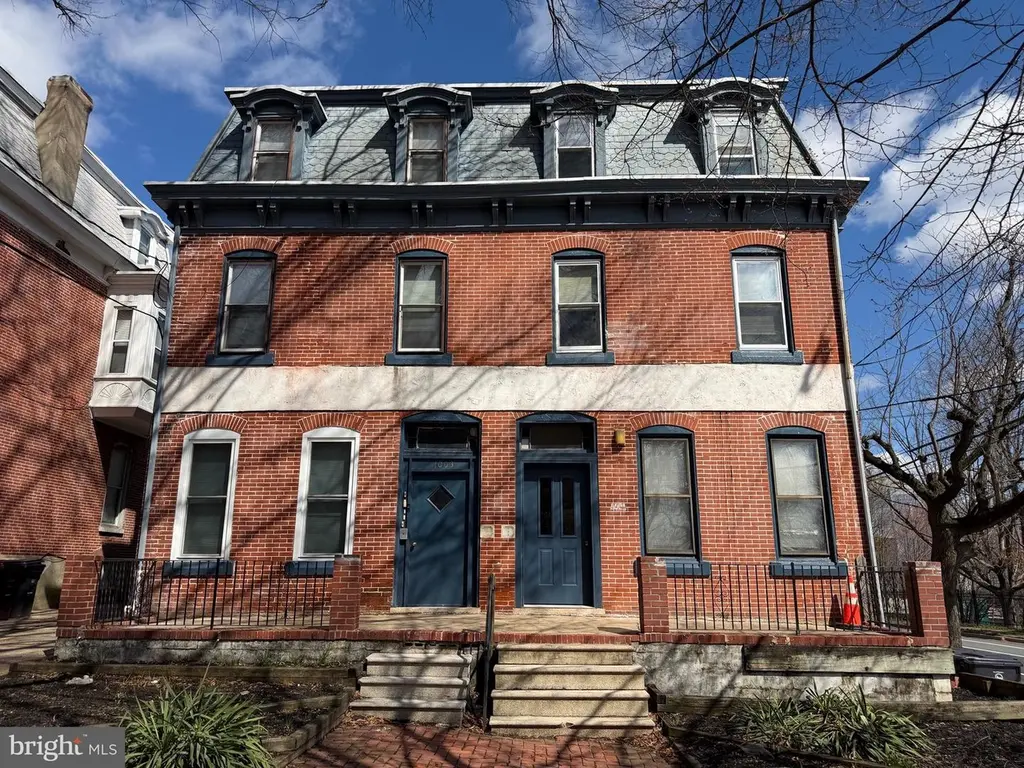
1001 & 1003 W. 8th St. W 8th St · Wilmington, DE
Flood risk No data
- FEMA flood zone
- —
- Chance of flooding over 30 yrs
- —
- Est. flood insurance / yr
- —
Fire risk No data
- Est. fire insurance / yr
- —
Heat risk No data
- Hot days now (above threshold)
- —
- Hot days in 30 yrs
- —
Wind risk No data
- Chance of severe wind over 30 yrs
- —
Air-quality risk No data
- Unhealthy air days now
- —
- Unhealthy air days in 30 yrs
- —
Risk factors via First Street. Map © Google.
Why this score? — see what drove the B- grade
The composite is a weighted blend of 9 inputs, each scored 0–100. Each bar is that input's sub-score; the figure is the points it added to the 100-point composite (weight × sub-score).
- Cash flow +30.0/30.0
- 1% rule +10.0/10.0
- DSCR +10.0/10.0
- ARV discount +7.5/15.0
- Rent growth +3.8/5.0
- Livability +3.2/5.0
- Schools +3.1/10.0
- Condition / age +2.2/5.0
- Appreciation +0.0/10.0
$1,050,000
🖨 Deal sheet 📄 Offer letter ✓ Due diligence
Multi-family units
County records classify this as Multi-Family (2-4 Unit). Listing-text estimate: 9 units. estimate disagrees with records
Listing remarks MLS
Welcome to Cool Springs, located on the Westside of the City of Wilmington! Proximity to highways, places of worship, educational facilities, and moments to hot spots in Trolley Square, Union Street, and the Central Business district downtown, this is right in the middle of it all! Nine unit apartment building comprised of two structures with separate entrances with a common access basement is ready for its next operator. 1001 offers four units while 1003 offers five. A sliver of off street parking rounds out the amenities for tenants and management alike. An eclectic mix of modern and functional units that afford a cozy lifestyle for tenants. Separate systems make operation dynamics a breeze and keep owner expenses to a minimum. Excellent opportunity for some value add projects while repositioning of rents to increase cash flow and maximize return on investment. Could be the cornerstone of a performing portfolio, or a healthy addition to a scaled operation. A unique opportunity in a desirable locale for the smart investor to capitalize on!
Key facts
- Off street parking
- Separate systems
- 4,935 sq ft lot
Tags
Neighborhood map
What this means for you Summary
Snapshot
- This is a 4×4bd/1ba + 5×5bd/1ba units multifamily listed at $1.05M. Condition is rated fair.
Deal economics
- At list price, monthly cash flow is $7k ($89k/yr) — positive. Per door: $826/mo.
- The deal already cash-flows at list — no discount required.
- Meets the 1% rule at list price ($19k rent vs $1.05M).
- Recommended offer: $987k (6.0% below list) — sets the bar for market timing.
- Cap rate 14.8% vs local median 5.6% in Wilmington — top-decile yield for the area; either an underpriced asset or a hidden risk that comps aren't pricing in. Stress-test before assuming the spread holds.
Location & tenants
- Location reads 64/100 on livability (#52 in DE) — a middle-class / working-renter tenant base. Strengths: cost of living A+, housing A; Watch: employment D+, schools D, commute D.
- Red Clay Consolidated School District (suburban): math 27% / reading 42% proficiency, ranked #12 of 26 in DE (top 46%) — families likely to look elsewhere, expect single-tenant / working-renter base with shorter leases.
- Market conditions: Rents rising fast (+5.1%/yr); 59 active listings in the ZIP; solid renter incomes; 1,367 units permitted in New Castle County in 2024 (201 in 5+ unit buildings).
- At $18,597/mo this rent would consume 251% of the median local household income ($89k/yr) (locally 508% of renters already pay >50% of income on rent) — very limited rent-growth headroom before tenants either downsize or default.
Forward outlook
- Local home prices are declining (-3.0%/yr); year-one equity from $7k of loan paydown is wiped out by about $32k of value loss. Plan a longer hold.
- New Castle County population projected at +9% by 2050 — modest demand growth; plan on rents tracking national, not racing it.
- At projected returns (-3.0% appreciation + 5.1% rent growth), your $294k cash investment doubles in ~4 years — after that, you're playing with house money.
Negotiation context
- It's been on market 61 days — a 6% lower offer ($987k) is reasonable based on typical stale-listing flexibility.
Risks & watch-outs
- Watch-outs: built in 1889 — expect roof / HVAC / electrical / plumbing capex.
Questions for the listing agent
- It's been on market 61 days. Have you received any prior offers? Is the seller open to a 6% concession, seller financing, or rate buy-down credit?
- Can we see the unit-by-unit rent roll, current vacancy, and any below-market leases? What's the average tenancy length?
- What capital expenditures (roof, boiler, parking lot, exteriors) have been made in the last 5 years, and what's planned in the next 2?
- Have any recent inspections been done? Can we get a copy of the seller's disclosures and any deferred-maintenance estimates?
- Built in 1889 — when were the roof, HVAC, electrical panel, plumbing, and water heater last replaced?
- Why hasn't it sold? Are there any deal-killer items the seller is aware of (foundation, flood, title, zoning, code violations)?
- Is there a deadline driving the sale (1031 exchange, divorce, estate, relocation)? That informs how much negotiation room exists.
- Schools are D-rated, which usually means shorter tenancies and higher turnover. Who's the typical renter profile here, and what's been the actual vacancy rate?
- Crime grade is F in this area — have there been break-ins, vandalism, or insurance claims at this property in the last 3 years? What carrier currently insures it and at what premium?
- What's the average days-on-market for RENTAL listings here right now (not sales)? A rising rental-DOM trend means longer vacancies and softer asking-rent achievability than the comps imply.
- What's the recent tenant-quality profile in this submarket — average credit score on applications, eviction rate, late-payment / NSF rate, and stable-employment percentage? A property-management company in the area should have these aggregated.
- How much new apartment / multifamily construction is in the pipeline within 1–3 miles? Heavy new supply (>2% of stock underway) typically softens rents 12–24 months out; light construction supports rent growth.
Investment metrics
- 1% rule
- 1.77% ✓
- Cap rate
- 14.79%
- Cash-on-cash
- 30.35%
- DSCR
- 2.35
- GRM
- 4.7
CMA / ARV
- ARV (median comp)
- $534,000
- List price
- $1,050,000
- Delta
- 96.63%
- Verdict
- OVERPRICED
- Comps
- 13 within 1.0 mi
Projected returns pro-forma
-3.0% appreciation · 5.1% rent growth · sell at horizon
- IRR
- 27.4%
- Equity multiple
- 2.17×
- Total profit
- $343,811
- Equity at exit
- $156,558
- IRR
- 36.1%
- Equity multiple
- 4.68×
- Total profit
- $1,082,153
- Equity at exit
- $90,785
Cash invested: $294,000 (down + closing). Projections, not guarantees.
Landlord ↔ Tenant lean methodology
- Overall (STATE)
- 70 Landlord-Friendly
- State Delaware
- 70 Landlord-Friendly · D+7
- County
- — inherits STATE
- City
- — inherits STATE
ZIP-level market 19806
- Rents YoY
- 5.1%
- Active inventory
- 59
- Price-to-rent
- 44.3×
Monthly cashflow live
- Estimated rent
- $18,597 medium interval (Pro) →
- Mortgage (P&I)
- −$5,506
- Tax est. 1.5%
- −$1,312 /mo · $15,750/yr
- Insurance
- −$438
- HOA
- −$0
- Vacancy / Maint / Mgmt
- −$3,905
- Net cashflow
- $7,435
Break-even live
9-unit breakdown (identical units grouped — click to expand)
| Units | Beds | Baths | Est. rent |
|---|---|---|---|
| 4× units | 4 | 1 | $7,892 |
| #1 | 4 | 1 | $1,973 |
| #2 | 4 | 1 | $1,973 |
| #3 | 4 | 1 | $1,973 |
| #4 | 4 | 1 | $1,973 |
| 5× units | 5 | 1 | $10,705 |
| #5 | 5 | 1 | $2,141 |
| #6 | 5 | 1 | $2,141 |
| #7 | 5 | 1 | $2,141 |
| #8 | 5 | 1 | $2,141 |
| #9 | 5 | 1 | $2,141 |
| Total (9 units) | $18,597 | ||
UW: 25.0% down · 7.5% · 30yr · 1.5% tax · 5.0% vac · 8.0% maint · 8.0% mgmt
Financing live
Cash to close
- Down payment
- $262,500
- Closing costs
- $31,500
- Reserves months
- —
- Total cash needed
- —
Loan-product check · same deal, 3 products live
Conventional
25% down · 7.5% · 30yr
- Down + closing
- —
- Monthly P&I
- —
- Monthly cashflow
- —
- DSCR
- —
- Eligible?
- —
Personal DTI + credit; lowest rate.
DSCR
20% down · 8.5% · 30yr
- Down + closing
- —
- Monthly P&I
- —
- Monthly cashflow
- —
- DSCR
- —
- Eligible?
- —
No personal income docs; deal must DSCR.
Hard money
10% down · 12.0% · 12mo
- Down + closing
- —
- Monthly P&I
- —
- Monthly cashflow
- —
- DSCR
- —
- Eligible?
- —
Short-term bridge; refi at stabilization.
Listing history 15 events
-
2026-06-18days on market $1,050,000 Active 61 DOM
-
2026-06-17days on market $1,050,000 Active 60 DOM
-
2026-06-16days on market $1,050,000 Active 59 DOM
-
2026-06-15days on market $1,050,000 Active 58 DOM
-
2026-06-13days on market $1,050,000 Active 56 DOM
-
2026-06-13days on market $1,050,000 Active 55 DOM
-
2026-06-09days on market $1,050,000 Active 52 DOM
-
2026-06-08days on market $1,050,000 Active 51 DOM
-
2026-06-07days on market $1,050,000 Active 50 DOM
-
2026-06-04days on market $1,050,000 Active 47 DOM
-
2026-06-03days on market $1,050,000 Active 46 DOM
-
2026-06-02days on market $1,050,000 Active 45 DOM
-
2026-06-01days on market $1,050,000 Active 44 DOM
-
2026-05-31days on market $1,050,000 Active 43 DOM
-
2026-04-18$1,050,000 Active 1058-char remark
Show marketing remark (1058 chars)
Welcome to Cool Springs, located on the Westside of the City of Wilmington! Proximity to highways, places of worship, educational facilities, and moments to hot spots in Trolley Square, Union Street, and the Central Business district downtown, this is right in the middle of it all! Nine unit apartment building comprised of two structures with separate entrances with a common access basement is ready for its next operator. 1001 offers four units while 1003 offers five. A sliver of off street parking rounds out the amenities for tenants and management alike. An eclectic mix of modern and functional units that afford a cozy lifestyle for tenants. Separate systems make operation dynamics a breeze and keep owner expenses to a minimum. Excellent opportunity for some value add projects while repositioning of rents to increase cash flow and maximize return on investment. Could be the cornerstone of a performing portfolio, or a healthy addition to a scaled operation. A unique opportunity in a desirable locale for the smart investor to capitalize on!
ⓘ Source: listings_history table (triggers on properties + properties_extension) + one-shot
backfill from property_details.listing_events for pre-trigger history.
Nearby sold comps map
Loading sold comps map…
Walkable amenities ~0.75 mi
Loading nearby amenities…
Taxation est. · year 1
- Rental income
- $223,164
- − Mortgage interest
- −$58,816
- − Property taxes
- −$15,750
- − Insurance
- −$5,250
- − Repairs & maintenance
- −$17,853
- − Management
- −$17,853
- − Depreciation
- −$30,545
- Taxable income
- $77,096
- Est. tax owed @ 24.0%
- −$18,503
- After-tax cash flow
- $70,721/yr
For passive investors: Depreciation is non-cash, so a rental often shows a tax loss while cash-flowing — sheltering income. Rental losses are passive: they offset passive income freely, and up to $25,000/yr can offset ordinary (W-2) income if you actively participate and your MAGI is under $100k (phasing out to $0 by $150k); unused losses carry forward. On sale, claimed depreciation is recaptured at up to 25%, and gains may owe capital-gains tax (a 1031 exchange can defer both). Figures are a year-1 estimate at your 24.0% rate — not tax advice; consult a CPA.
Condition & rehab AI · 12 photos
This multi-family property requires moderate repairs and maintenance to improve its condition and value. Updates to the interior, landscaping, and flooring would significantly enhance its appeal for both resale and rental.
Repairs flagged
- Minor Stairs — Worn carpet
- Minor Kitchen cabinets — Dated appearance
- Minor Bathrooms — Dated fixtures
Value-add opportunities
- Both Paint and interior updates — Fresh paint and updated fixtures would enhance both resale and rental appeal
- Both New flooring — New flooring would improve both the aesthetic and functionality of the property
- Both Landscaping — Well-maintained landscaping would improve curb appeal and attract potential tenants
Renovation cost estimate screening
| Repair item | Severity | Est. cost |
|---|---|---|
| Stairs · Worn carpet | Minor | $500–3,000 |
| Kitchen cabinets · Dated appearance | Minor | $500–3,000 |
| Bathrooms · Dated fixtures | Minor | $500–3,000 |
| Total estimated repair cost · 3 items | $1,500–9,000 |
Value-add ROI direction
- Both Paint and interior updates — Fresh paint and updated fixtures would enhance both resale and rental appeal ↑
- Both New flooring — New flooring would improve both the aesthetic and functionality of the property ↑
- Both Landscaping — Well-maintained landscaping would improve curb appeal and attract potential tenants ↑
ⓘ Cost ranges are severity-bucket heuristics (US national rule-of-thumb). Get contractor quotes + a written scope before underwriting a rehab budget.
Schools (NCES district)
- District
- Red Clay Consolidated School District
- NCES district ID
- 1001300
- Math proficiency
- 27% ▼ -11.00%
- Reading proficiency
- 42% ▼ -7.00%
- Median HH income
- $64,298
- Composite
- 31.25/100
- National rank
- #6027
- State rank
- #12 of 26 in DE
Livability — Wilmington
- Score
- 64/100
- State rank
- #52
- US rank
- #14251
Category grades
Schools grade is shown separately in the Schools card above.
Census & demographics
- Census place
- Wilmington, DE
- County
- New Castle County · 483,412 people
- City population
- 173,480
- Metro
- Philadelphia-Camden-Wilmington, PA-NJ-DE-MD
- Population (ZIP)
- 9,777
- Household income
- $88,855
- Rent vs Own
- Severe rent burden
- 508.0
Population outlook (New Castle County) Hauer SSP2
- Today (2025)
- 594,686 people
- By 2030
- 609,164 · +2.4%
- By 2040
- 632,154 · +6.3%
- By 2050
- 649,068 · +9.1%
- By 2075
- 687,771 · +15.7%
- By 2100
- 694,961 · +16.9%
Race, ethnicity, and origin ACS 2023
- Neighborhood character
- Predominantly White (77%)
- Race & ethnicity
- White 77% Black 11% Two or more races 5% Hispanic / Latino 4% Asian 1%
- Common ancestry
- Romanian 7% Slovak 3% Lithuanian 2%
- Foreign-born
- 5% · Canada
- Languages at home
- 94% English-only · Other Indo-European 2% Spanish 2% Russian/Polish/Slavic 1%
Political lean MEDSL · New Castle
- 2024 margin
- Solid D (+32.6) · D 65.5% · R 32.9% · Other 1.6%
- 2008→2024 swing
- -8.1pp toward R · 2008: 40.6pp · 2024: 32.6pp
- All cycles
- 2024: D+32.6 2020: D+37.1 2016: D+29.6 2012: D+34.1 2008: D+40.6
Not yet ingested
- Civics
- —
Market trends
- HPI YoY
- ▼ -290.78%
- Current HPI
- 214.8382
- Rent YoY
- ▲ 5.10%
- Metro
- Philadelphia-Camden-Wilmington, PA-NJ-DE-MD
- State GDP YoY
- —
- F500 in state
- 0
Price history
1 event — show timeline
- 2026-04-18 Listed $1,050,000 BRIGHT MLS
Cash-flow waterfall
monthlySold comps — $/sqft
last 12 mo · ≤1 miLoading sold comps…